0952
Individual identification using brain functional fingerprint detected by recurrent neural network1The Wallace H. Coulter Department of Biomedical Engineering, Georgia Institute of Technology, Atlanta, GA, United States, 2Department of Bioengineering, University of California, Riverside, Riverside, CA, United States
Synopsis
We introduce a deep learning approach to derive functional fingerprint of the brain that can identify individuals. By investigating the features extracted by our model, we noticed that they mostly resemble the existing resting state networks, and three networks (default mode, attention, and frontopariental control networks) contribute the most to individual discriminability.
Introduction
Individual variability of brain functional organization is observable using functional magnetic resonance imaging (fMRI)1,2. Moreover, functional connectivity (FC) has been branded as a “functional connectome fingerprint” which can distinguish each subject from a large group1. However, it has also been shown that FC’s individual discriminability decreases when using fewer time frames of fMRI data. In this study, we combine enormous amount of fMRI data with deep learning approaches to identify individual uniqueness through their brain function. We introduce a data-driven sequential model that can not only achieve much higher accuracy than FC with a short period of data, but also reveal what features of the brain contribute to individual identification.Methods
FMRI data of 100 subjects from human connectome project (HCP) was used in this work (age: 22-36+, gender: 46 male/ 54 female, TR=0.72 second). Each subject has 4 different scans with a total duration of 57.6 minutes (14.4 minutes x 4). We used the data that was denoised with ICA-FIX and registered to group level cortical surface template with MSM-All from HCP preprocessing pipeline3. To reduce computational complexity, signals from 236 regions of interest (ROIs)4 were extracted by averaging time courses of voxels within a 5 mm radius. Data from 3 scans (REST1_LR, REST1_RL and REST2_RL) was adopted as training dataset, and data from REST2_LR was used as testing dataset. The entire scan was cropped into 100-time-frame periods with a step size of 8. Lastly, these short periods were demeaned and normalized within themselves.
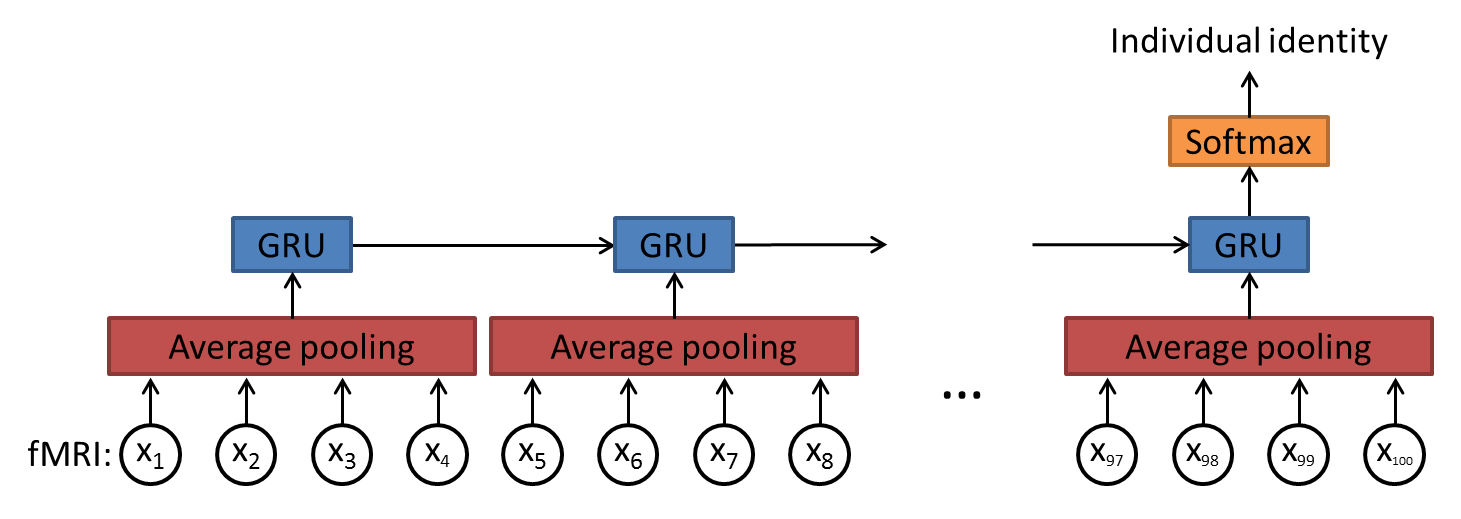
A recurrent neural network was applied to capture the sequential information in fMRI data. Our deep learning model architecture has three layers as shown in Figure 1. The first layer is an average pooling layer with a length of 4 on temporal axis to shorten the number of time steps for the following recurrent layer and thus to reduce computation complexity. A 25% dropout was applied on the input before the pooling layer to alleviate overfitting. The second layer is a recurrent layer with 512 gated recurrent units (GRUs)5 as represented by the following equations:
$$z_t=\sigma(W_z\cdot[h_{t-1},x_t])$$
$$r_t=\sigma(W_r\cdot[h_{t-1},x_t])$$
$$\tilde{h}_t=tanh(W_h\cdot[r_th_{t-1},x_t])$$
$$h_t=(1-z_t)h_{t-1}+z_t\tilde{h}_t)$$
where at time t, xt is the input of GRU; ht is the output of GRU; zt is the update gate and rt is the reset gate. Note that 25% dropout was also applied to both input connections (from xt) and recurrent connections (from ht-1) to reduce overfitting. The top layer is a softmax layer with 100 outputs to predict the individual identity.
Results
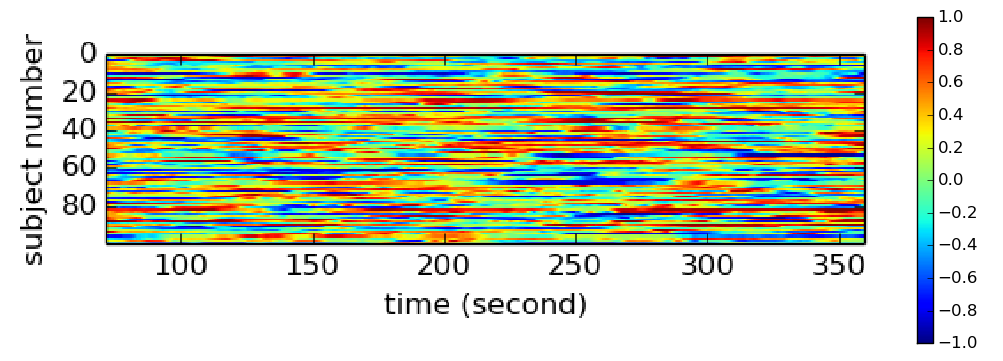
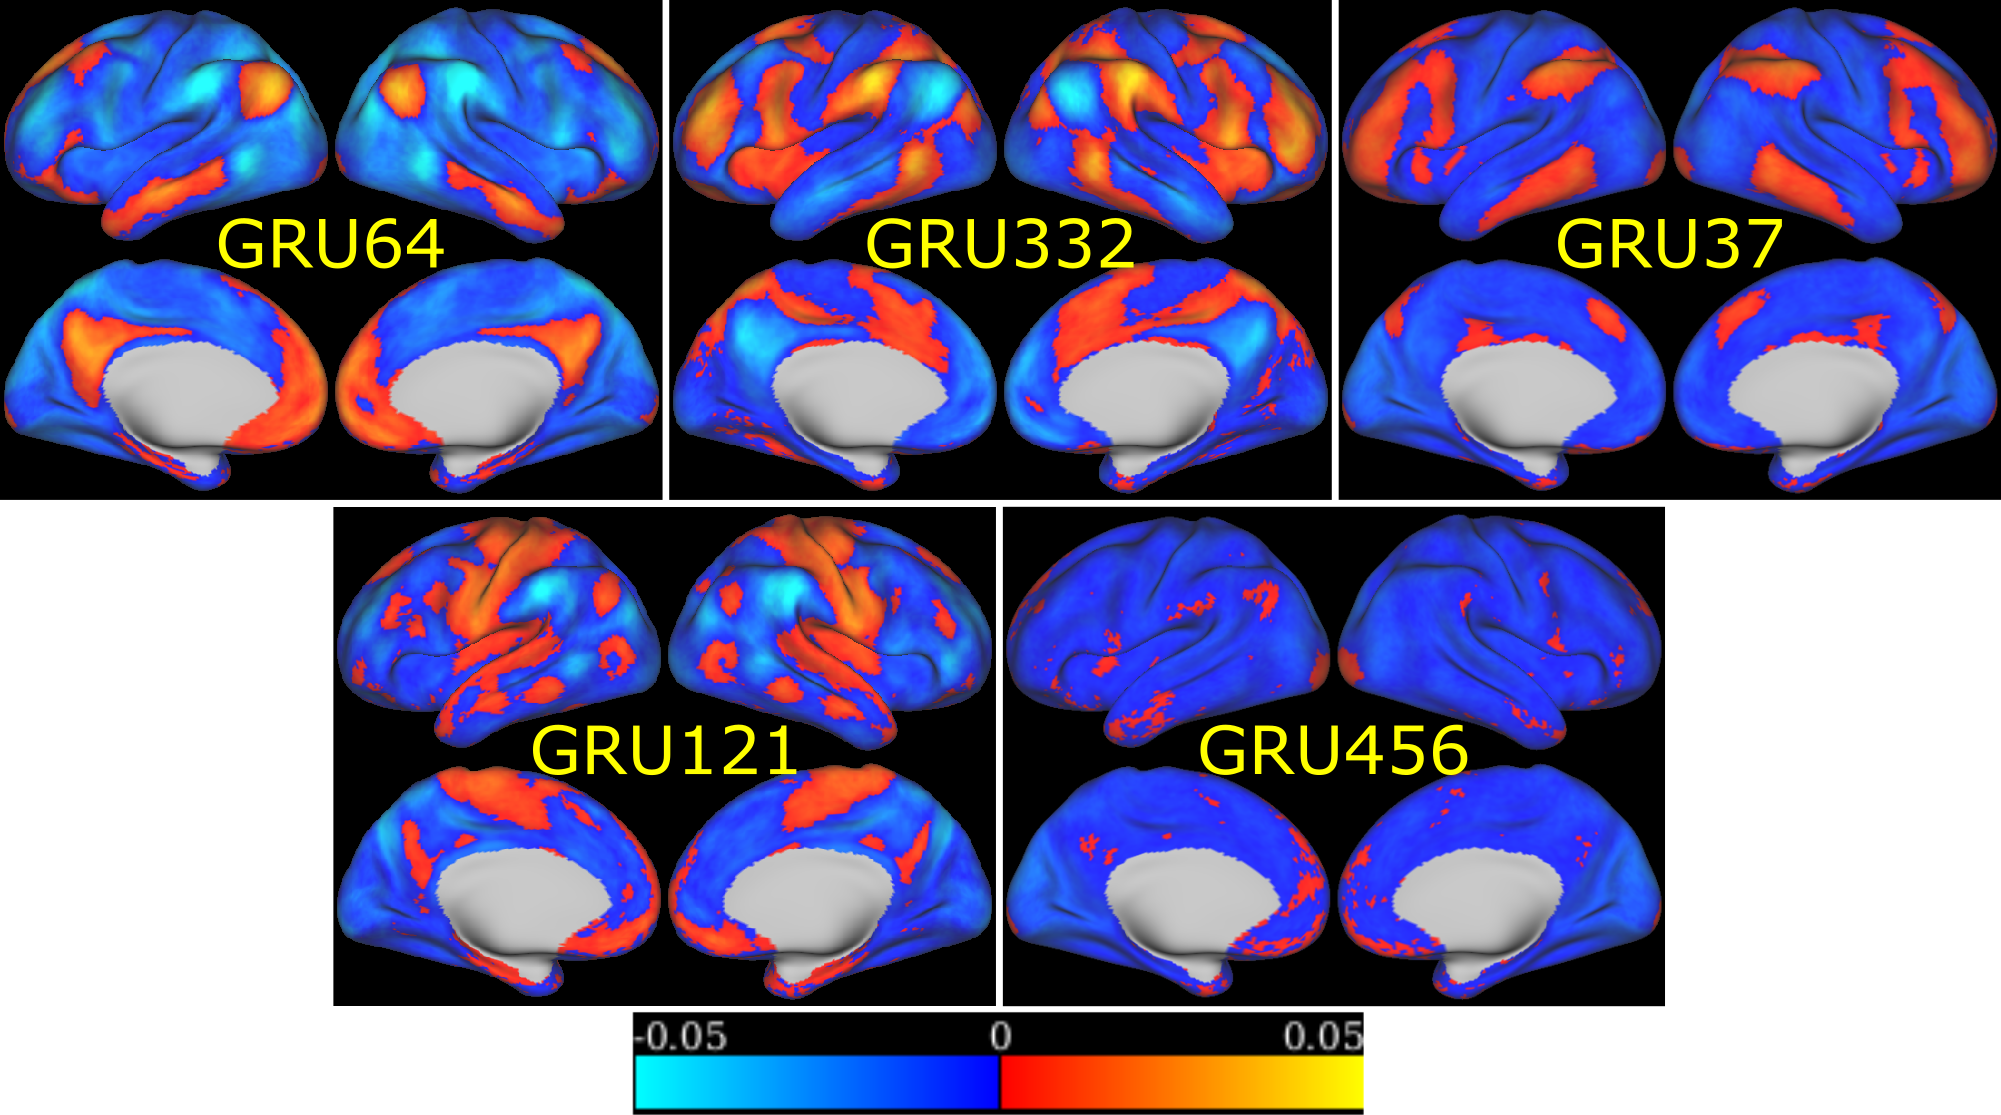
When predicting individual identity using only 100 time-frames (72 seconds) of fMRI data, our model was able to achieve 97.72% accuracy on testing data. In contrast, Functional connectome fingerprint1, which only uses FC, achieved less than 70% accuracy on average. In order to understand how this model identifies individuals, we recorded the output of GRUs, as shown in Figure 2, when testing data was fed into our model. This output was then correlated with the original fMRI time series to identify what brain activation pattern each GRU is sensitive to. We found that most of the 512 activation patterns resemble resting state networks (RSNs) in literature6,7. Figure 3 shows examples of activation patterns in 5 different RSNs. We also noticed that different GRUs may be sensitive to the same RSN with slightly different patterns. Figure 4 shows the top three RSNs with the most varieties.Discussion and Conclusion
Plenty of efforts have been devoted to reducing individual differences, such as developing brain template and registration methods8, so that group level analysis can be conducted. However, we have shown that individual variability still exists in how the brain functions over time. Given only 72 seconds of fMRI data, we were able to predict individual identity with 97%+ accuracy, which was much higher than the approach that used only FC. This informs us that at a smaller temporal scale, our model can capture more individual variability than traditional FC. In order to test whether this additional discriminability is from neuronal sources or residual physiological signals after the preprocessing steps, we further investigated the output of GRUs and found that most of these GRUs were sensitive to RSNs defined in literature. We also noticed that the same RSN appeared multiple times with slight differences as shown in Figure 4. Some of these duplications are due to the dropout we applied in the model. With dropout layers, the model would keep a certain level of redundancy in order to achieve robust prediction. Within all these similar activation patterns, 3 RSNs (default mode, attention, and frontopariental control networks) have the most varieties, which indicates these 3 RSNs contribute the most to individual subject discriminability.
In the future, we believe individual identification can be used as a pre-training step of deep learning approaches, and the resultant model can be further fine-tuned to accomplish classification of brain diseases.
Acknowledgements
No acknowledgement found.References
1. Finn, E. S. et al. Functional connectome fingerprinting: identifying individuals using patterns of brain connectivity. Nature neuroscience (2015).
2. Chen, B. et al. Individual Variability and Test-Retest Reliability Revealed by Ten Repeated Resting-State Brain Scans over One Month. PloS one 10, e0144963 (2015).
3. Glasser, M. F. et al. The minimal preprocessing pipelines for the Human Connectome Project. Neuroimage 80, 105-124 (2013).
4. Power, J. D. et al. Functional network organization of the human brain. Neuron 72, 665-678 (2011).
5. Cho, K. et al. Learning phrase representations using RNN encoder-decoder for statistical machine translation. arXiv preprint arXiv:1406.1078 (2014).
6. Yeo, B. T. et al. The organization of the human cerebral cortex estimated by intrinsic functional connectivity. Journal of neurophysiology 106, 1125-1165 (2011).
7. Lee, M. H., Smyser, C. D. & Shimony, J. S. Resting-state fMRI: a review of methods and clinical applications. American Journal of Neuroradiology 34, 1866-1872 (2013).
8. Robinson, E. C. et al. MSM: A new flexible framework for Multimodal Surface Matching. Neuroimage 100, 414-426 (2014).
Figures