0949
Reproducibility of ADC measures by Breast DWI: Results of the ACRIN 6698 Trial1Radiology and Biomedical Imaging, University of California, San Francisco, CA, United States, 2Biostatistics, Brown University, Providence, RI, United States, 3Radiology, University of Washington, Seattle, WA, United States, 4Radiology, University of Michigan Health System, Ann Arbor, MI, United States, 5Radiology, University of Minnesota, Minneapolis, MN, United States, 6University of Pennsylvania, Philadelphia, PA, United States
Synopsis
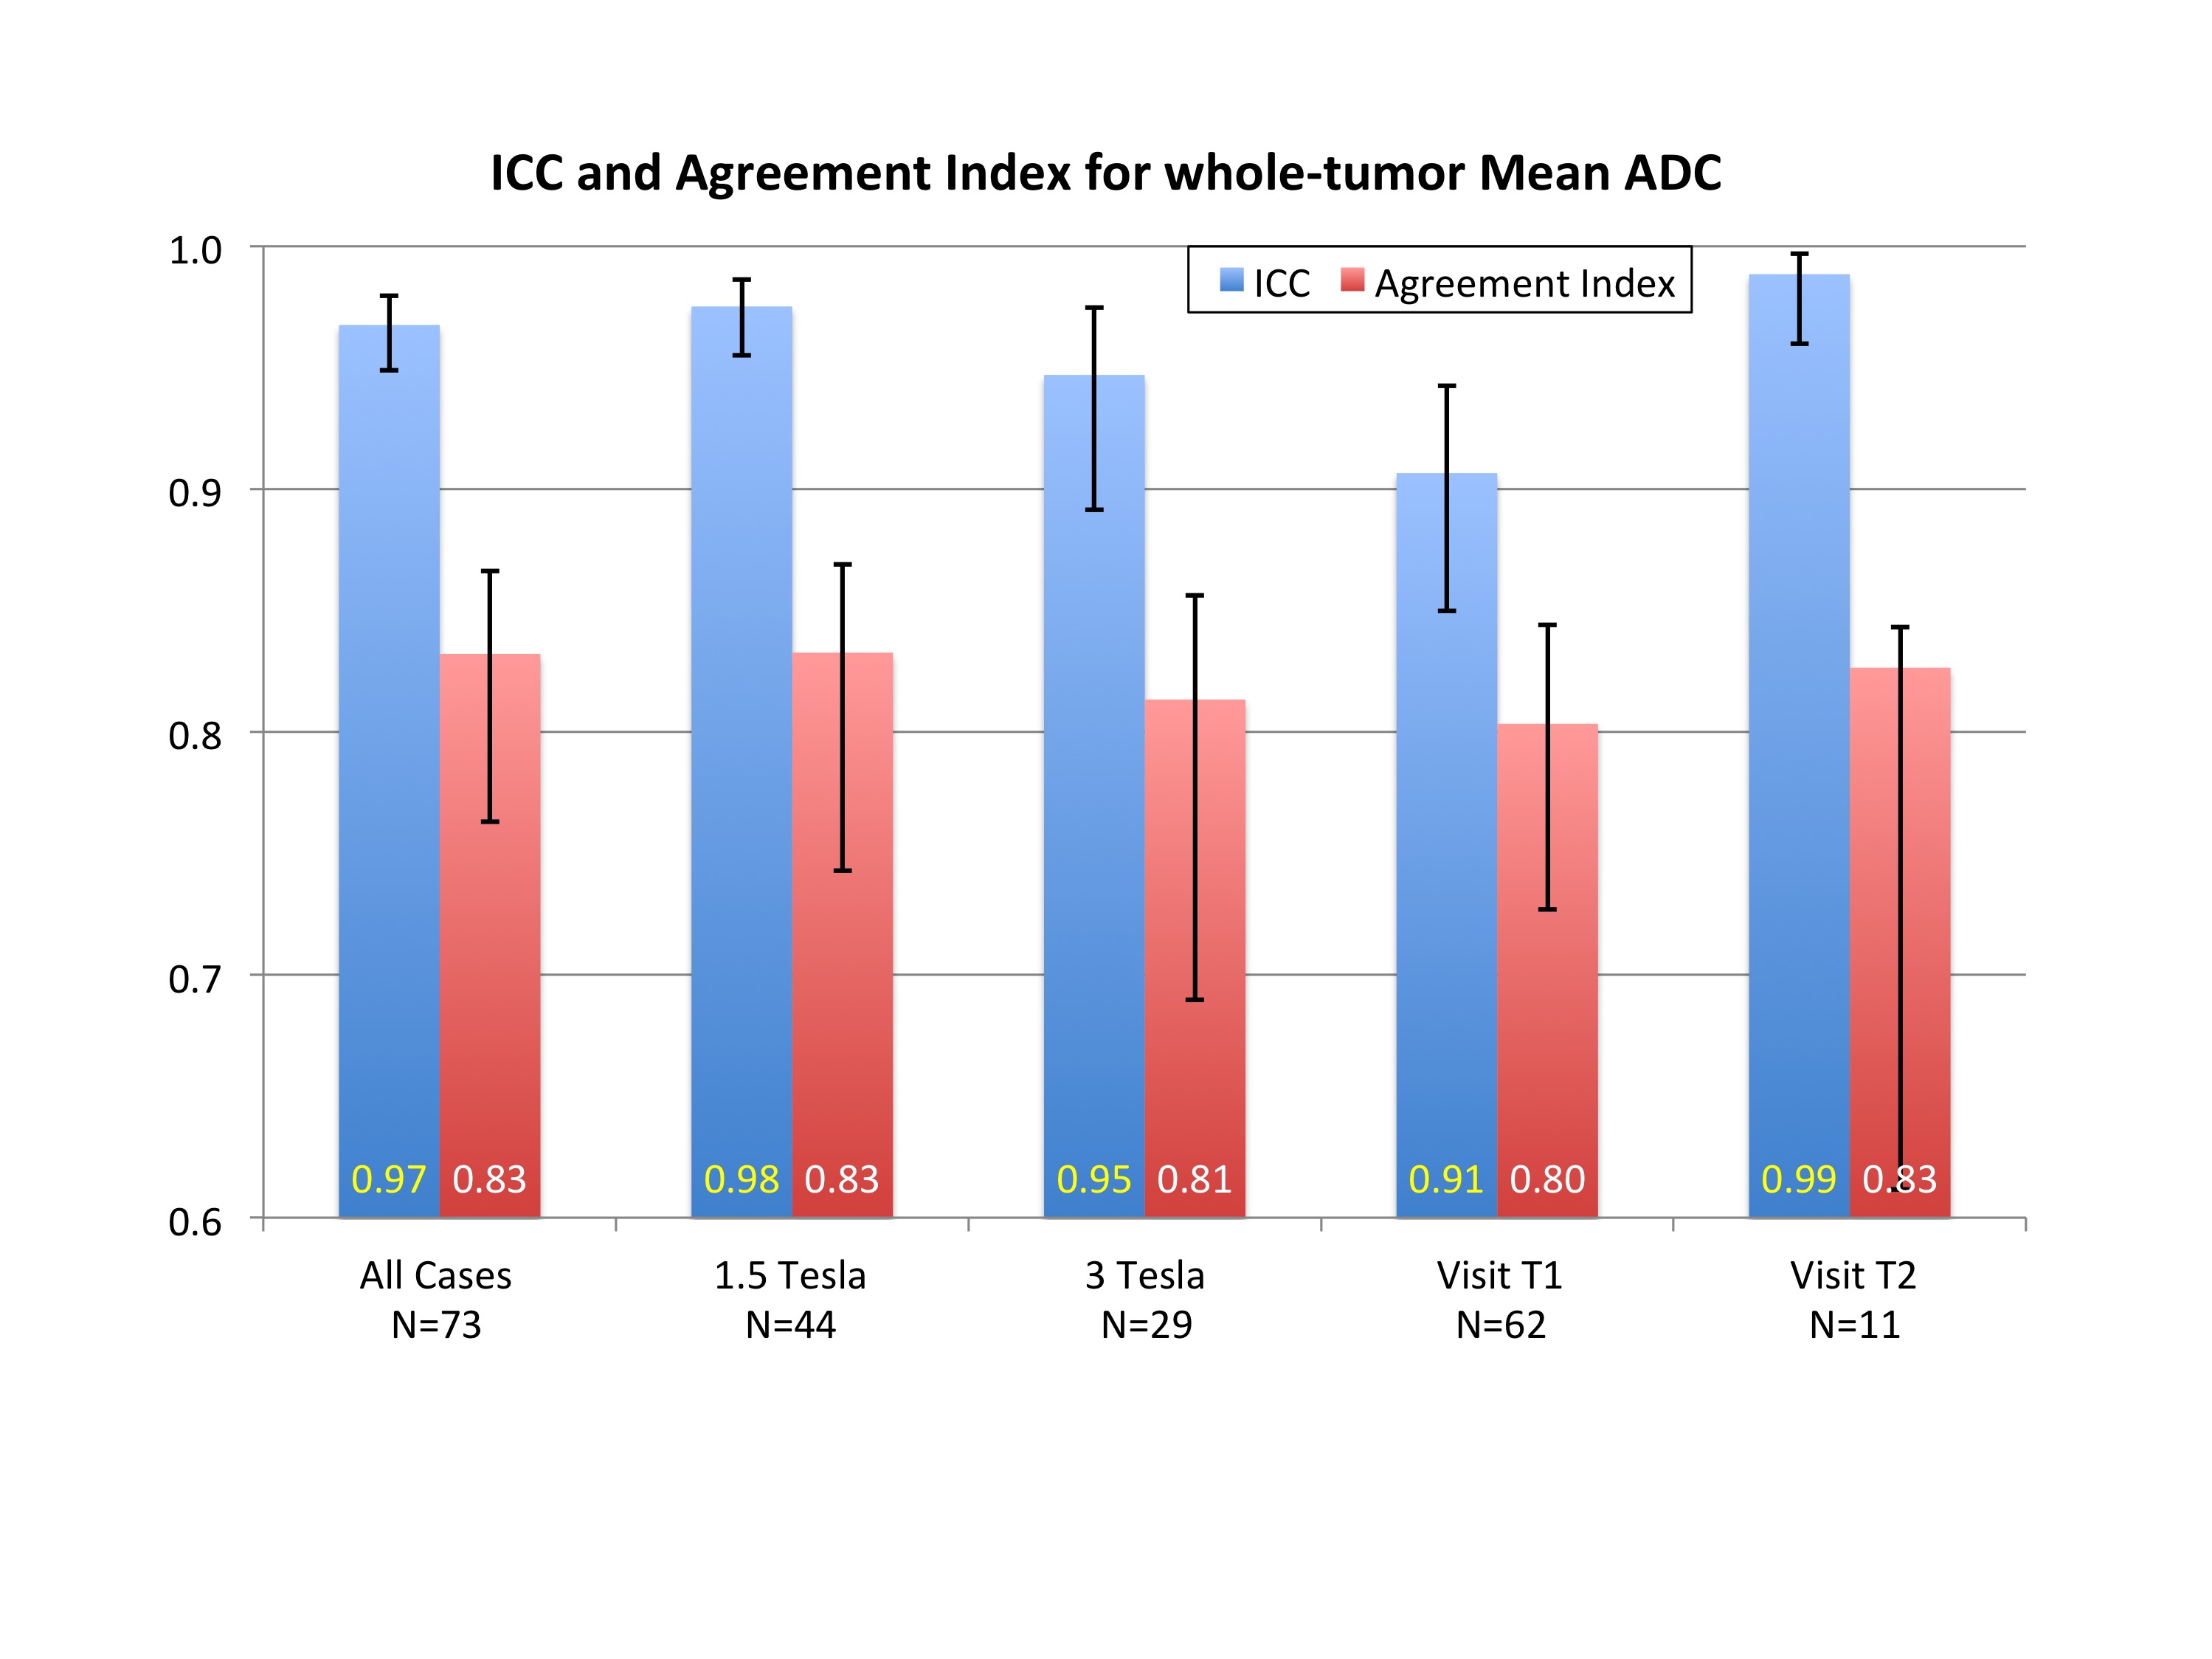
The multi-institutional ACRIN 6698 trial investigates quantitative diffusion weighted imaging (DWI) for assessment of breast cancer response to treatment. A secondary aim is to perform a test/retest study to evaluate reproducibility of ADC measures. In a subset of 91 subjects, DWI was acquired twice in the same exam, before and after patient repositioning. Tumor ADC was measured separately for each acquisition. 80% of cases were found analyzable by a standardized quality-control procedure. Reproducibility of ADC was excellent, with intraclass correlation coefficient of 0.97 (95%CI 0.95, 0.98) and agreement index of 0.83 (95%CI 0.76,0.87). Results were similar for subgroups by field strength or study visit.
Purpose
Apparent diffusion coefficient (ADC) has shown promise as a treatment response marker for breast cancer. In order to interpret the meaning of changes in ADC with treatment, the underlying variability of ADC measurement must be understood. The reproducibility of breast tumor ADC measures was prospectively evaluated as a secondary aim of the multi-institution American College Of Radiology Imaging Network (ACRIN) 6698 Trial1.Methods
The ACRIN 6698 Trial1, a multi-institution sub-study of the I-SPY 2 TRIAL2, is designed to prospectively test the clinical utility of breast tumor ADC as a marker of treatment response in a population of women undergoing neoadjuvant chemotherapy for invasive breast cancer. All patients gave informed consent prior to enrolling in the study. Of 406 patients, 91 patients from 9 institutions also consented to a test-retest DWI examination at either the baseline pre-treatment visit (T1) or after 3 weekly cycles of paclitaxel based treatment (T2). T1 was specified as the preferred visit for test-retest by the study protocol. Patients were scanned with initial localization, T2W, and DWI acquisitions; they were then removed from the scanner and repositioned for a repeat of those 3 acquisitions followed by a DCE acquisition. A standardized 4 b-value (0, 100, 600, 800 sec/mm2), SS-EPI, actively fat suppressed DWI protocol was used at all sites. MRI scanners included 1.5T and 3T models from GE, Siemens and Philips. DICOM images from all acquisitions were deidentified and transmitted with the ACRIN TRIAD system to UCSF for centralized analysis.
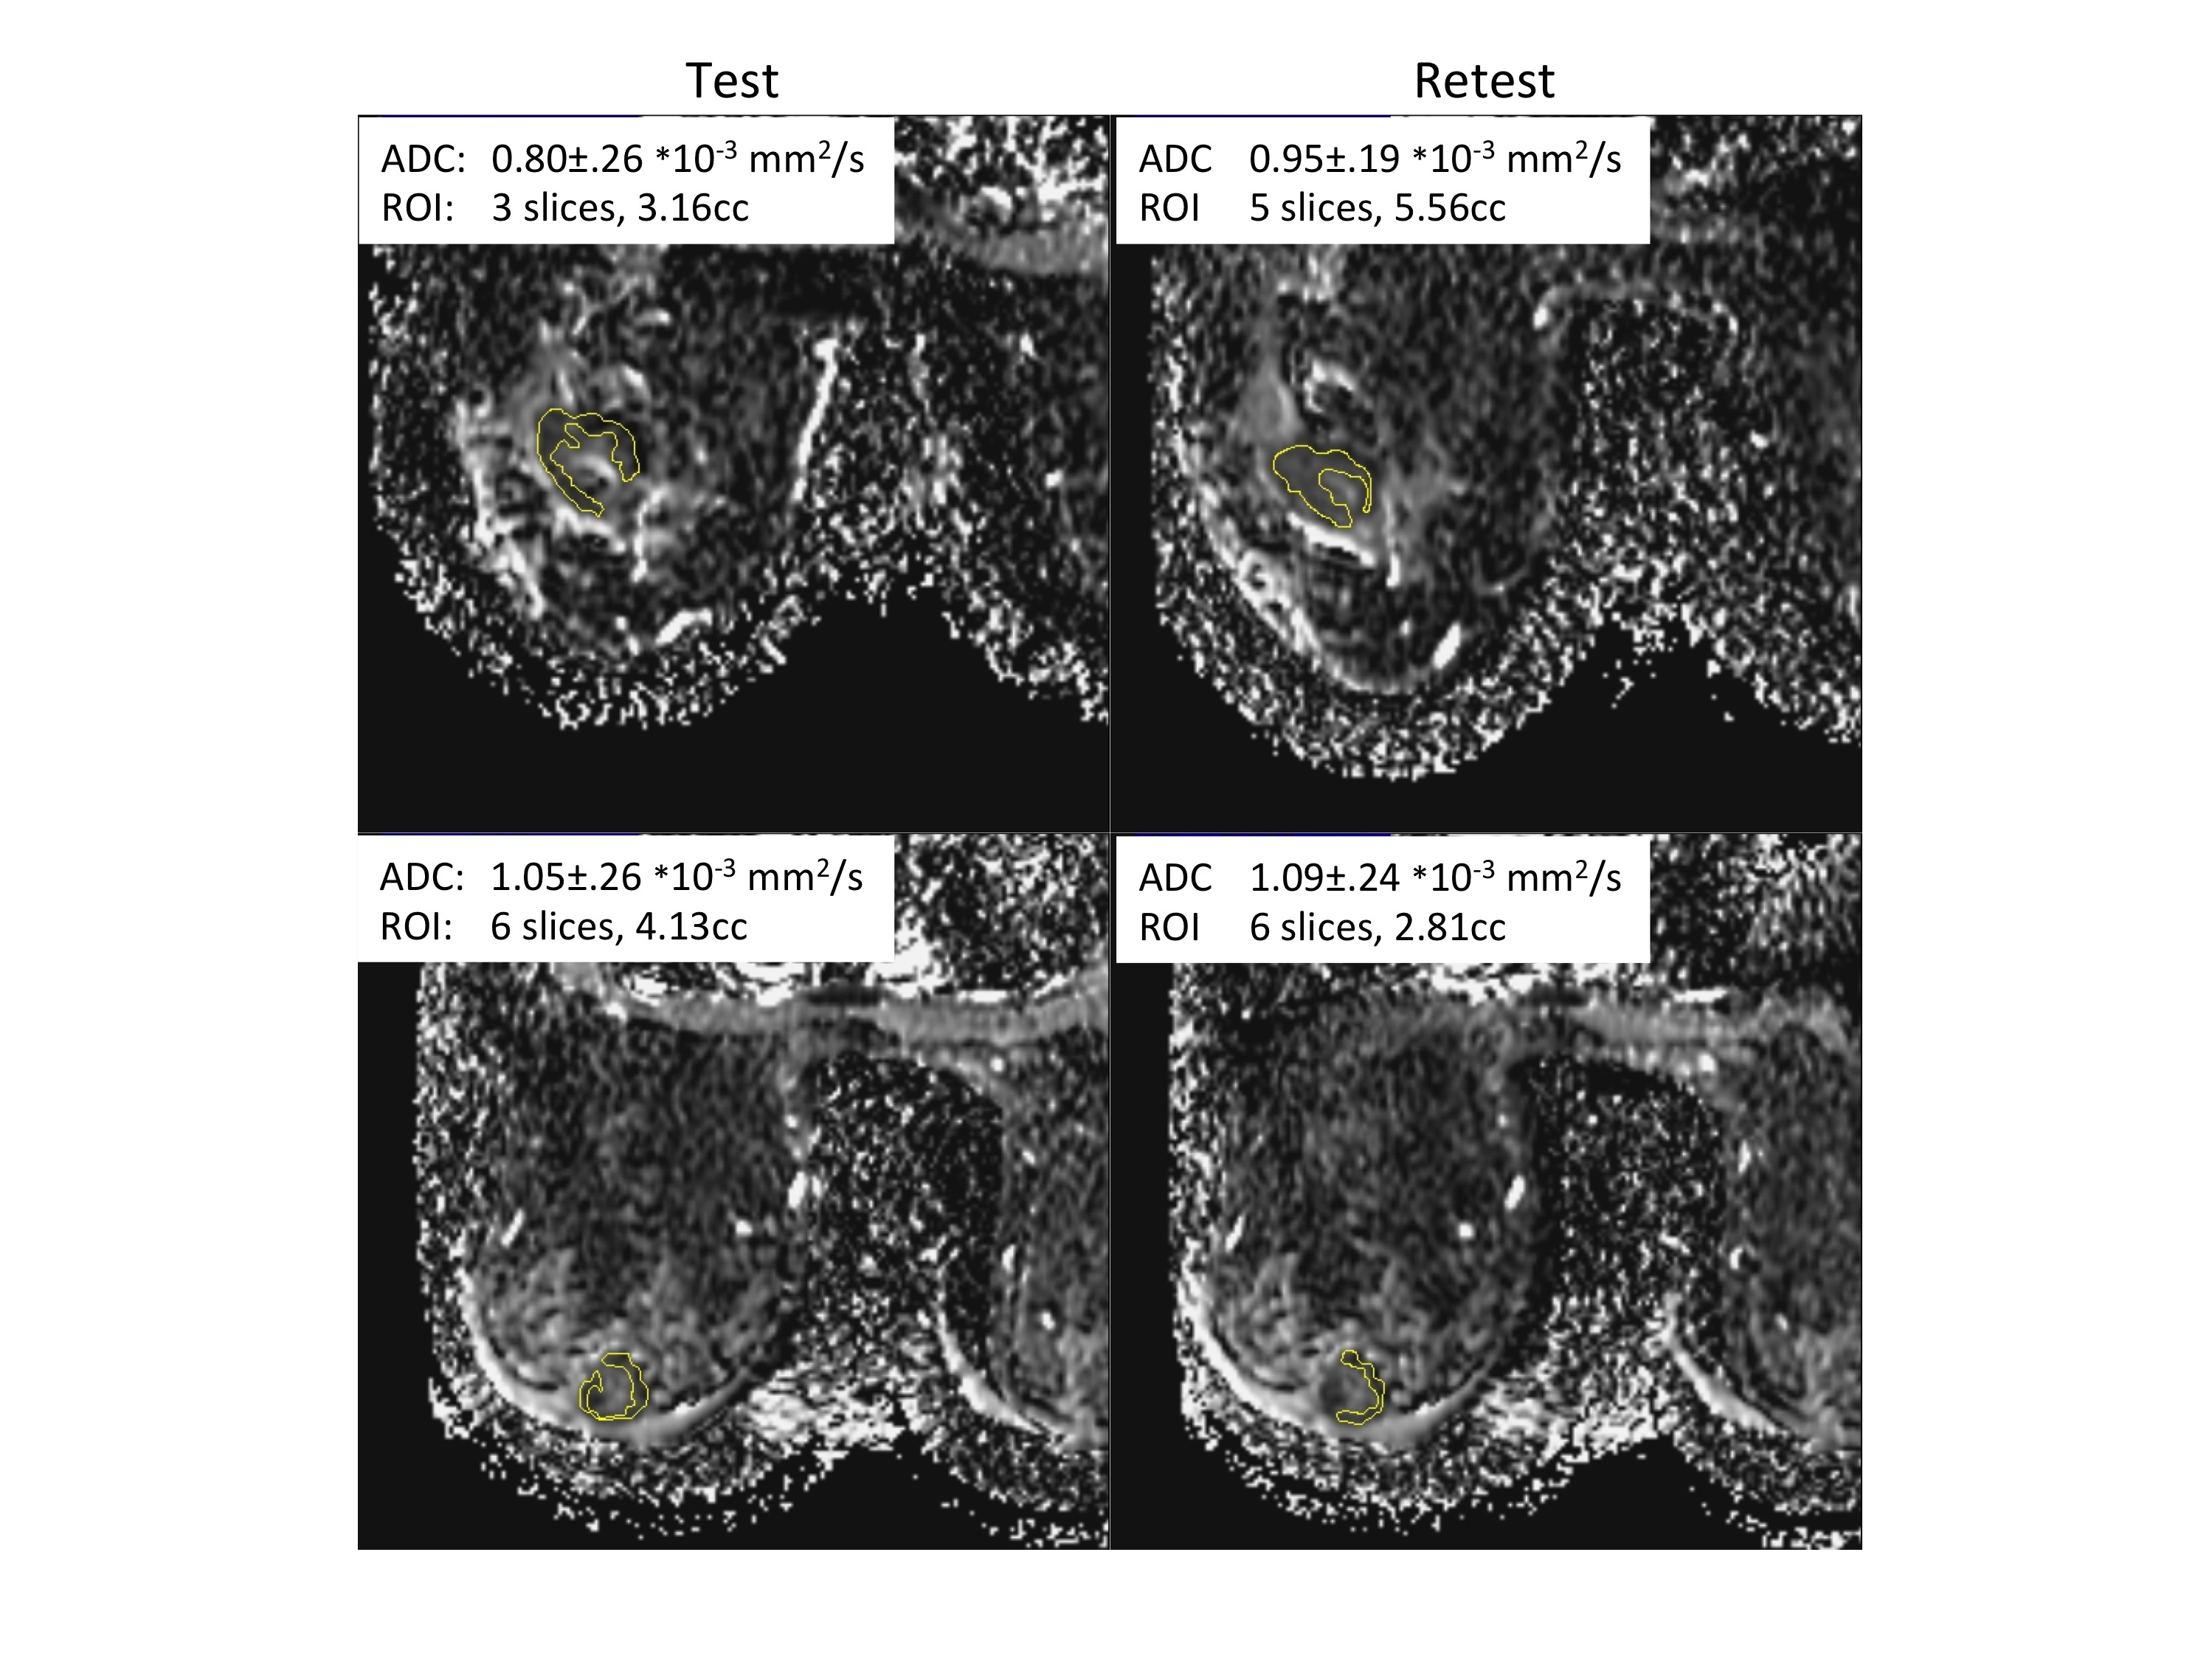
DWI images were assessed with a QA protocol3 for SNR, artifacts and fat suppression, and separately evaluated as analyzable or not. ADC parametric maps were created using a linear least-squares fit of the log of the signal intensities at all 4 b-values. Multi-slice, whole-tumor ROIs were manually defined by 2 trained operators, selecting regions with low ADC and hyperintense on a high b-value DWI. A DCE subtraction image was used to help localize the enhancing tumor and to exclude regions with artifacts from biopsy clips. Test and retest ROIs were defined independently, with the same operator doing both test and retest for a given patient. Mean and median ADC values were calculated for each tumor ROI. The reproducibility of each marker was assessed using within subject coefficient of variation (wCV), intraclass correlation coefficient (ICC1) and agreement index (AI)4.
Results
73 of 91 patients (80%) enrolled at 8 institutions in the test-retest study were assessed as analyzable for tumor ADC through the standardized image QA process. The mean age was 46, median 45, range 27-71 years old. 18 studies were rejected for image quality reasons including excessive artifacts, fat suppression failure, and poor SNR. 44 cases were acquired on 1.5T scanners, 29 on 3T scanners; 62 were done at study visit T1, and 11 at T2.
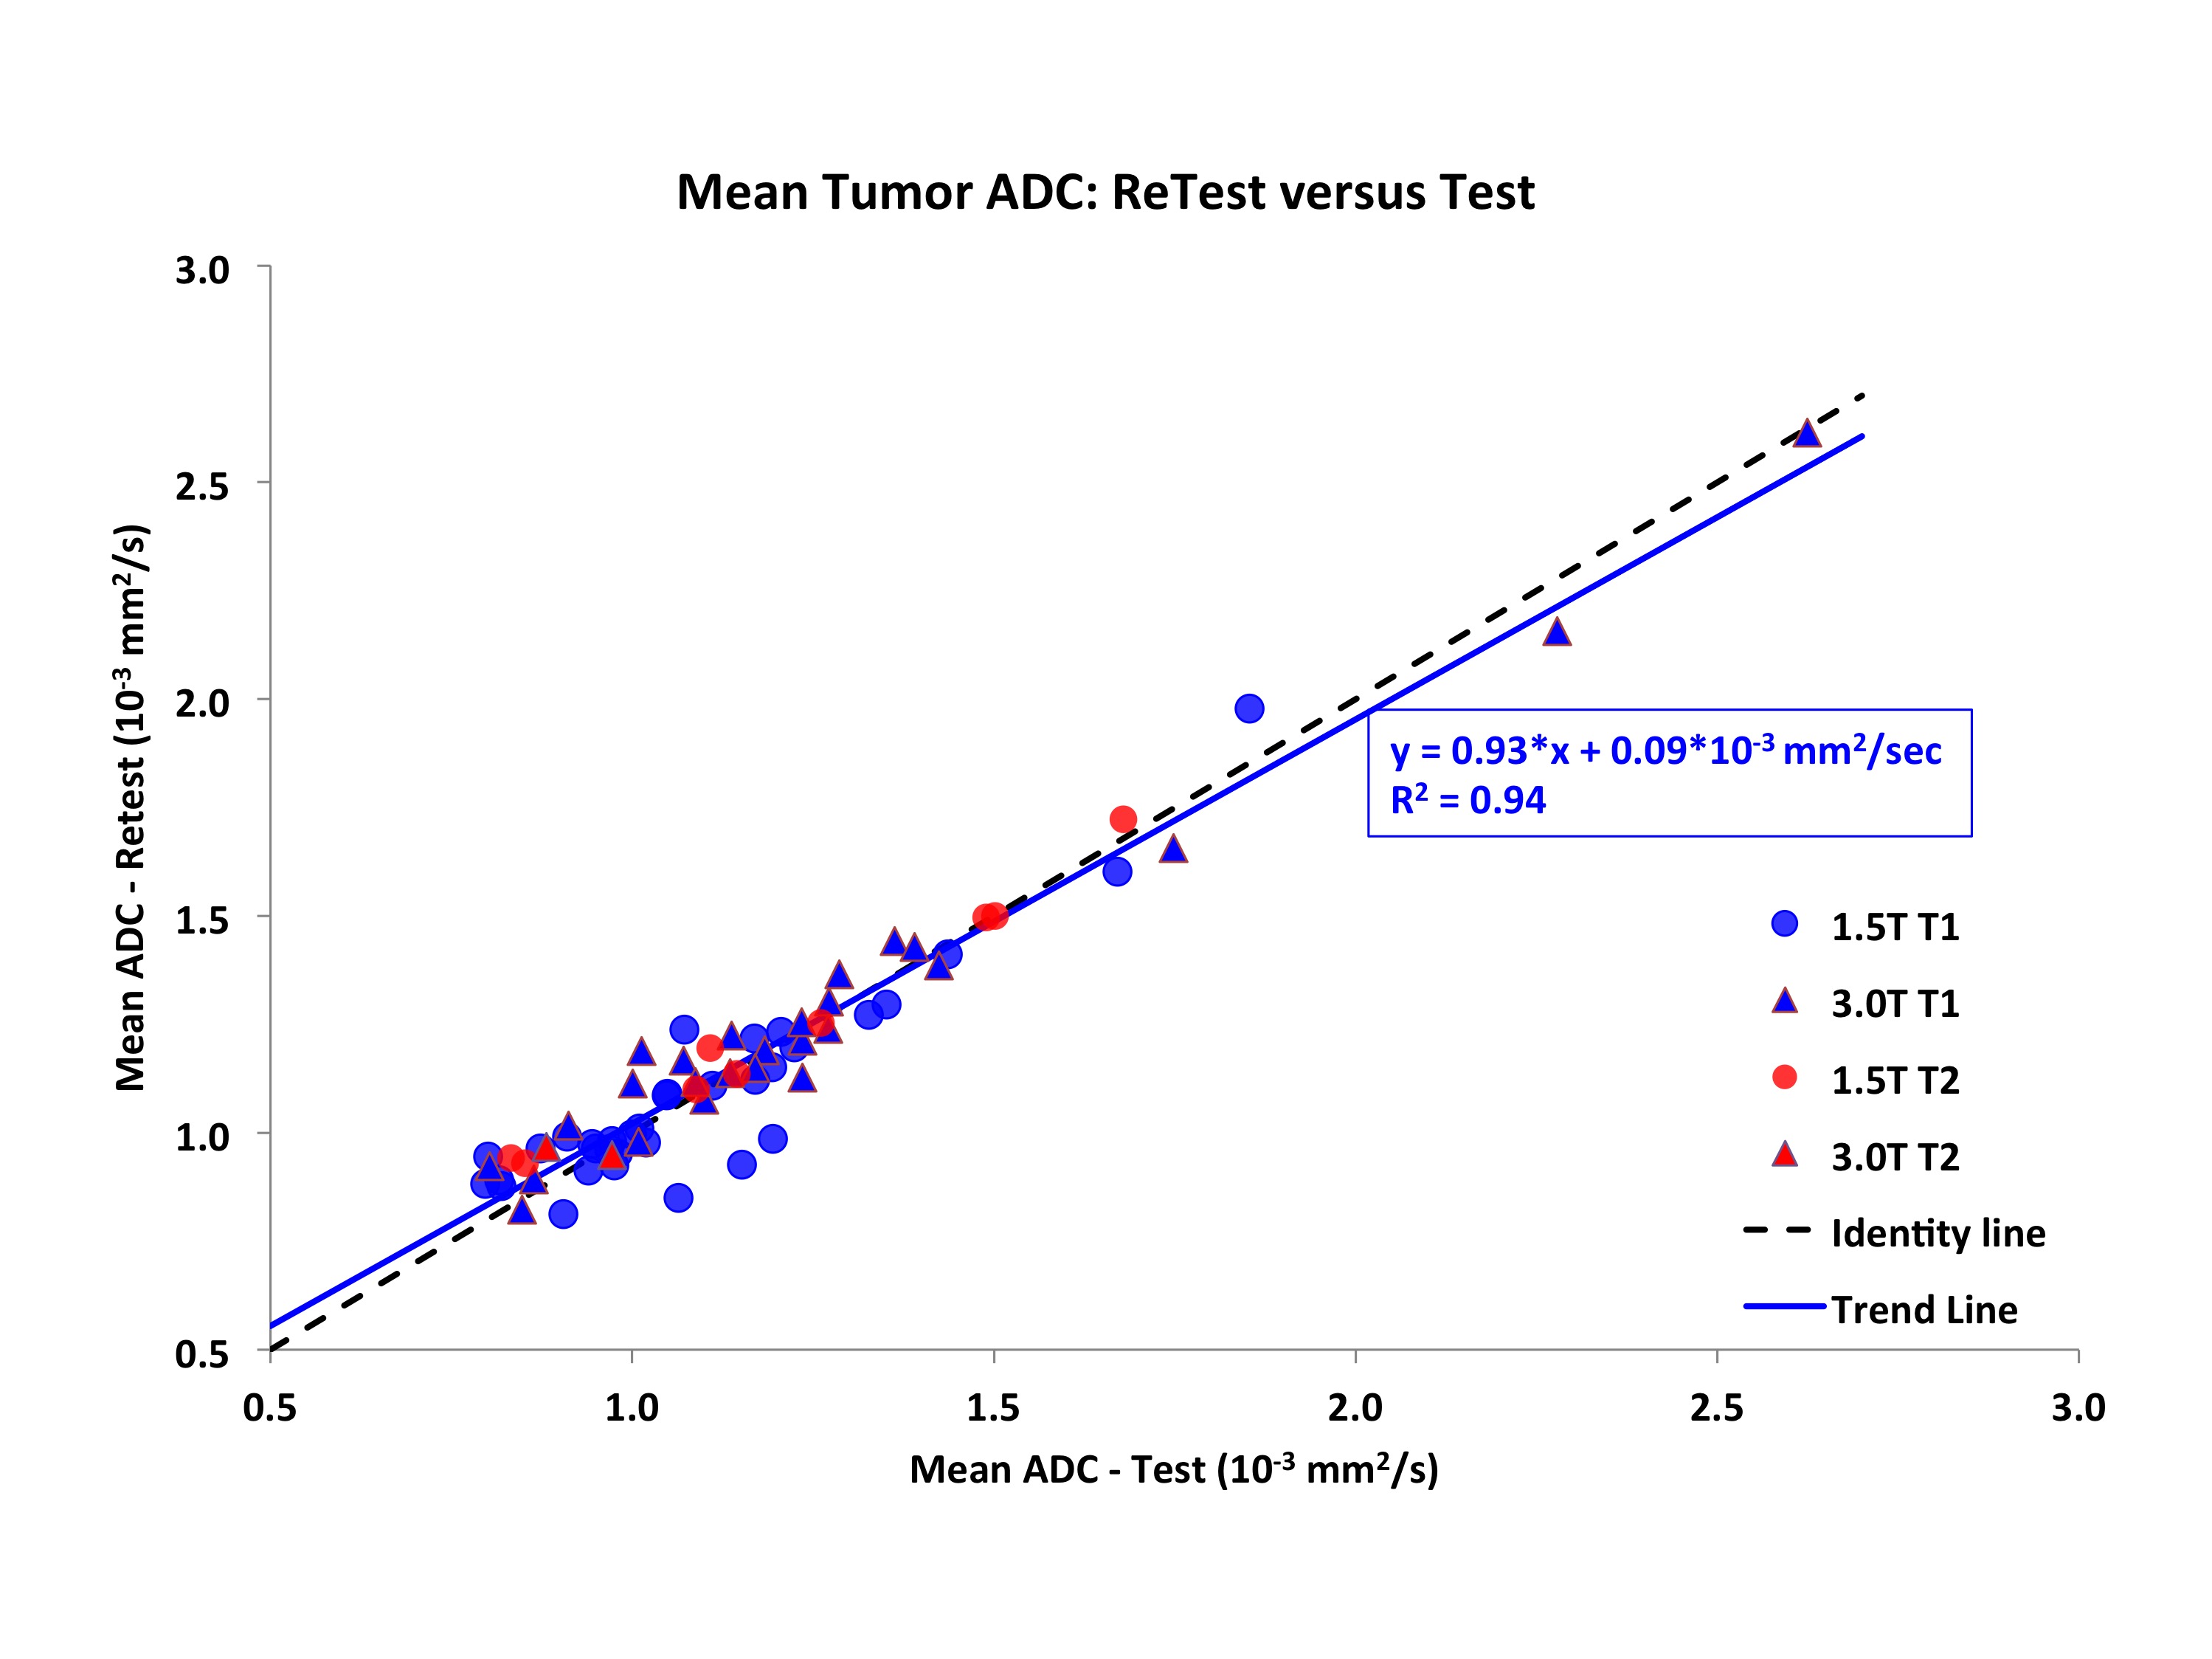
Figure 1 shows test and retest images of example cases with poor and good reproducibility, illustrating the tumor ROI definitions. Overall agreement was excellent (Figure 2) with a mean percent difference of -0.89±7.7% (mean±SD) and wCV = 4.9% (95%CI 4.0-5.7%). Tumor ADC values ranged from 0.8 to 2.6 * 10-3 mm2/sec. Figure 3 shows Bland-Altman plots for the whole cohort and for subgroups by field strength. Reproducibility of tumor ADC measures was excellent by all measures (Figure 4), with ICC1 values ranging from 0.91 to 0.99 and AI from 0.80 to 0.83.
ROI median ADC values were very closely correlated to the means (Pearson correlation coefficient r>0.997) with reproducibility results essentially identical (ICC1 = .968, .966 and AI = .832, .831 for mean, median respectively); hence only mean results are presented in detail here.
Discussion
DWI is particularly challenging in the breast due to motion, off-isocenter effects and SNR considerations; and protocols vary widely between institutions. These issues contribute to an underlying variability in ADC measures and affect the reliability of ADC as a marker of treatment response. This study addressed the reproducibility of ADC measures in the breast in a multi-center setting using a standardized and quality-controlled DWI protocol. Excellent agreement in repeat measures of ADC was found, and reproducibility was not influenced by field strength or treatment time-point.Conclusion
Breast tumor ADC measures can be made reproducibly across a multi-center multi-platform clinical study using a standardized quality-controlled DWI protocol with an 80% yield of analyzable cases.Acknowledgements
We sincerely thank the patients who participated in this trial, and the ACRIN and I-SPY patient advocates for their dedicated support.
We acknowledge and thank all members of the ACRIN 6698 Trial Team and the I-SPY 2 TRIAL investigators network for their substantial contributions.
This research was supported by National Institutes of Health Grants: U01CA151235, R01CA132870, U01CA079778 and U01CA080098
References
1. American College Of Radiology Imaging Network (ACRIN) 6698 Trial, Diffusion Weighted MR Imaging Biomarkers for Assessment of Breast Cancer Response to Neoadjuvant Treatment. https://www.acrin.org/6698_protocol.aspx
2. I SPY2 TRIAL: Investigation of Serial studies to Predict Your Therapeutic Response with Imaging And moLecular analysis. http://www.ispytrials.org/home
3. Aliu S, Newitt D, Li W, et al. Quality assessment and ranking system for quantitative breast diffusion-weighted imaging of the breast in the ACRIN 6698 trial. Proceedings ISMRM, 2015, Toronto, Canada.
4. Zhang Z, Wang Y and Duan F (2014) An AUC-like Index for Agreement Assessment. Journal of Biopharmaceutical Statistics. 24(4): 893-907. doi: 10.1080/10543406.2014.901345.
Figures