0945
Multi-parametric Diffusion-weighted Imaging Models: Useful Tools for Diagnosis and Prognosis in Breast Cancer?1Department of Radiology, Ren Ji Hospital, School of Medicine, Shanghai Jiao Tong University, Shanghai, People's Republic of China, 2MR Clinical Science, Philips Healthcare, Greater China, Shanghai, People's Republic of China
Synopsis
Multi-parametric diffusion-weighted imaging (DWI) has shown potential in characterizing breast cancer. In this study, we for the first time evaluated the four common diffusion models in various breast lesions. Results showed that (1) optimal DWI signal attenuation behaviors differ between benign and malignant breast lesions (kurtosis model suited for benign and stretched-exponential model suited for malignant); (2) for predicting the malignancy of breast lesions, or the invasive nature of breast cancer, mono-exponential ADC is still the most preferred parameter; and (3) parameters based on non-mono-exponential DWI models may be more related with prognostic factors in invasive breast cancer.
Purpose
Multi-parametric diffusion-weighted imaging (DWI) models have received more attention in breast nowadays since they may account for the complicated diffusion behaviour of water molecules, and more metrics have been proposed to attempt to reveal the intrinsic features of tissue microenvironment, as compared with the conventional mono-exponential model. 1-3 However, there are still few reports on their comparison of utility in evaluation of breast lesions. 4 The purpose of this study was to compare determine the utility of multi-parametric DWI including the mono-exponential, bi-exponential, stretched-exponential and kurtosis models in the differentiation and characterization of breast lesions, and assess their associations with prognostic factors in invasive breast cancer.Methods
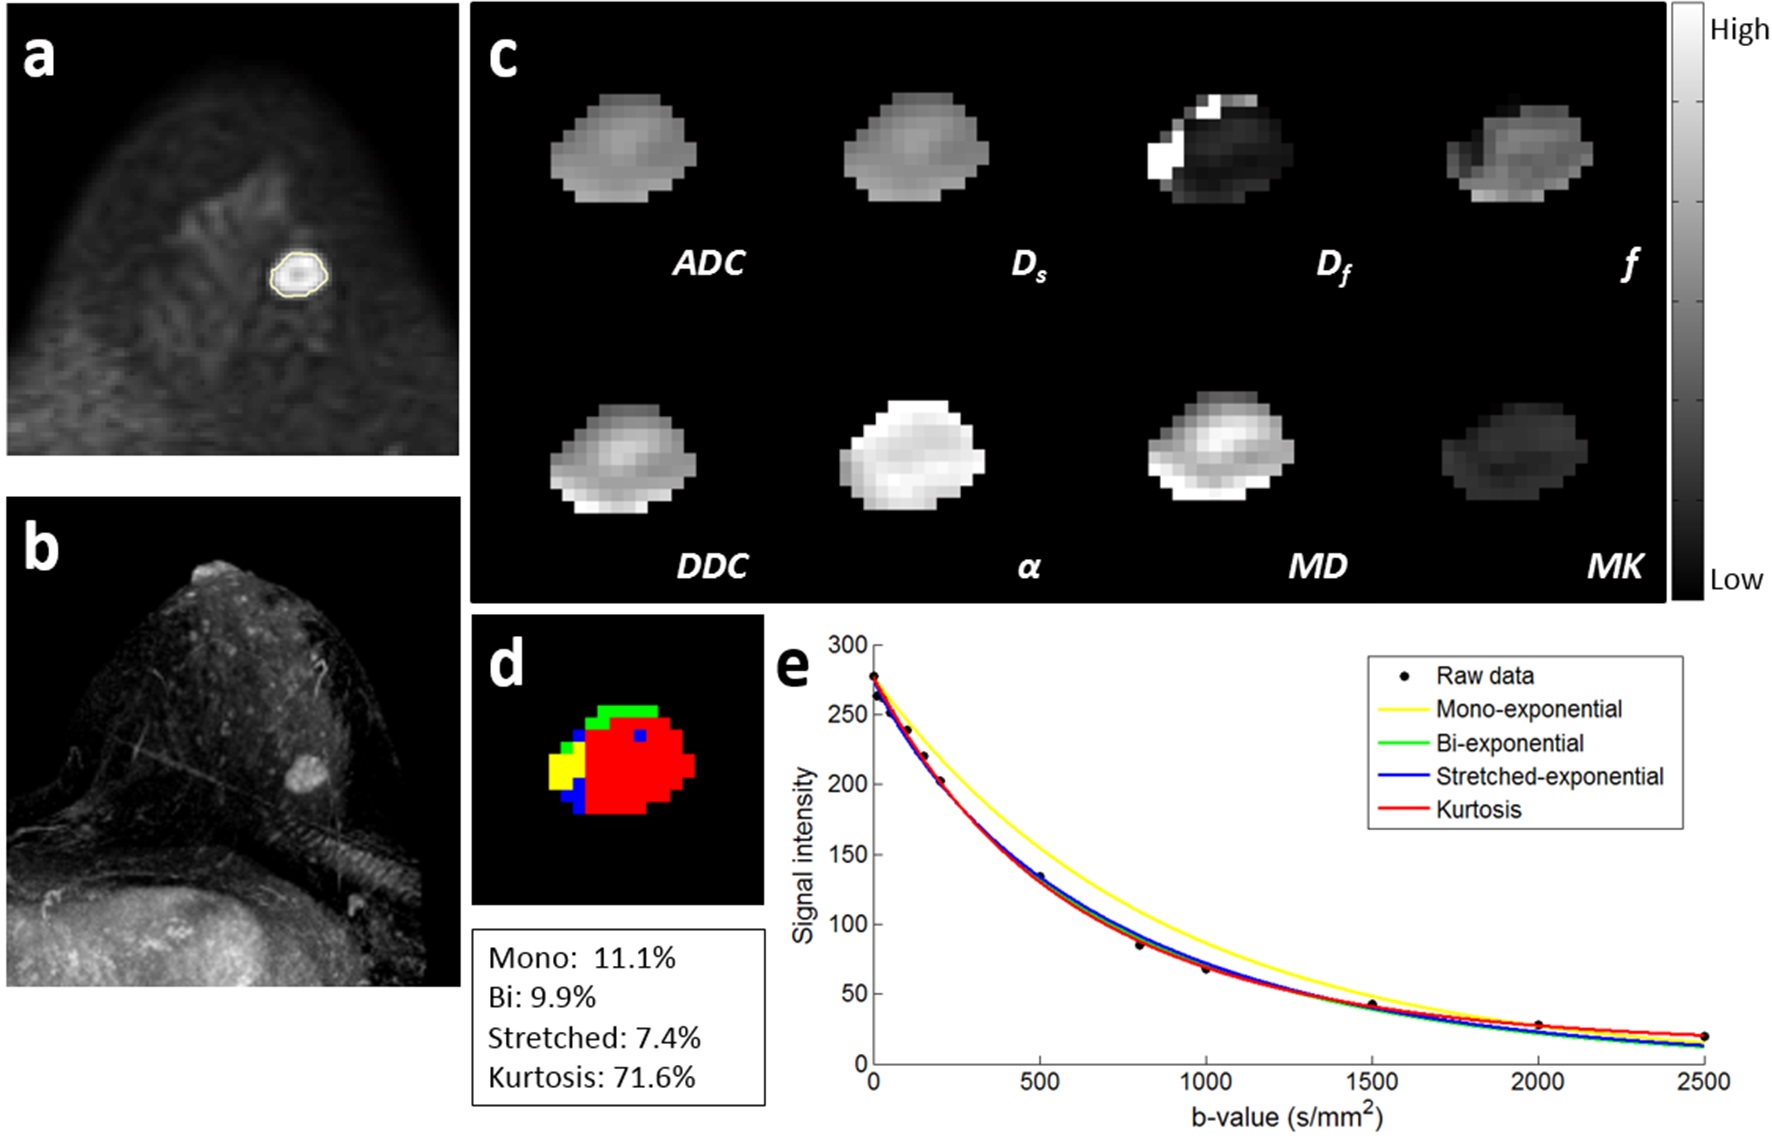
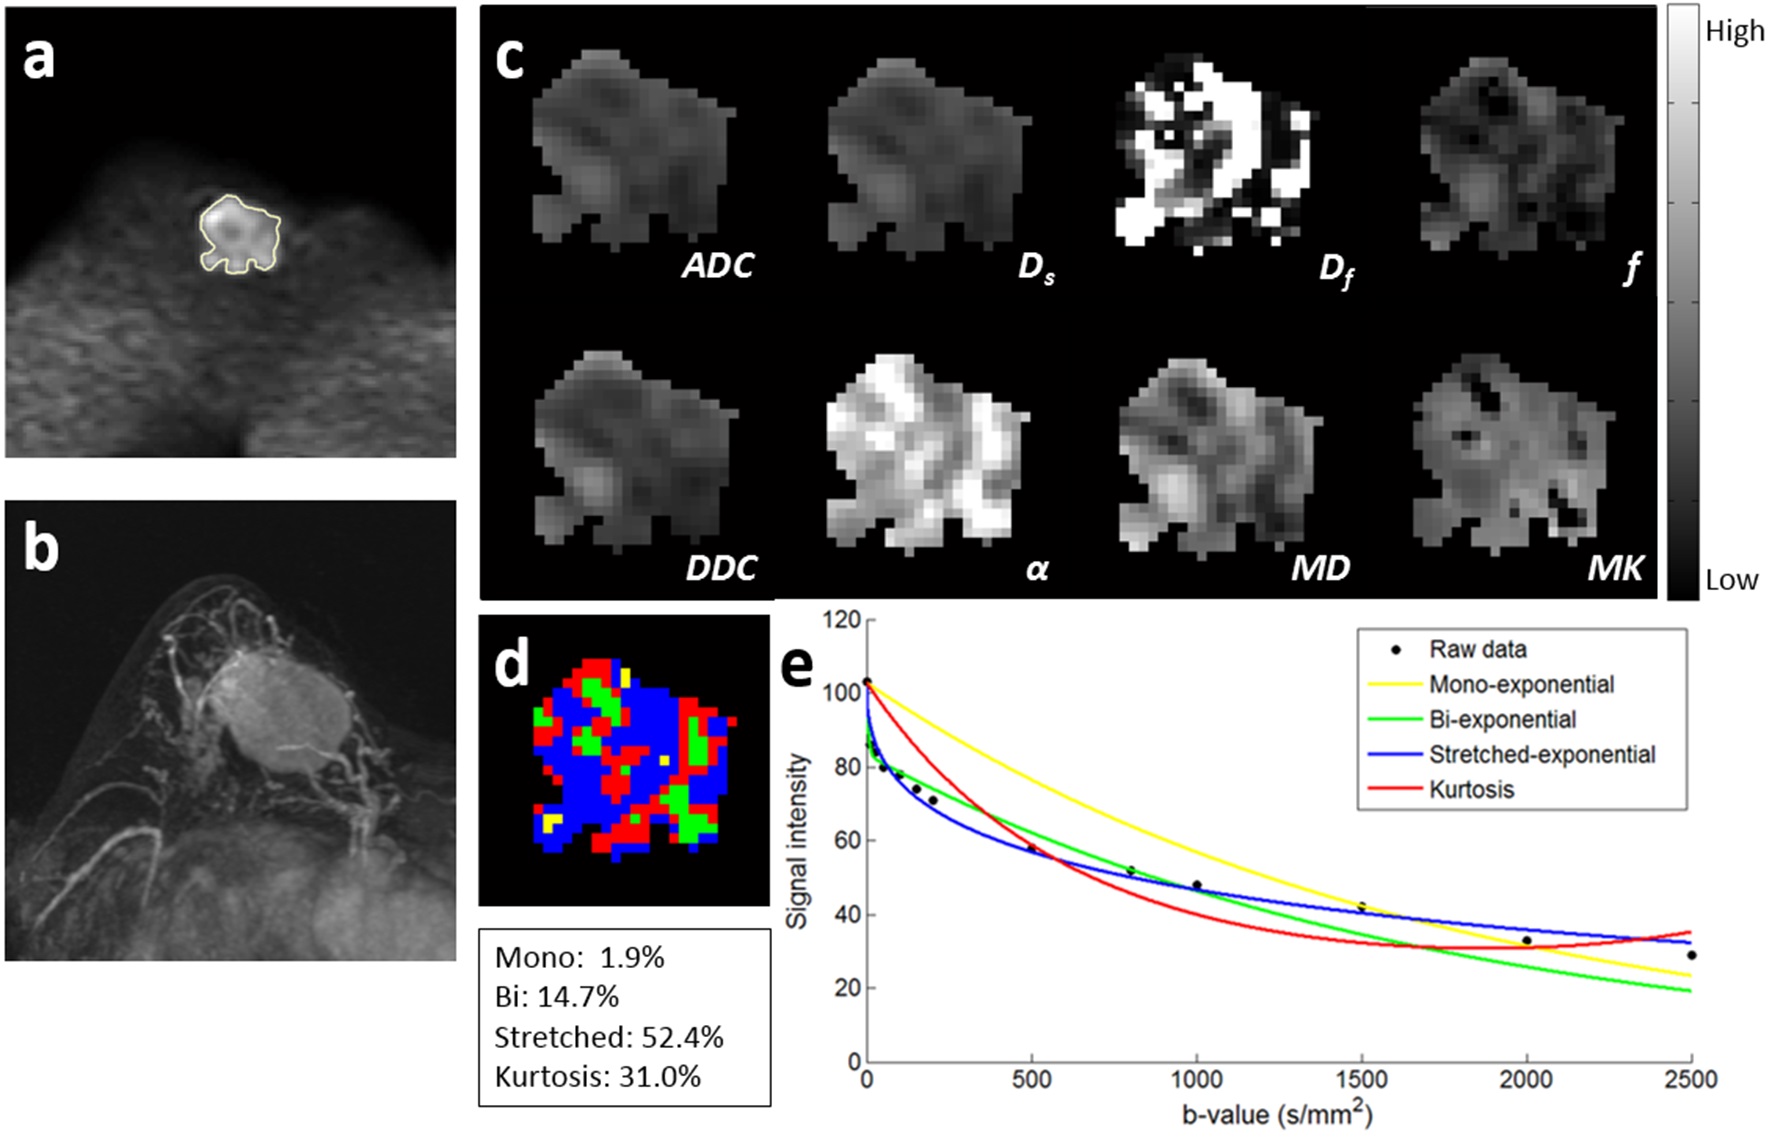
The retrospective study was approved by the local ethics committee. From March 2015 to January 2016, 101 patients (benign, 44; malignant, 57 [ductal carcinomas in situ, 8; invasive cancers, 49]) with histopathologic confirmation were finally included in the study. All pre-operation MR examinations were performed in the prone position using a 3-T MR scanner (Ingenia; Philips, Best, the Netherlands). Diffusion-weighted images with fat suppression were collected by using a SS-SE-EPI sequence as follows: TR msec/TE msec, 4500/85; matrix, 108 × 128; in-plane resolution, 2.6 × 2.6 mm; section thickness, 3 mm; 16 sections; parallel acquisition with acceleration factor, 2; b-values, 0, 10, 30, 50, 100, 150, 200, 500, 800, 1000, 1500, 2000, and 2500 sec/mm2. Diffusion parametric maps were generated with least-squares fitting of all b-value data on a pixel-by-pixel basis according to the mono-exponential (apparent diffusion coefficient [ADC]), bi-exponential (Df , Ds and f), stretched-exponential (distributed diffusion coefficient [DDC] and α) and kurtosis (mean diffusivity [MD] and mean kurtosis [MK]) models. Three-dimensional regions of interest (ROIs) on breast lesions were defined by an experienced breast radiologist. The Akaike information criterion (AIC) was used to assess and compare the goodness of fit. Within each ROI, the percentage of overall number of voxels with the lowest AIC was determined for each model, and color-coded map was generated to show the optimal model that could describe the majority of voxels. Histopathologic results were obtained from pathology reports. Mann–Whitney U tests were used to compare diffusion parameters of subject subgroups assigned in terms of tumor type (benign vs. malignant), histologic subtype (in situ vs. invasive), tumor size (<2 cm vs. ≥2 cm), lymph node metastasis (negative vs. positive), histologic grade (grades 1,2 vs. grade 3), ER/PR/HER2 expression (negative vs. positive), and Ki-67 (<14% vs. ≥14%). Receiver operating characteristic (ROC) curves were generated to evaluate the diagnostic performance. Areas under the ROC curves (AUCs) were compared between ADC and other diffusion parameters.Results
Interestingly, more than half (50.5%) of the dataset in benign lesions were predominantly described by the kurtosis model while more than half (51.2%) of the dataset in malignant lesions were predominantly described by the stretched-exponential model. ADC, Ds, f, DDC, α, and MD were significantly lower, while Df and MK were significantly higher in the malignant group than in the benign group (all P <0.001). In the invasive cancer group, ADC, Ds, f, DDC, and α were significantly lower, while Df and MK were significantly higher compared with the in situ cancer group (all P <0.05), but no significant difference was found for MD (P = 0.103). For predicting the malignancy, the AUC for ADC was 0.897. For differentiating between in situ and invasive cancers, the AUC for ADC was 0.763. Parameters derived from bi-exponential, stretched-exponential and kurtosis models failed to achieve a significant larger AUC value than ADC. α was significantly lower in tumors with a diameter of 2 cm or larger than tumors smaller than 2 cm (P = 0.007). Df was significantly larger in tumors with lymph node metastasis than tumors without lymph node metastasis (P = 0.021). In terms of molecular prognostic factors, tumors with ER negativity had significant higher parameter values than tumors with ER positivity in ADC, Ds, f, DDC, and MD (all P < 0.05). Df was significantly higher, and α was significantly lower and in tumors with ≥14% Ki-67 expression than tumors with <14% Ki-67 expression (P = 0.042 and 0.012, respectively).Discussion and Conclusion
The goodness-of-fit analysis suggested a kurtosis model for the characterization of diffusion-weighted signal attenuation in benign breast lesions, and a stretched-exponential model for that in breast cancer. The ADC calculated from the mono-exponential model still remained the preferred parameter for the differentiation of benign and malignant lesions, as well as the differentiation of in situ and invasive cancers, compared to parameters derived from non-mono-exponential models. Multi-parametric DWI may be useful in providing prognostic information about invasive cancers, thus potentially contributing to individualized treatment plans and evaluation of neoadjuvant chemotherapy response.Acknowledgements
No acknowledgement found.References
1. Sigmund E, Cho G, Kim S, et al. Intravoxel incoherent motion imaging of tumor microenvironment in locally advanced breast cancer. Magn Reson Med 2011;65:1437-1447.
2. Iima M, Yano K, Kataoka M, et al. Quantitative non-gaussian diffusion and intravoxel incoherent motion magnetic resonance imaging: differentiation of malignant and benign breast lesions. Invest Radiol 2015;50:205-211.
3. Sun K, Chen X, Chai W, et al. Breast cancer: diffusion kurtosis mr imaging—diagnostic accuracy and correlation with clinical-pathologic factors. Radiology 2015;277:46-55.
4. Panek R, Borri M, Orton M, et al. Evaluation of diffusion models in breast cancer. Med Phys, 2015, 42: 4833-4839.
Figures