0940
Effect of diffusion weighting due to spoiler gradients in MR Fingerprinting1University of Tsukuba, Tsukuba, Japan
Synopsis
MR fingerprinting based on a fast imaging with steady-state precession (MRF-FISP) is immune to banding artifacts due to the inhomogeneous field, and thus has been widely used for rapid quantification of tissue parameters. However, the MRF-FISP could still be affected by banding artifacts for high-field-strengths, insufficient shimming, and wide field-of-view scanners. In such cases, use of much stronger spoiler gradients could alleviate the banding artifacts, but it would increase the diffusion weighting of the spoiler gradients and lead to the underestimation of T2 values. In this study, we examined the effect of the diffusion weighting and showed the correction methods.
Introduction
MR fingerprinting (MRF) enables rapid quantification of T1, T2, and proton density with high scan efficiency1. Unlike the MRF with the balanced steady-state free precession (MRF-bSSFP), MRF based on a fast imaging with steady-state precession (MRF-FISP)2 is immune to banding artifacts due to the inhomogeneous field, and thus has been widely used. However, the MRF-FISP could still be affected by banding artifacts for high-field-strengths, insufficient shimming, and wide field-of-view (FOV) scanners. In such cases, use of much stronger spoiler gradients could alleviate the banding artifacts, but it would increase the diffusion weighting of the spoiler gradients and lead to the underestimation of T2 values. In this study, we experimentally examined the effect of the diffusion weighting in MRF-FISP, and showed the methods for correcting the T2 underestimation.Methods
The MRF acquisition was initiated with an adiabatic inversion pulse, which was followed by 300 successive FISP acquisition periods with varying flip angel (FA) and repetition time (TR). Echo time (TE) was held constant (5 ms). FA was varied pseudo-randomly and sinusoidally (5 to 90o) and TR was varied using a Perlin noise pattern (20 to 30 ms). The slice thickness was 2.5 mm. The FOV was 25.6 cm × 25.6 cm. The Cartesian sampling3 was used for the MRF acquisition. The whole TR was 8 s.
To examine the effect of diffusion weighting, the moment of the spoiler gradient was varied. To correct the B1 inhomogeneity, the B1 dimension was added to MRF dictionaries, and the B1 map measured with a double angle method was incorporated into the dictionary-matching process. To consider the diffusion effect, the ADC dimension was also added to the dictionaries. The MRF dictionaries with a range of T1 (20-1500 ms), T2 (10-1200 ms), B1/B1(90o) (0.6-1.2), and ADC (0-2.6×10⁻³mm2/s) were created using a home-written extended phase graph simulator. The dictionary was matched to the acquired MRF signal evolution profile using vector-based inner product comparisons.
To correct the diffusion weighting effect, we tested two strategies. First, the ADC map was measured with a standard Stejskal-Tanner DW-SE sequence and incorporated into the matching process. Second, the echo signals were also recorded in the MRF-FISP acquisition. This method is referred to as the MRF based on a double-echo steady state (MRF-DESS)4. For MRF-DESS, to increase the diffusion sensitivity, monopolar diffusion gradients with varying gradient moments (16, 32, 48, 64, and 80π/2.5 mm) were inserted between the FID and echo.
The above methods were tested for nine test tubes filled with water with CuSO4 to alter T1 and T2 and with glycerol to alter the diffusion constant. All measurements were performed on a vertical wide bore 4.74 T system (Oxford Instruments, bore diameter = 88.3 mm) with shielded gradients (MRTechnology, Japan).
Results and discussion
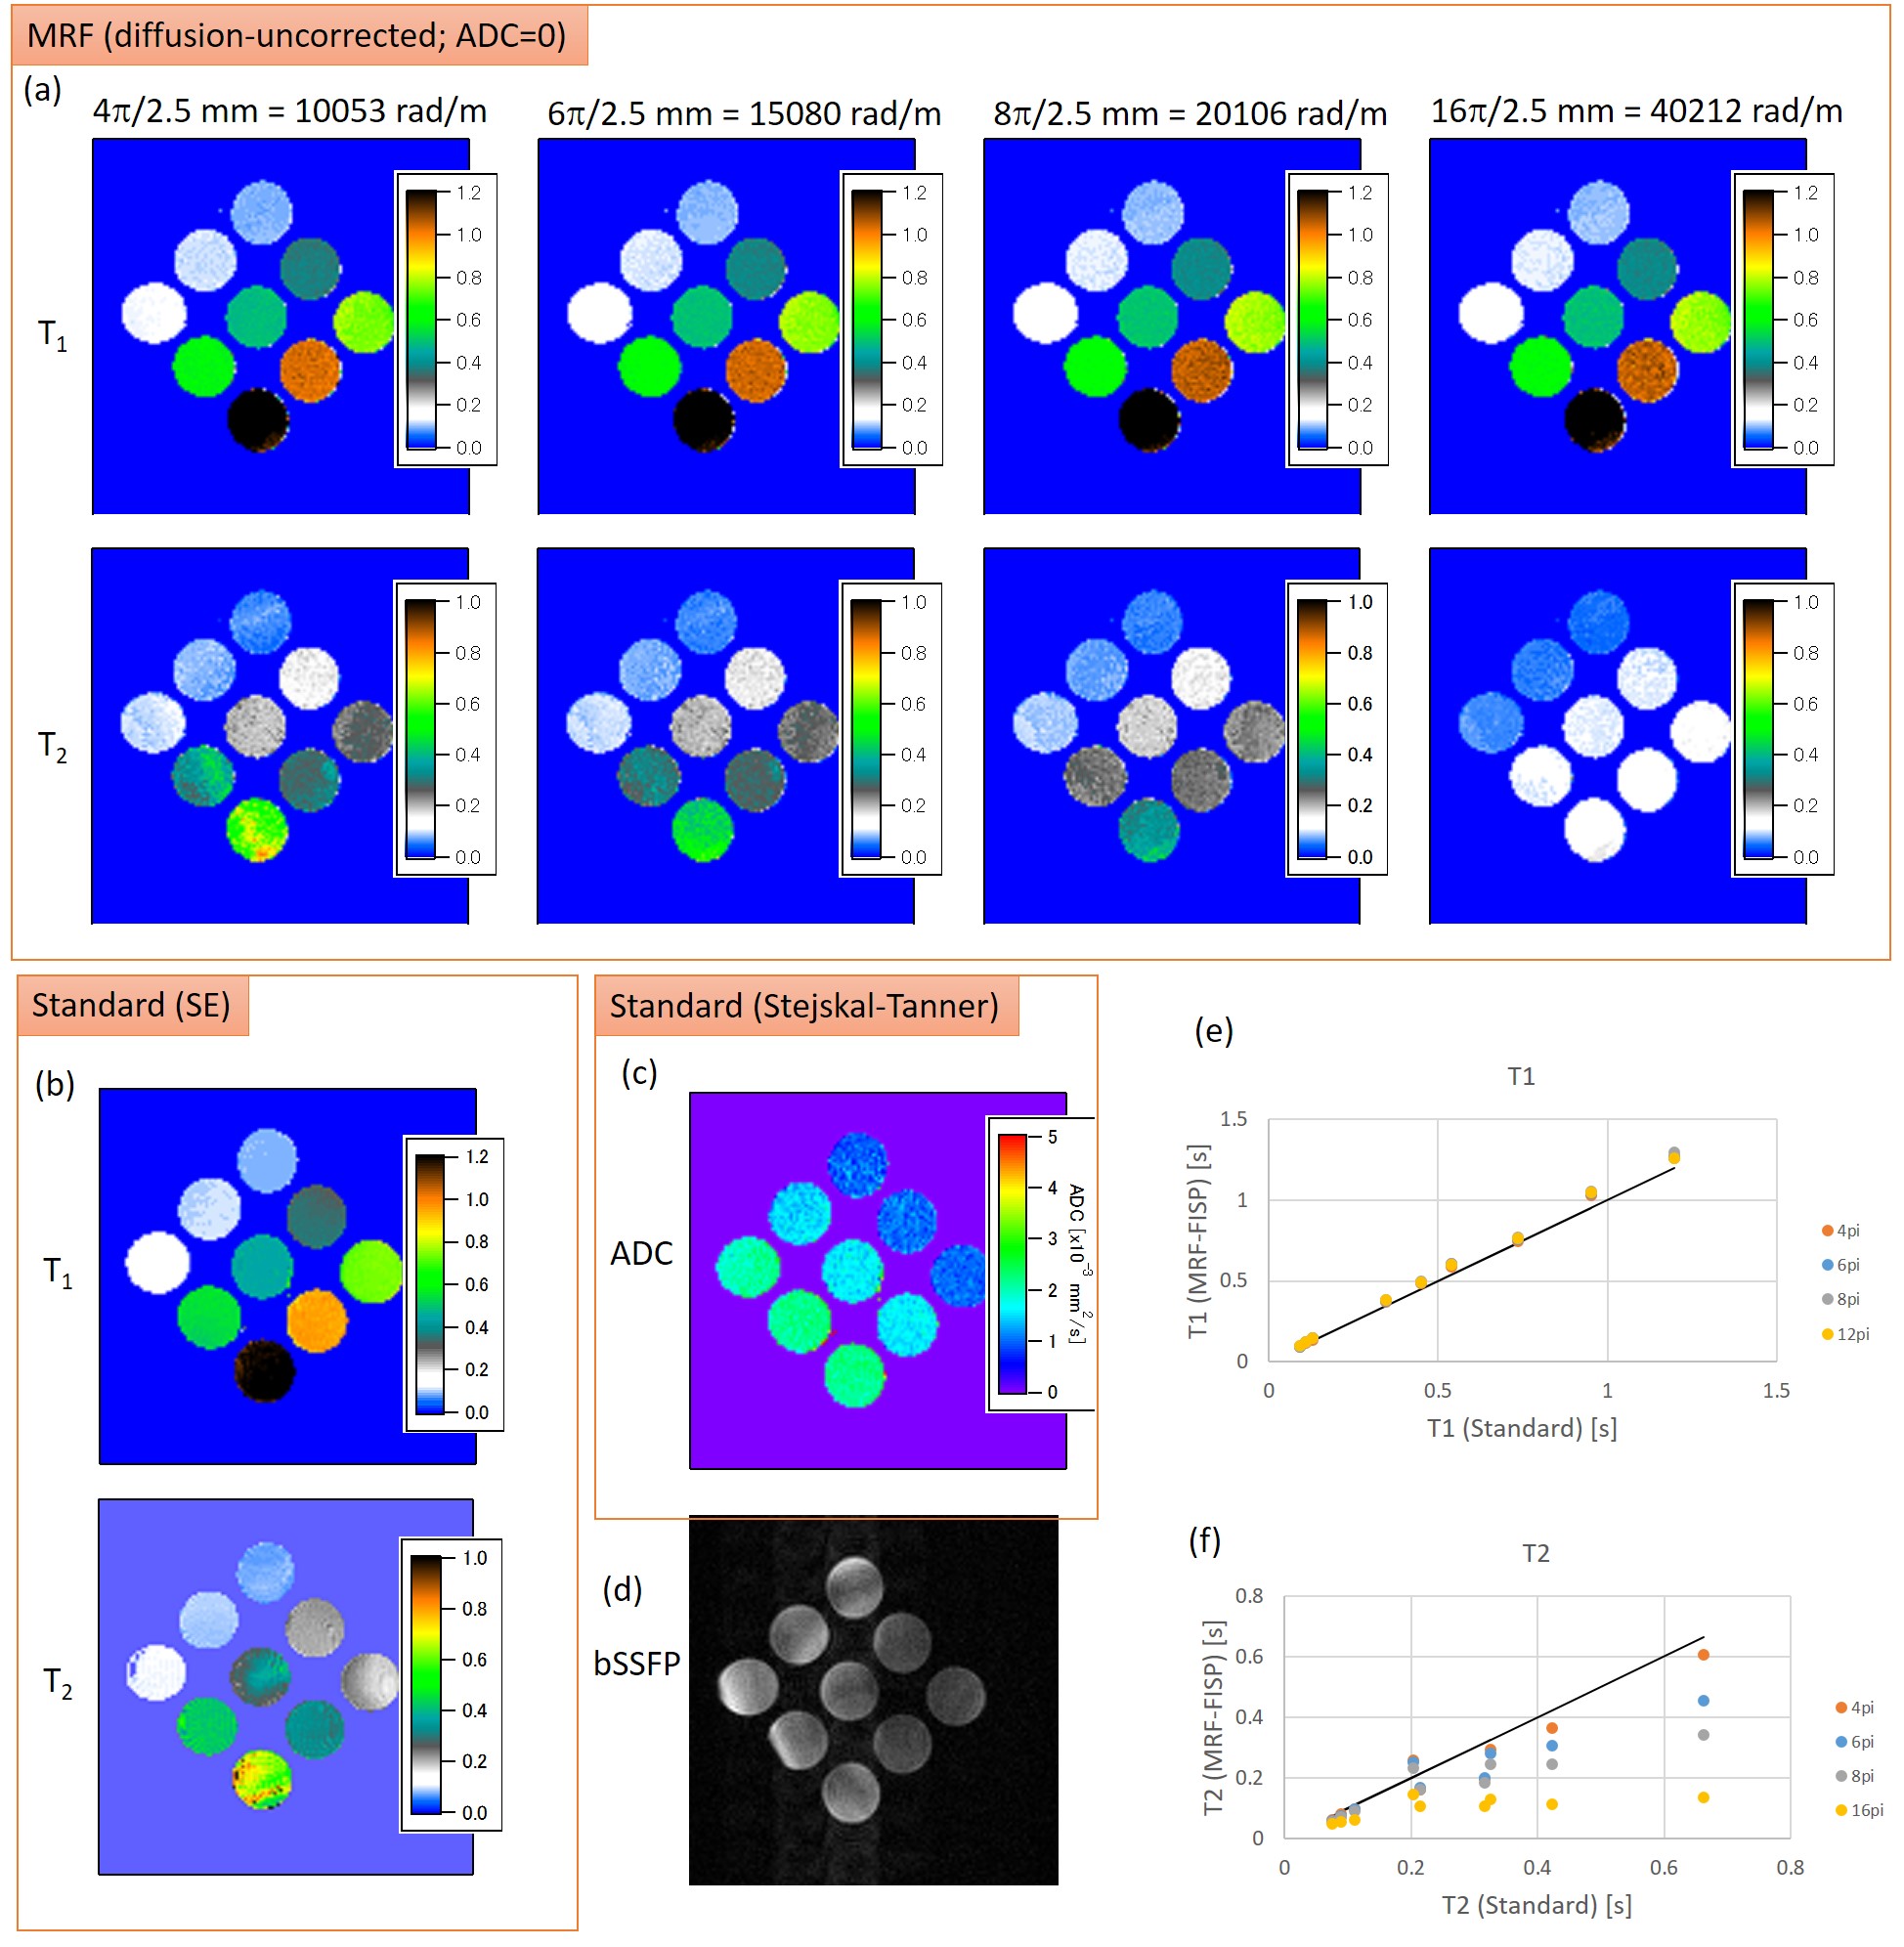
Figure 1(a) shows T1 and T2 maps of MRF-FISP without considering the diffusion. The MRF-T1 estimates were independent of the spoiler gradient moment. For the smallest moment (4π/2.5 mm), the banding artifacts appeared in the T2 map, as in the bSSFP image (Fig. 1(d)). The banding artifacts gradually disappeared as the moment increased, but the MRF-T2 values decreased and deviated (Fig. 1(f)) from their standards (Fig. 1(b)).
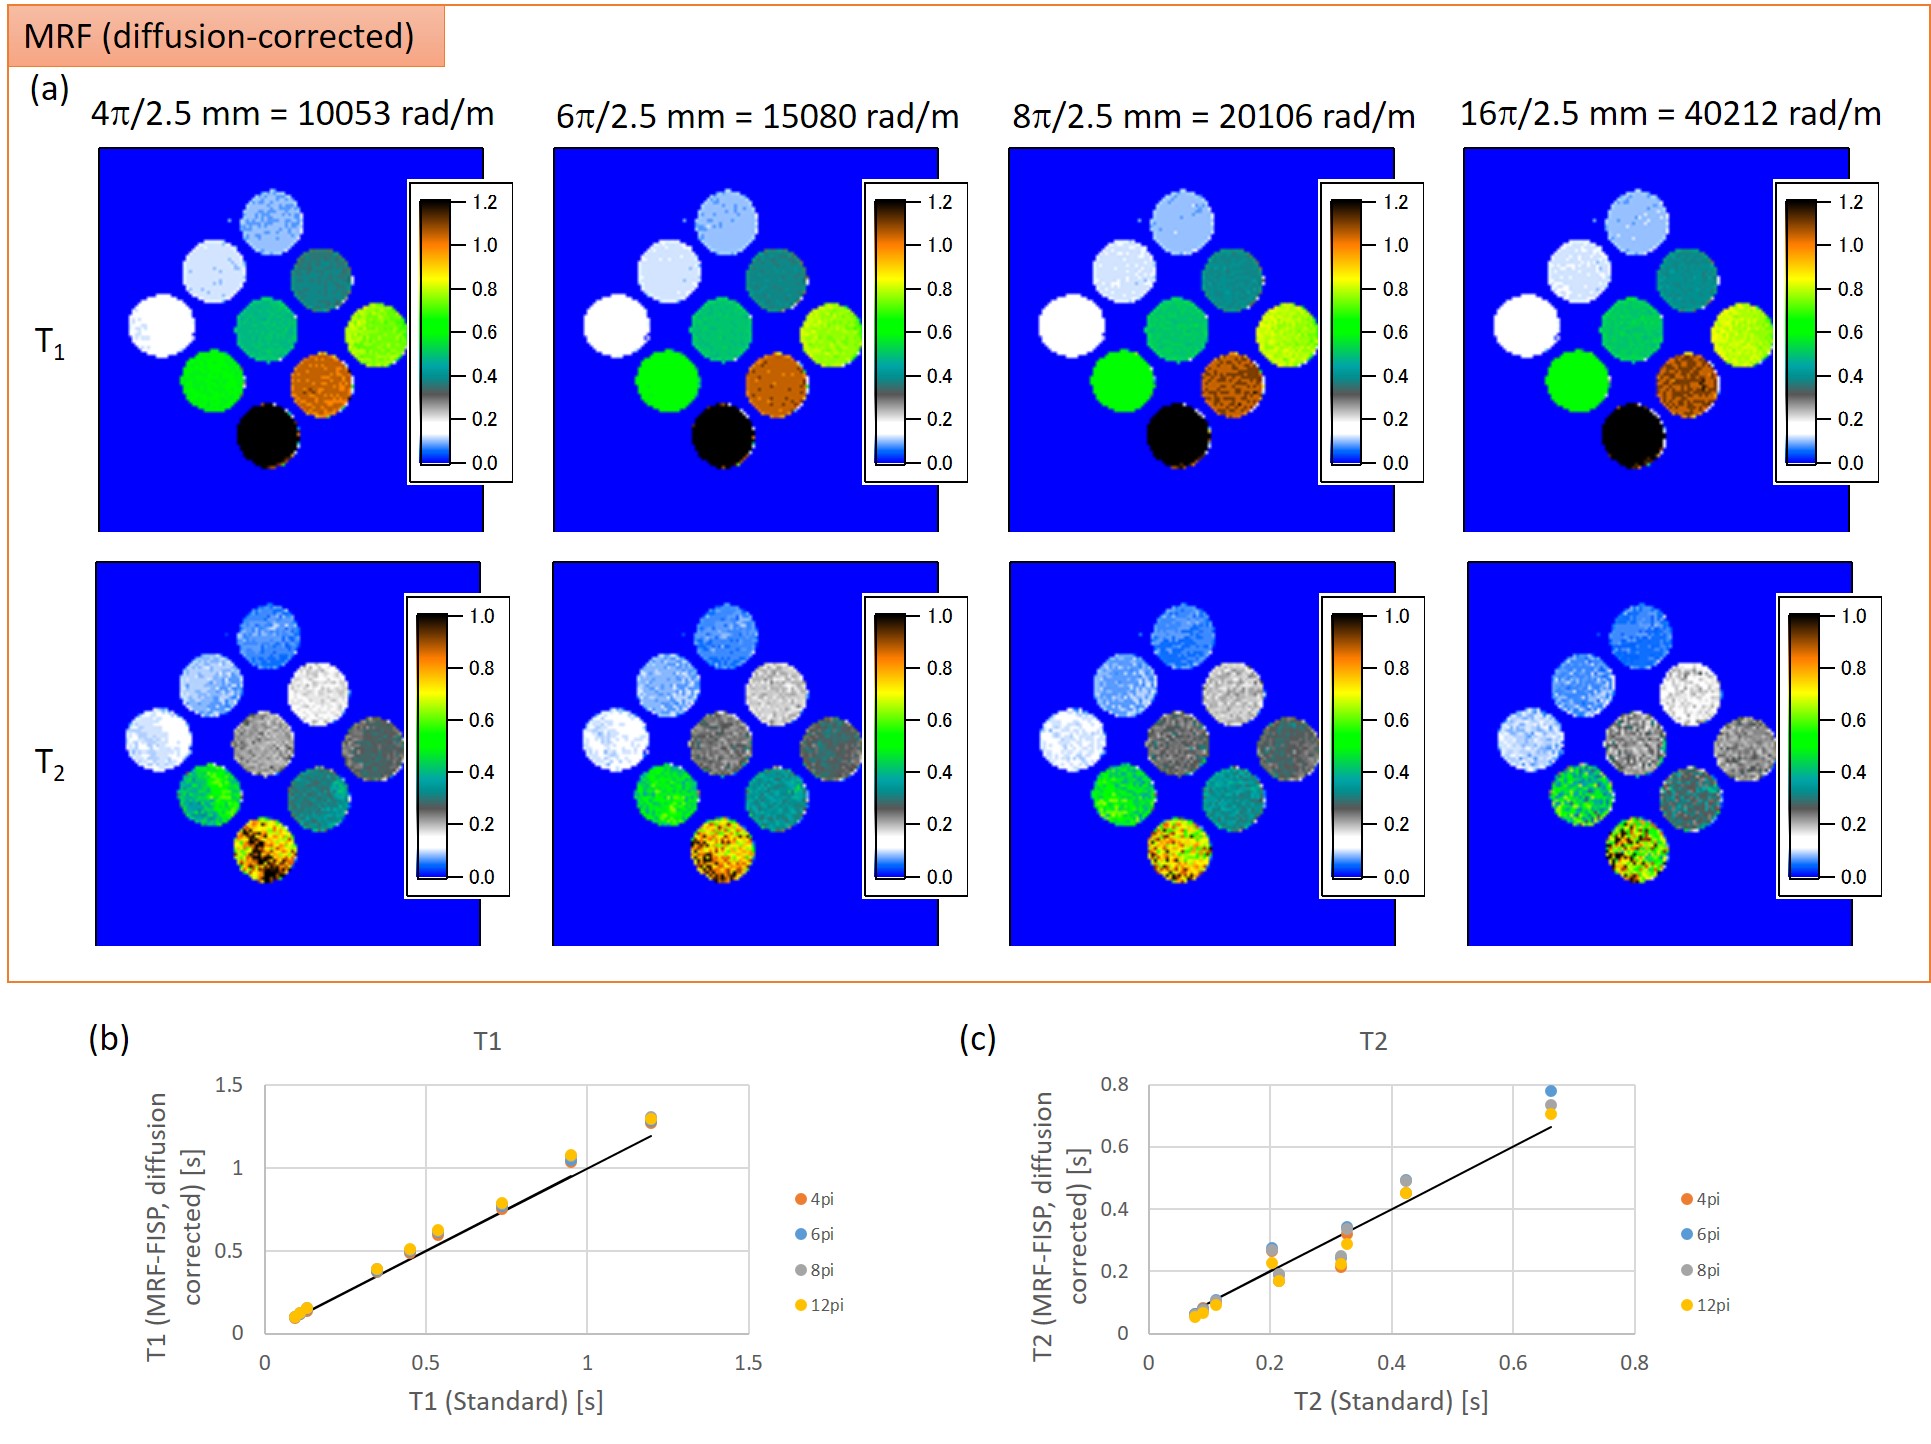
This T2 underestimation was corrected by incorporating the ADC map into the dictionary-matching process (Fig. 2(a)). The banding artifacts still appeared for the smaller moments, but they disappeared for the larger moments. The MRF-T1 and T2 estimates were almost the same as those measured with the standard method (Figs. 2(b) and 2(c)).
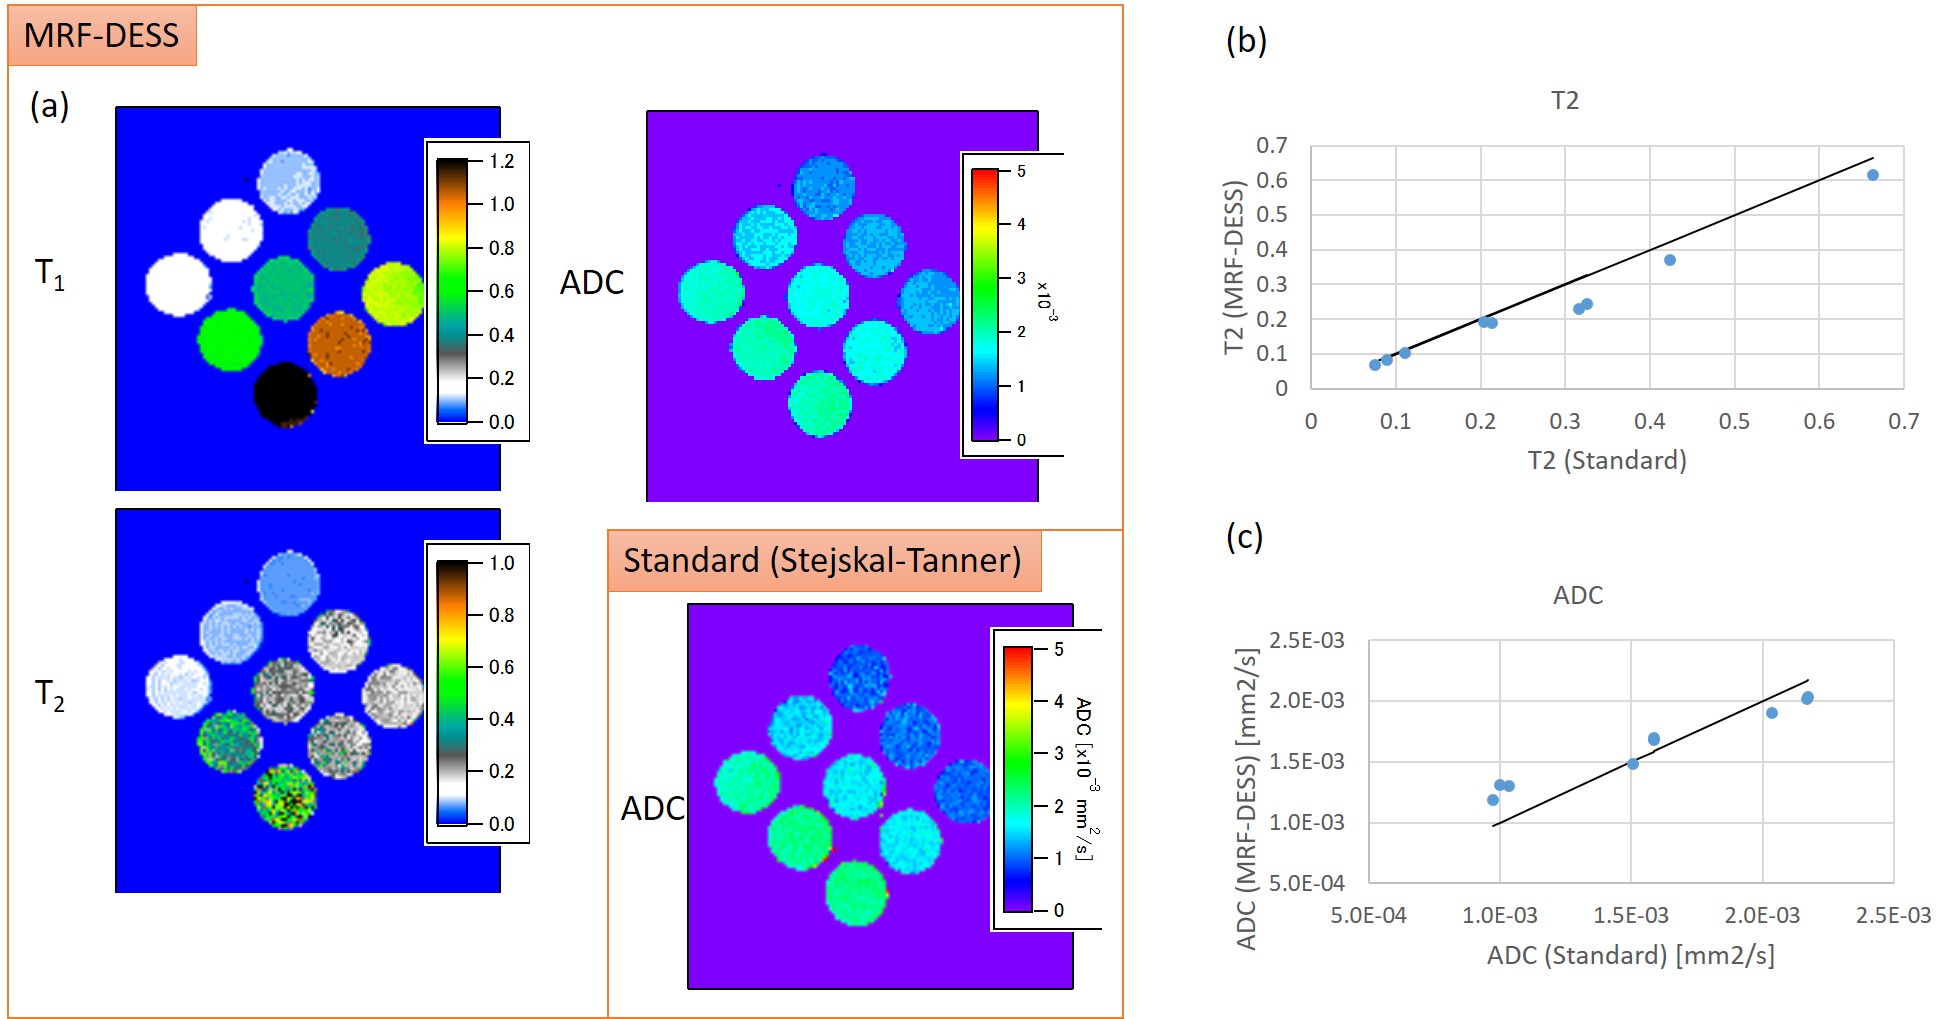
As such, the diffusion-weighting effect in MRF-FISP can be alleviated largely, but the correction requires the additional ADC experiment. This is not the case for MRF-DESS, which is the second strategy for avoiding the diffusion weighting. The T1, T2, and ADC maps generated from the MRF-DESS (Fig. 3) were in agreement with their standards. The MRF-DESS allows the simultaneous quantitative mapping of the ADC as well as T1, T2, and proton density, and thus is more efficient.
Overall, the both correction methods compensated for the T2 underestimation largely, but there were slight deviations in the T2 values from the standards. This would be caused by the insufficient sensitivities of the current sequences to T2 and ADC. This limitation could be overcome by the suitable optimization of the sequences.
Conclusion
We examined the diffusion weighting effect due to the spoiler gradient in the MRF-FISP, which is not negligible for systems with the large field inhomogeneity. We showed that the T2 underestimation due to the diffusion weighting could be alleviated largely by performing the additional ADC experiment or by using the MRF-DESS sequence.Acknowledgements
No acknowledgement found.References
1. Ma D, et al. Magnetic resonance fingerprinting, Nature 2013;495:187-193.
2. Jiang Y, et al. MR Fingerprinting Using Fast Imaging with Steady State Precession (FISP) with Spiral Readout, Magn. Reson. Med. 2015;74(6):1621-31.
3. Gao Y, et al. Preclinical MR fingerprinting (MRF) at 7 T: effective quantitative imaging for rodent disease models, NMR Biomed. 2015;28:384-394.
4. Jiang Y, et al. Simultaneous T1, T2, Diffusion and Proton Density Quantification with MR Fingerprinting, Proc. Intl. Soc. Mag. Reson. Med. 2014;22:0028.
Figures