0939
Multiparametric T2* MR Fingerprinting1Radiology, Oregon Health and Science University, Portland, OR, United States, 2Advanced Imaging Research Center, Oregon Health and Science University, Portland, OR, United States, 3Casey Eye Institute, Oregon Health and Science University, Portland, OR, United States
Synopsis
Previous magnetic resonance fingerprinting studies have focused on T1 and T2 relaxation times, relying solely on flip angle and repetition time changes, leaving the TE as short as possible for optimal SNR and phase. In this study, T1 and T2 MR fingerprinting is extended to include T2* relaxation by varying echo times across acquisitions. The resulting T1, T2, T2*, and B0 maps are then compared to maps obtained with conventional sequences, showing good spatial and quantitative agreement. A novel phase dictionary is used to before the full T1/T2/T2* dictionary to produce B0 maps with fine resolution and reduce computational time.
Purpose
Magnetic resonance fingerprinting, a pattern matching based approach, allows for quantitative mapping of multiple parameters in a much shorter time than conventional imaging methods. Previous studies have focused on T1 and T2 relaxation time constants[1,2], relying solely on flip angle and repetition time changes. To extend this methodology to include T2* relaxation, changes in TE (along with TR) are needed across acquisitions, along with knowledge of the underlying B0 field. In this study, T1, T2, and T2* relaxation are quantified by varying echo times, flip angle, and TR, as well as employing a separate phase dictionary to extract B0 prior to conventional pattern matching.Methods
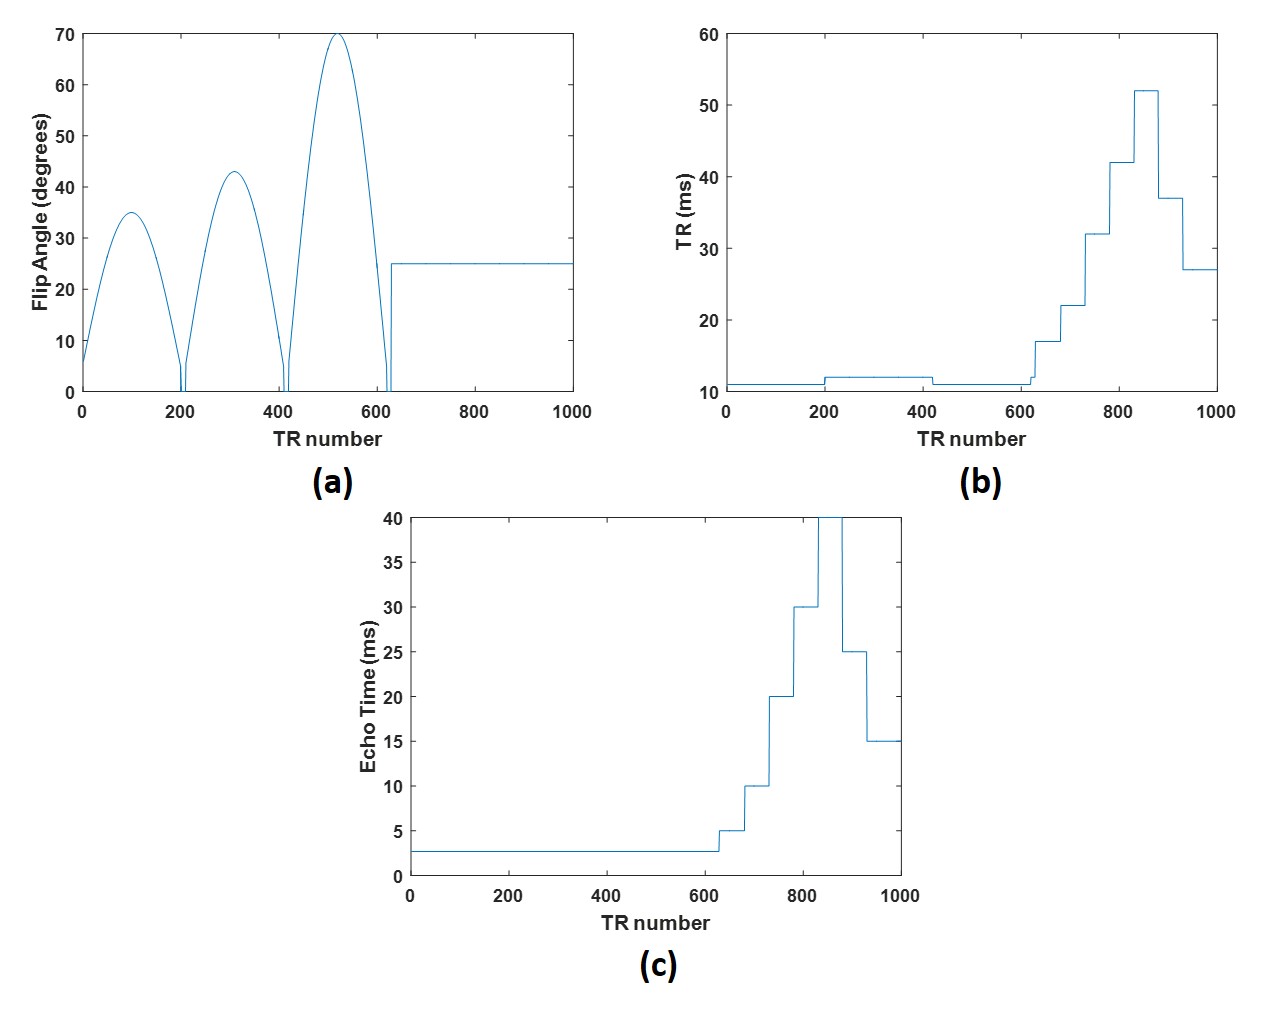
To test the proposed sequence in vivo, one healthy volunteer (male, 24) was recruited under an IRB approved protocol. A single axial slice through the center of the ventricles was scanned with conventional T1, T2, and T2* mapping sequences as well as our modified MR fingerprinting sequence on a 3T Siemens PRISMA MR scanner using body coil transmit and 20-channel head coil receive. The fingerprinting sequence consists of an undersampled variable density spiral with FISP contrast, which is approximately 24x undersampled at the center of k-space and 48x undersampled at the edges. The undersampled spiral arm was acquired for 1000 TR periods, with the flip angle, TR, and TE values shown in Figure 1. Additional parameters include FOV=30cm, data matrix=256x256, Acquisition Time = 19s. Images were reconstructed using a 2D Nonuniform Fourier Transform and coils were combined using adaptive combination[3].
Dictionary values were generated using an extended phase graph (EPG) simulation with T1 values from 0-3600ms in 100ms increments, T2 from 0-300 in 5ms increments, and T2* from 0-160ms in 4ms increments. Before dictionary fitting, a dictionary of phase terms was generated using exp(2πΔB0TE), with ΔB0 from -200 to 200 Hz in 0.1Hz increments and TE as the echo time train in Figure 1. A B0 map was generated by finding the maximum dot product between all elements of the phase dictionary and each pixel of the image. The ΔB0 map was then used to correct the phase of each pixel in the image by multiplying each pixel by exp(-2πΔB0TE). The T1/T2/T2* images were then determined by finding the maximum dot product between the corrected signal in each pixel to the entire T1/T2/T2* dictionary.
Conventional T1 images were acquired with a multiple flip angle 3D GRE with FOV=30cm, 128x128, slice thickness=2mm, TR/TE=20ms/1.34ms, FAs=[5.0,9.0,14.0,18.0,23.0,27.0]. Conventional T2 images were acquired with a multi-echo spin-echo sequence with FOV=20cm, 128x128, TR=1500ms, slice thickness=5mm, TEs=[16.6-132.8ms in 8.3ms increments]. Lastly, conventional T2* images were acquired with a multi-echo gradient-echo sequence with TEs=[2.5,5.43,8.0,15.0,25.0,30.0,40.0,50.0ms], TR=700ms, with other parameters similar to the T2 map. Conventional T1 maps were fit using the Siemens software, while conventional T2 and T2* using monoexponential two-parameter fits in Matlab.
Results
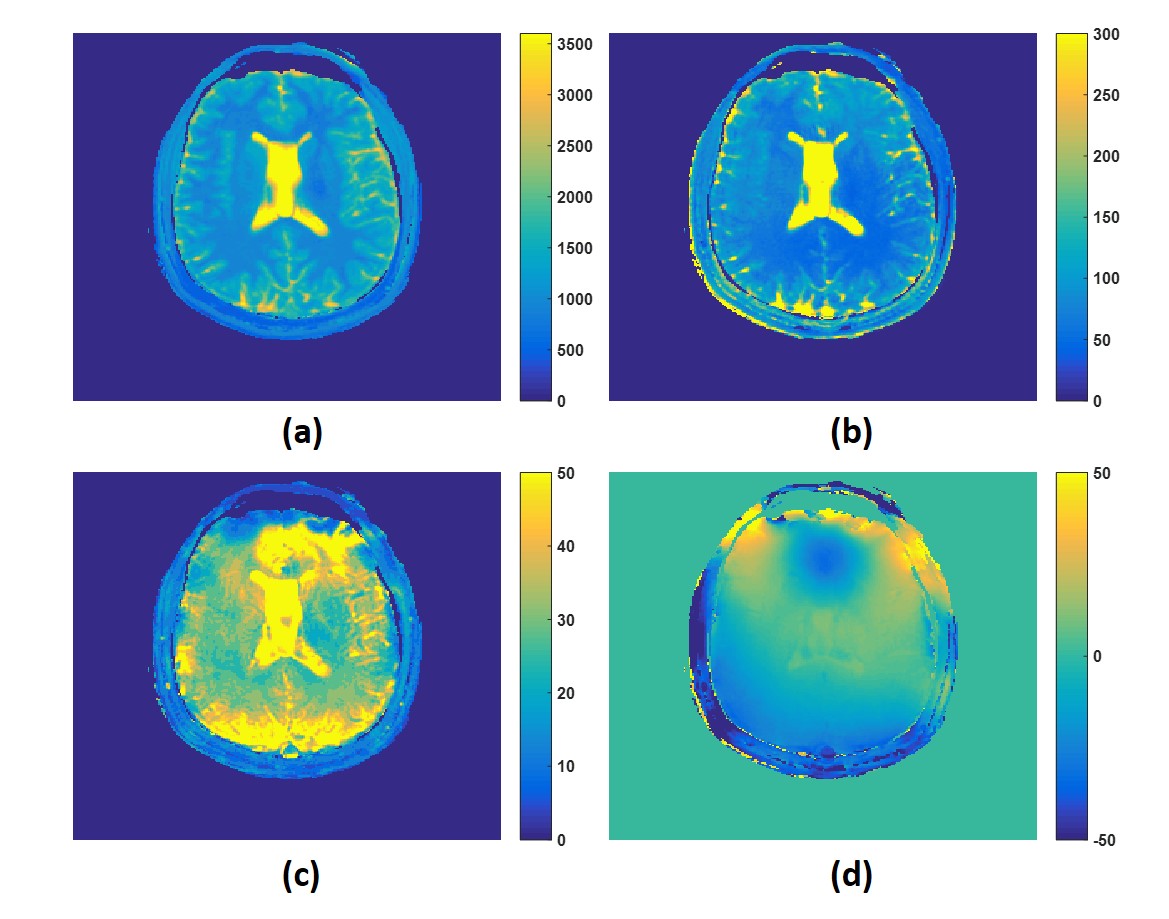
T1, T2, T2* and B0 quantitative maps obtained from conventional techniques are shown in Figure 2. Quantitative maps obtained with the proposed fingerprinting technique are shown in Figure 3.Discussion
The results in Figures 2 and 3 demonstrate good spatial and quantitative agreement between conventional T1, T2, T2*, and B0 maps, and those obtained with the proposed fingerprinting method. The novel two dictionary fitting method used in this study, in which B0 is fit first and used to correct the images before the T1/T2/T2* fitting, results in accurate results while allowing for B0 to be fit to a very fine resolution. Without this approach, a four-dimensional dictionary would be needed, creating restraints on the resolution of the dictionary and making processing time (both dictionary creation and fitting) much longer.
We have chosen a piecewise constant pattern for the TE train. This has proven to be a more robust approach than allowing TE to change with every TR period. As TE increases, off-resonance gradients (ie, the first derivative of the B0 field) cause the spiral k-space sample locations to shift, resulting in a concentration of aliased energy along certain directions in the image. The aliased energy can combine constructively/deconstructively and also become highly correlated, creating errors in the pattern-matching process. Employing a piecewise constant TE train helps reduce the interference from the concentrated aliased energy.
Conclusion
The technique proposed provides the ability to acquire T1, T2, and T2* maps quickly in one acquisition. This is especially important in the application of contrast agents containing iron nanoparticles, such as ferumoxytol, in which all three of these parameters change after injection[4]. Future work will focus in part on optimizing the TE train pattern to promote time efficiency and minimize interference from undersampling.Acknowledgements
This research was supported by an OHSU Knight Cancer Institute Pilot Grant.References
[1] Ma, et al. Magnetic Resonance Fingerprinting. Nature. March 2013. 495. 187-192
[2] Jiang, et al. MR fingerprinting using fast imaging with steady state precession (FISP) with spiral readout. MRM. December 2015.74(6).
[3] Walsh, DO. Adaptive reconstruction of phased array MR imagery. MRM. 2000 May;43(5):682-90.
[4] Bashir, et al. Emerging applications for ferumoxytol as a contrast agent in MRI. JMRI. April 2015. 41(4)
Figures