0938
Off-Resonance Correction for MR Fingerprinting Using Multiple Frequency Interpolation1Vanderbilt University Institute of Imaging Science, Vanderbilt University, Nashville, TN, United States, 2Program in Chemical and Physical Biology, Vanderbilt University, Nashville, TN, United States, 3Neuroimaging Research, Barrow Neurological Institute, Phoenix, AZ, United States, 4Department of Radiology and Radiological Sciences, Vanderbilt University, 5Department of Biomedical Engineering, Vanderbilt University
Synopsis
While T1 and T2 parameter mapping using fast imaging with steady-state precession (FISP) magnetic resonance fingerprinting (MRF) has shown consistency with classic relaxometry techniques under static field (B0) inhomogeneity, the use of spiral k-space trajectories blurs parameter map boundaries in regions of high B0 variability. This work shows deblurring in phantom and in vivo relaxation maps generated using a published MRF sequence in conjunction with multi-frequency interpolation (MFI) acquired using undersampled and fully sampled spirals on a 3 Tesla human MR scanner.
Purpose
This study demonstrates improvement in magnetic resonance fingerprinting (MRF) imaging and T1/T2 parameter map quality in regions of static field (B0) inhomogeneity using multi-frequency interpolation (MFI) for off-resonance correction. MRF using unbalanced steady-state free precession (SSFP) allows efficient quantification of T1 and T2 with resilience to spatial undersampling and effects like B0 perturbations1. However, B0 associated frequency offsets cause signal blurring that degrades the detail and boundaries of MRF parameter maps and reconstructed images when acquired with spiral k-space trajectories. This can be corrected using MFI2, ameliorating off-resonance degradation of T1 and T2 parameter maps in phantoms and in vivo human brain.Methods
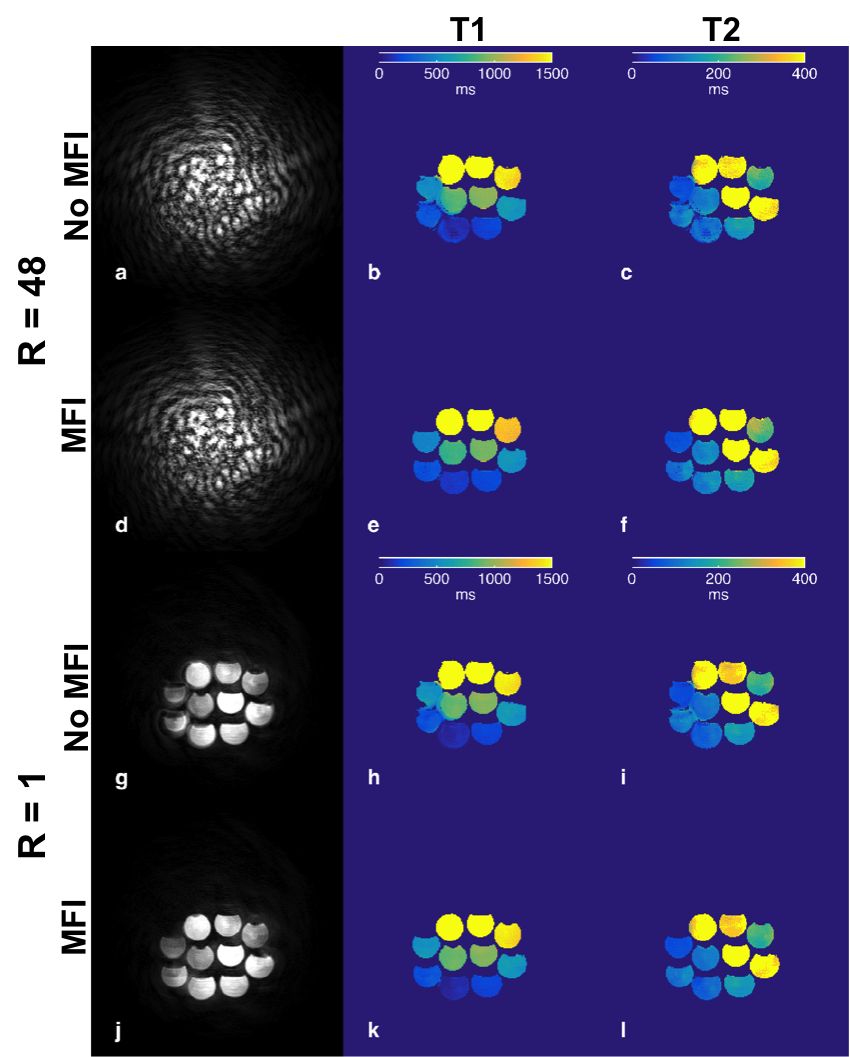
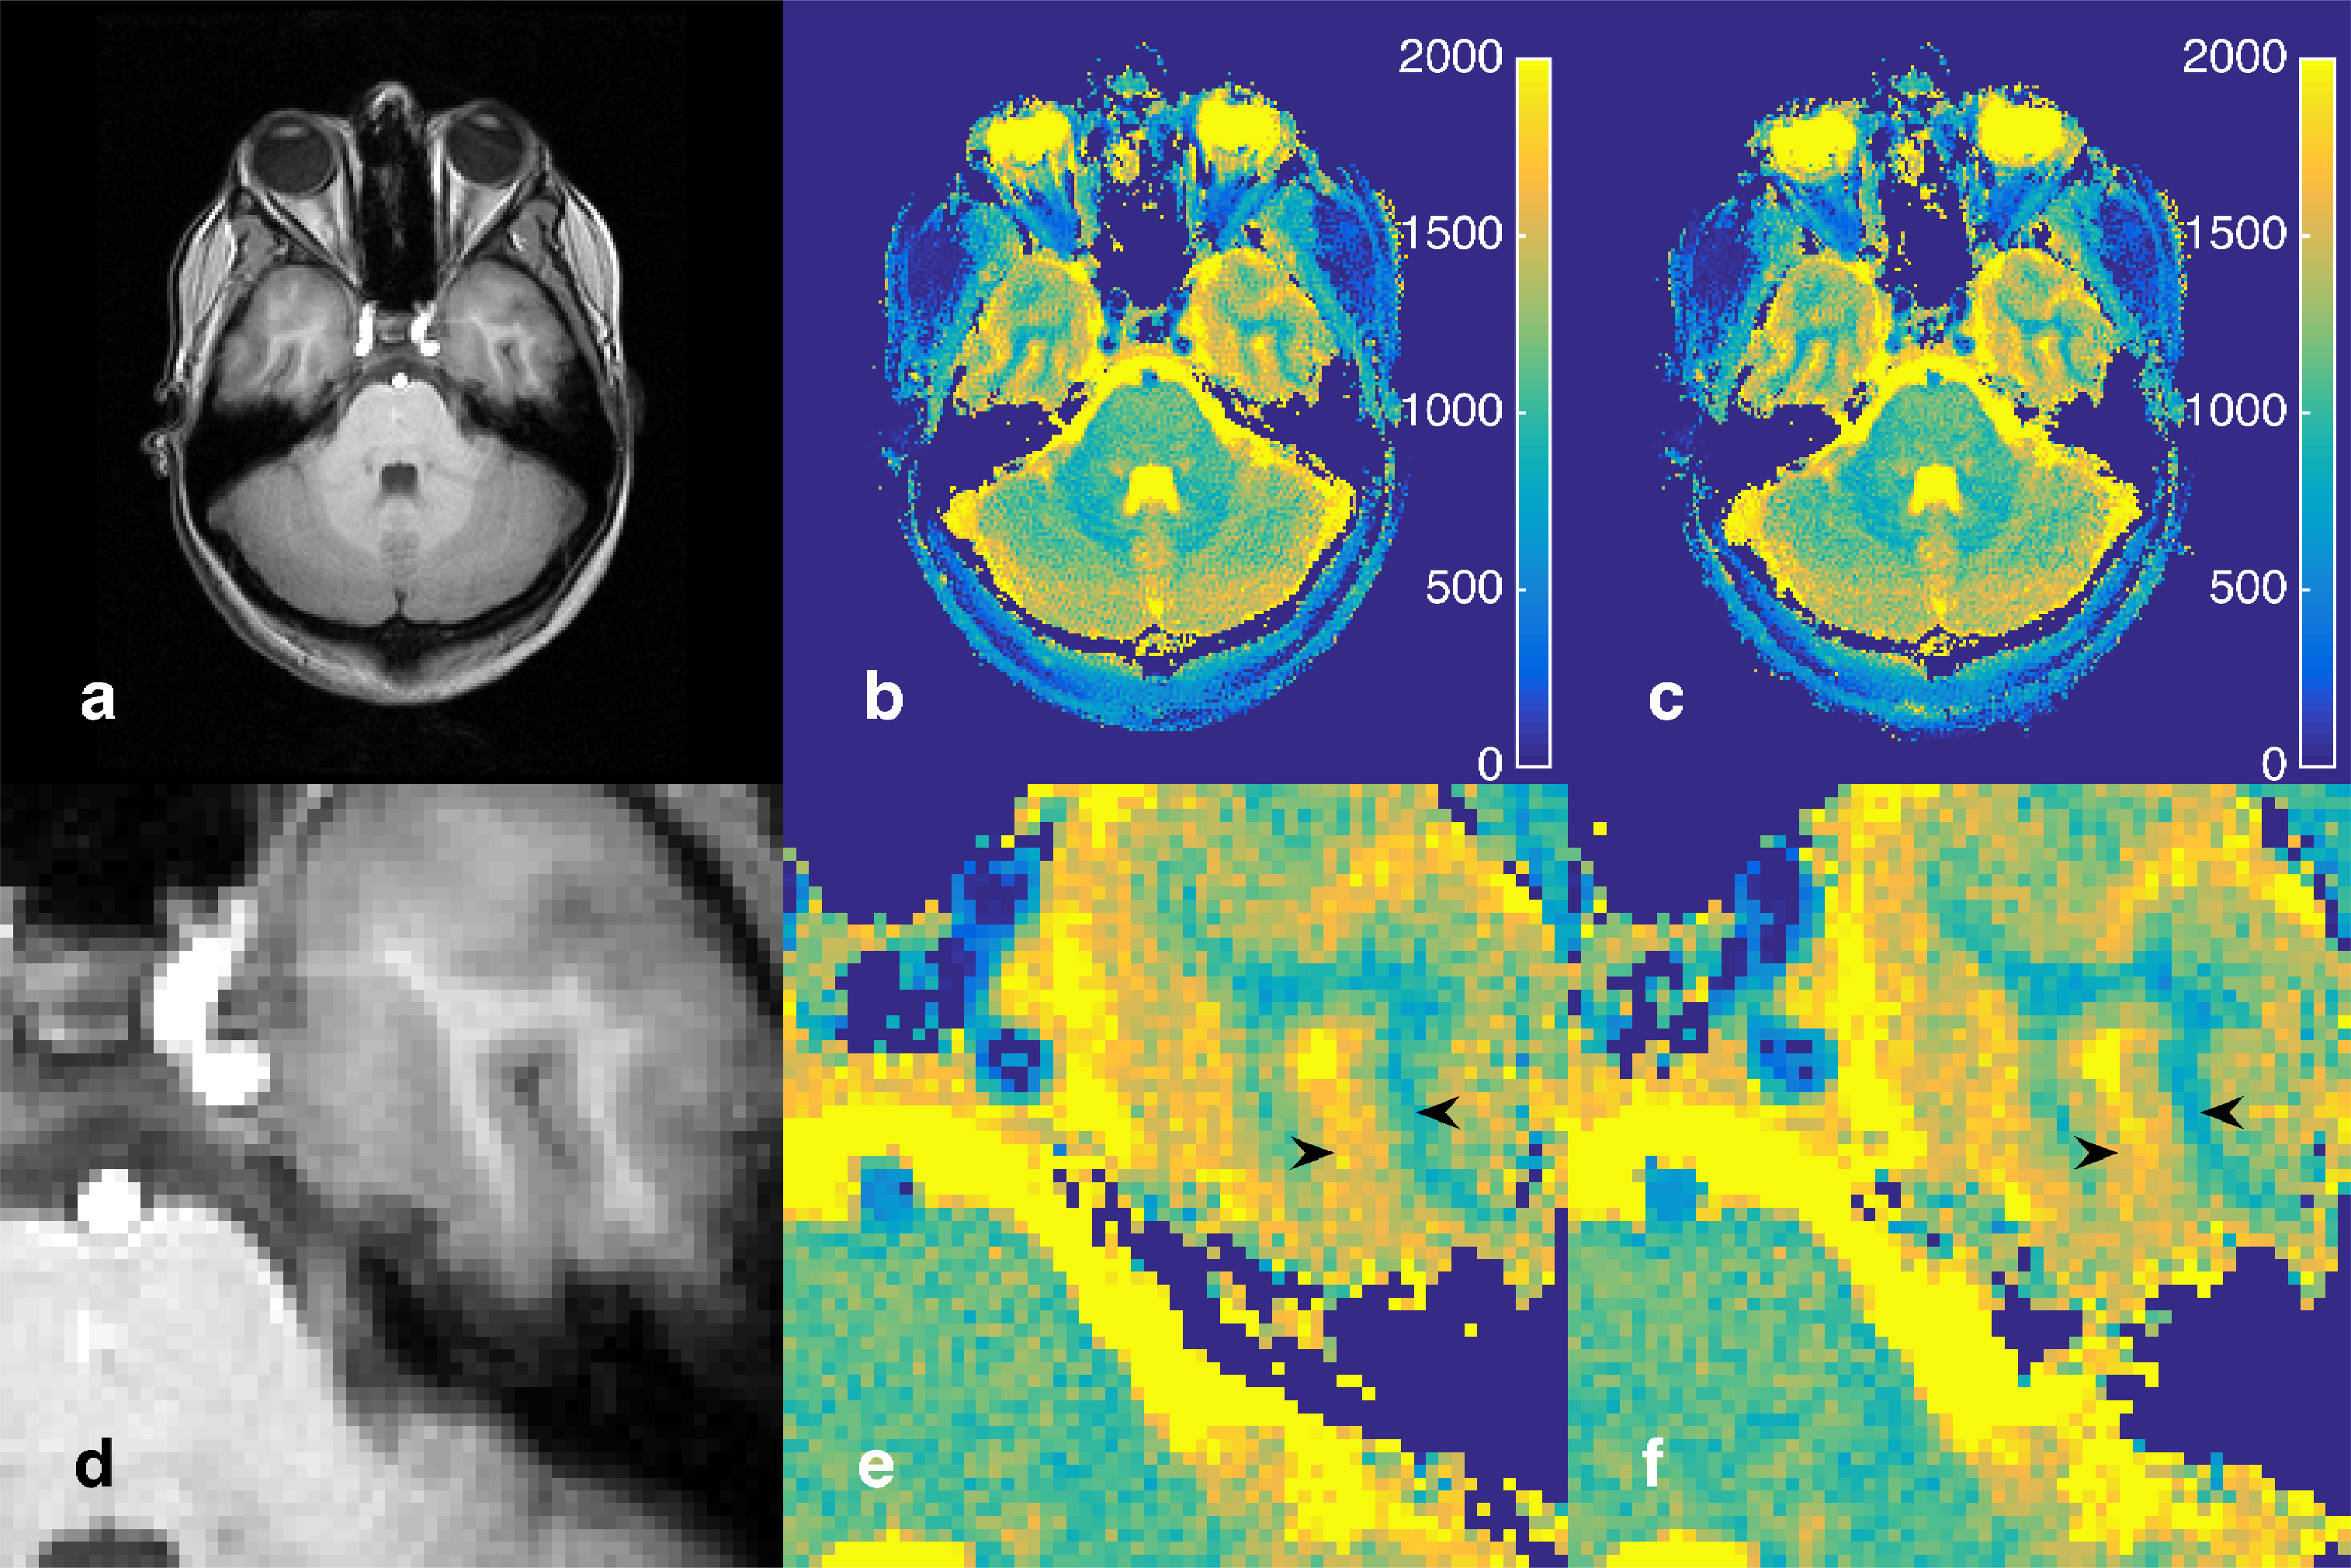
Ten water-filled 50 mL conical centrifuge tubes doped with manganese chloride or gadolinium were imaged under controlled shimming to generate B0 inhomogeneity across the phantom spanning approximately 500 Hz. A single subject was scanned after informed consent with institutional review board approval. MRF data were acquired using a previously published fast imaging with steady-state precession (FISP) sequence1 on a Philips Achieva 3 Tesla scanner (Philips Healthcare, The Netherlands) with a single-channel transmit/receive head-coil. Imaging encoding gradients used a 0th moment compensated variable density spiral3 designed for a FOV of 256 x 256 mm2 (240 x 240 mm2 in vivo) and in-plane voxel and slice thickness of 1 mm2 and 5 mm, respectively, having an echo time and minimum TR of 2.0 and 12.4 ms (2.5 and 15 ms in vivo), rotated at golden angles between acquisitions. An unbalanced gradient was used in the through-plane direction to achieve the same dephasing every TR. One spatially undersampled spiral was acquired each MRF acquisition, with an acquisition time of 5.9 ms (6.8 ms in vivo) for each spiral, with 48 spirals required to fully sample k-space (R = 48). B0 maps were generated using a standard Cartesian gradient echo scan with two echo times spaced 1 ms apart and reconstructed from the raw data to yield a B0 map in Hz. A complete undersampled MRF acquisition of 1,000 variable length TRs was acquired 48 times to generate a fully sample data set for every TR for the phantom study. One thousand images were reconstructed for both a fully-sampled (R = 1) and an undersampled (R = 48) MRF acquisition series using an iterative sample density compensation and gridding4 without and with MFI correction with 16 basis frequencies (8 in vivo). For the in vivo study using MFI, field maps were modified prior to MFI in order to mask fat in the off-resonance map that was not modeled in the dictionary and to improve off-resonance extrapolation in regions of low signal. The 1,000 point time series for each voxel in the reconstructed image was matched against the MRF dictionary generated from an extended phase graph model with dictionary spacing in T1 and T2 as previously reported1.Results
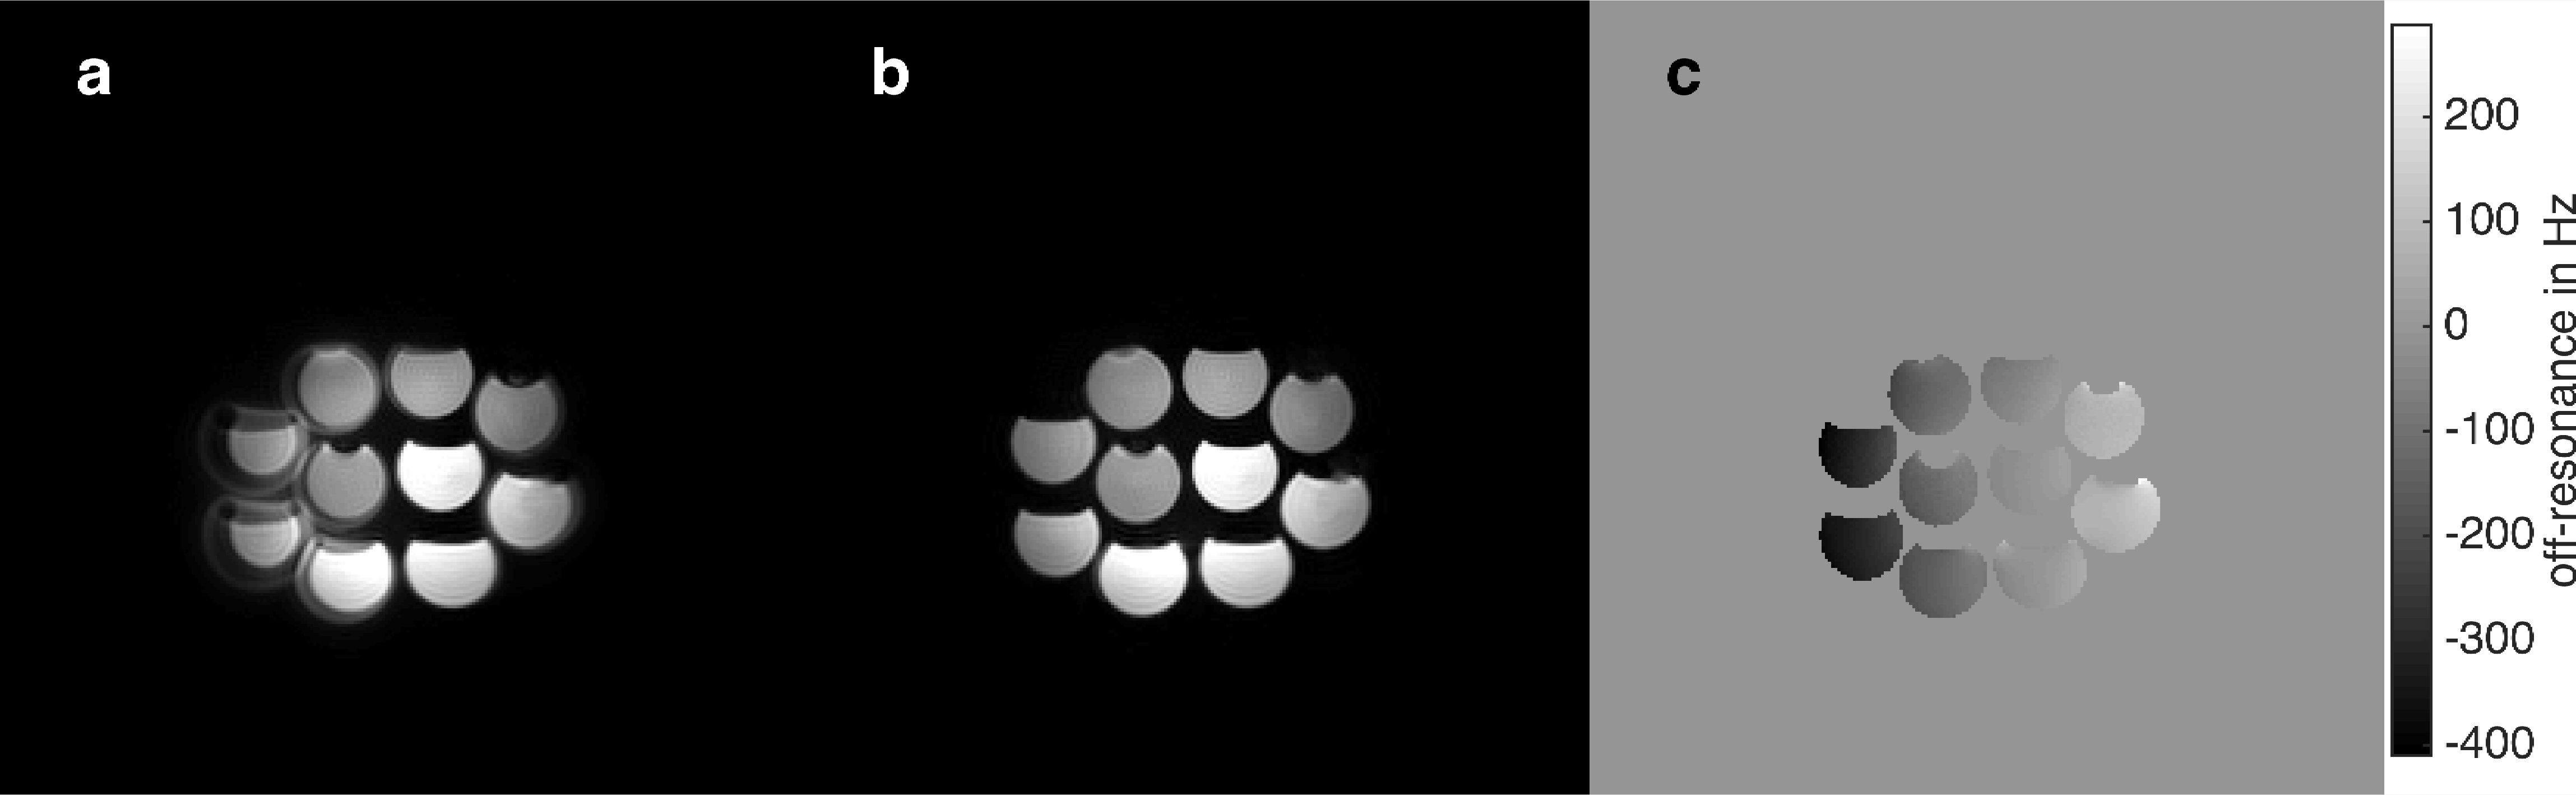
The magnitude images of fully sampled data summed over all MRF acquisitions without and with MFI corrections and associated B0 map are seen in Figure 1. Figure 2 shows a magnitude image from a single time point in the MRF acquisition and mapping results from the fully sampled and under-sampled k-space data for MFI uncorrected and corrected reconstructions. The fully sampled magnitude images and parameters maps of the phantoms show improvement in geometric definition with MFI. Similar improvements in image quality of the T1 and T2 maps are seen in the undersampled data as the fully sampled data, particularly in the left portion of the image (Fig. 2). The T1 and T2 values also are consistent between the fully sampled and undersampled case. Artifacts in the uncorrected images and maps demonstrate inferior image quality without correction that is expected to worsen with either increasing off-resonance or increase in spiral acquisition length. Figure 3 shows T1 parameter maps without and with MFI correction at the transverse level of the orbits, optic nerve and temporal lobe and a magnified region near the left temporal lobe/bone. Marginal improvement using MFI is seen in the definition of a visible sulcus and adjacent region of white matter on the parameter map.Conclusion
The deblurring via MFI indicates that quantification using MRF in cases of significant B0 heterogeneity can be overcome and reduce parameter estimation uncertainty in regions such as air-tissue interfaces and local variations in magnetic susceptibility. This technique can be successfully employed in vivo and may be of even greater value in improving parameter quantitation in regions outside the brain where off-resonance effects will be prevalent.Acknowledgements
This work was supported in part by funding from NIH NIBIB T32 EB014841.References
1. Jiang Y, Ma D, Seiberlich N, Gulani V, Griswold MA. MR fingerprinting using fast imaging with steady state precession (FISP) with spiral readout. Magnetic Resonance in Medicine. 2014;1631:1621–1631. 2. Man LC, Pauly JM, Macovski A. Multifrequency interpolation for fast off-resonance correction. Magnetic resonance in medicine. 1997;37(5):785–92. 3. Pipe JG, Zwart NR. Spiral trajectory design: a flexible numerical algorithm and base analytical equations. Magnetic Resonance in Medicine. 2014;71(1):278–85. 4. http://www.ismrm.org/mri_unbound/sequence.htm.
Figures