0933
Improved spiral trajectory correction using the gradient impulse response function (GIRF) with application to MR Fingerprinting1Application Development, Siemens Healthcare, Erlangen, Germany, 2Pattern Recognition Lab, Friedrich-Alexander University Erlangen-Nürnberg (FAU), Erlangen, Germany, 3Biomedical Engineering, University of Virginia, Charlottesville, VA, United States, 4Biochemistry and Biophysics Center, Division of Intramural Research, National Heart Lung and Blood Institute, National Institutes of Health, Bethesda, MD, United States
Synopsis
The purpose of this study is to evaluate different spiral trajectory prediction models - isotropic, Tan-Meyer and GIRF - to mitigate image artifacts for spiral MRI and improve accuracy of quantitative T1/T2 values for MR Fingerprinting. GIRF scan parameters were optimized to allow a total measurement time of only six minutes for a one-time calibration. GIRF similarly provided excellent results for vastly different trajectory types, varying in max. slew rate, gradient amplitude and number of interleaves, and showed some advantages against Tan-Meyer for trajectory designs with high k-space center slew rate, both for qualitative and quantitative results.
Purpose
Spiral trajectories are prone to blurring or image distortion artifacts caused by MR system imperfections like residual gradient delays and eddy currents. As a reference, trajectories can be measured and used for reconstruction, which is a time-consuming procedure and needs to be done for each different trajectory design, i.e. orientation, resolution etc1. Using a generalized model to predict the trajectory - e.g. as proposed by Tan-Meyer2 – was shown to improve on this using a one-time calibration. This work evaluates the Tan-Meyer model and compares it to another trajectory prediction method using convolution with the gradient impulse response function (GIRF)3,4,5. The method was optimized to acquire a 3-axis GIRF by MR measurements in a total time of six minutes. Image artifacts could be reduced significantly; also MR Fingerprinting (MRF) results were shown with more accurate quantitative T1 and T2 values.Methods
MR measurements were performed on a MAGNETOM Skyra 3T (Siemens Healthcare, Erlangen, Germany). Different trajectories were designed using the Hargreaves algorithm (Traj-H)6 and an improved variant of the dual-density Meyer algorithm (Traj-M)7. Experimental trajectories were measured with a modified Duyn method1. Different models were used to calculate the trajectory for the reconstruction. 1) isotropic model (zero-order gradient delay), 2) Tan-Meyer model2 (anisotropic zero-order gradient delays and residual eddy currents), 3) GIRF model3. Assuming linearity and time-invariance, gradients are predicted by a convolution with the GIRF. MR measurements8 were thoroughly optimized for minimal scan time at same performance on a MAGNETOM Aera 1.5T (Siemens Healthcare, Erlangen, Germany): 4 averages, TR 500 ms, dwell time 2.5 us, offcenter-shift-distance 50 mm and slice-thickness 2 mm allowed to measure the 3-axis-GIRF within total six minutes. Model-calculated trajectories were compared to the measured ones using Traj-H and Traj-M spiral designs. Deviations were evaluated in the k-space, the images and in quantitative values from MRF using a NIST system phantom (High-Precision-Devices, Boulder, CO). 2D-MRF-FISP9 data were acquired using a prototype sequence. Five different trajectory types (with varying max. slew rate, gradient amplitude and interleaves) were assessed using the normalized mean absolute error (NMAE) in k-space.Results
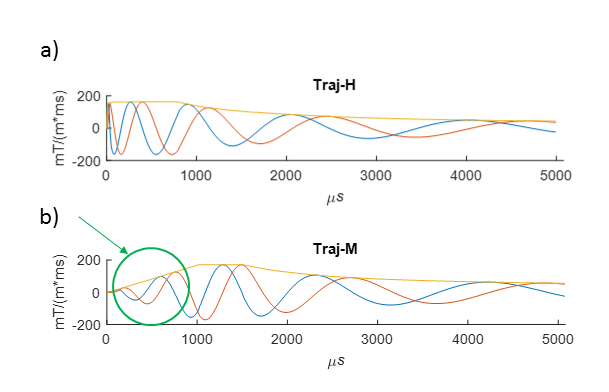
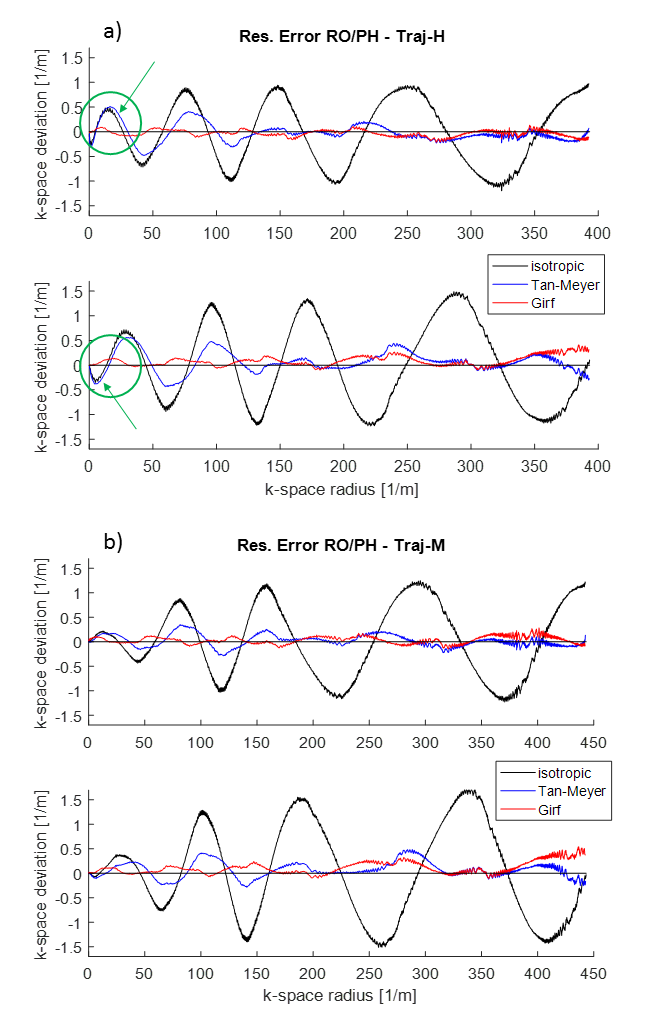
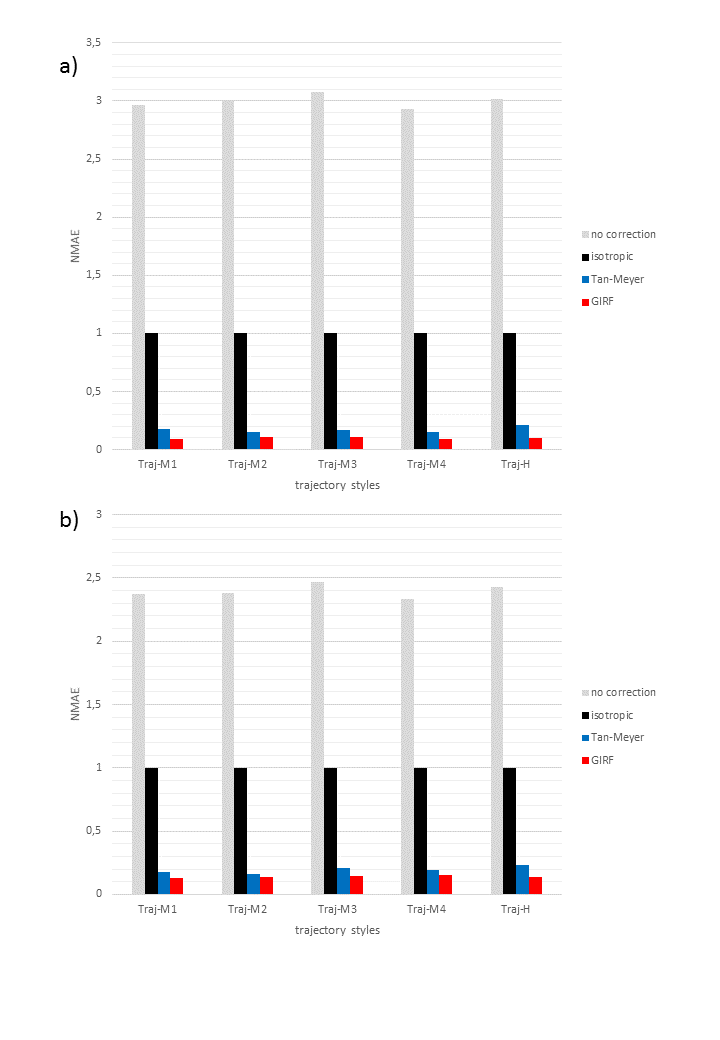
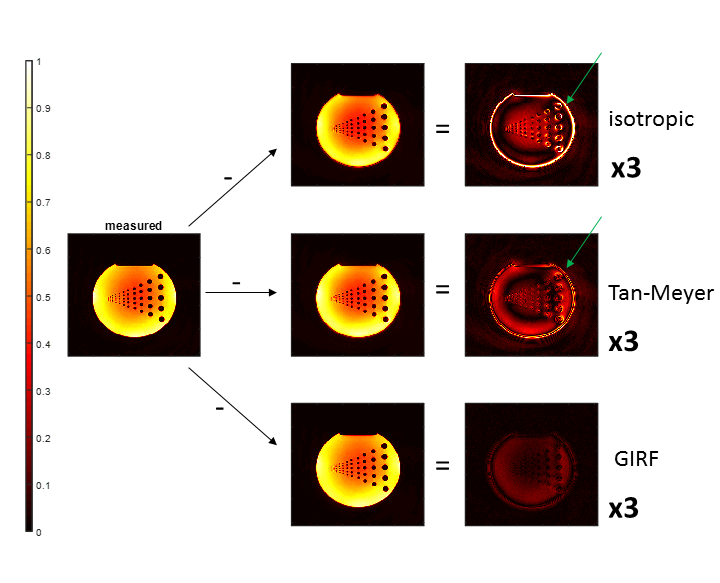
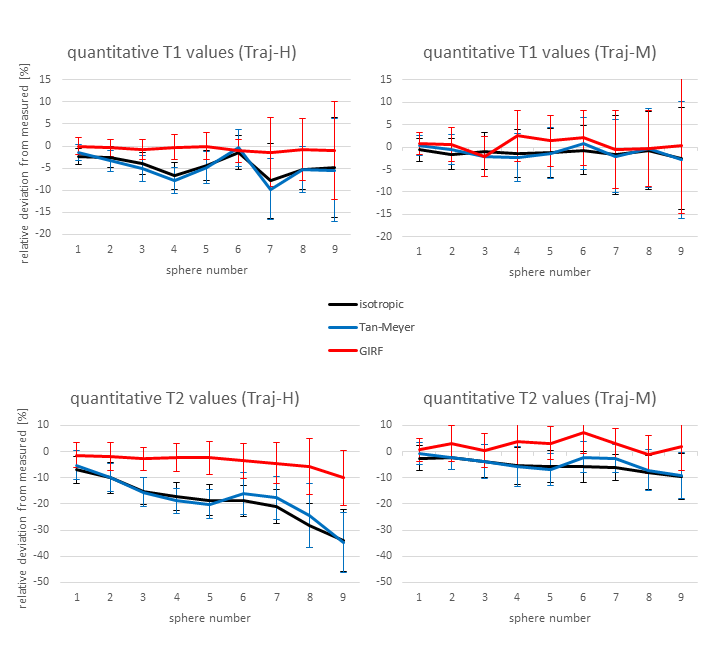
Hargreaves and Meyer trajectory designs are shown in Figure 1. The modified Meyer design (Traj-M) increases the slew gradually at k-space center, whereas Traj-H starts at maximum slew rate. The residual k-space error calculated with the Tan-Meyer and GIRF model is significantly lower compared to the isotropic model (Figure 2). Specifically, at k-space center, GIRF showed some advantages over Tan-Meyer. The high slew rate in the Traj-H trajectory design can be better predicted. Different trajectory types and models were evaluated in k-space by NMAE relative to the isotropic model (Figure 3). Both the Tan-Meyer and GIRF models obtain very low NMAE values for all trajectory designs, with the GIRF values slightly smaller. Images were reconstructed with different trajectories and compared to the image from the measured trajectory (Figure 4). The isotropic model shows a spatial object scaling (edge) and rotation image artifact, which is visible at the phantom border. Tan-Meyer was able to correct both artifacts very well, but left small intensity deviations, which were not present with GIRF. Quantitative T1/T2 values obtained with MRF in the NIST phantom have close to zero deviation from the values obtained by using the measured trajectory (Figure 5). Isotropic and Tan-Meyer do not differ significantly from each other and deviate from the zero line. Tan-Meyer provided better results for Traj-M compared to Traj-H design. GIRF is able to improve accuracy of quantitative MRF values, especially T2.Discussion
The responsible source of image quality improvement using the GIRF estimation is the better prediction in k-space center, where most of the image information is present in MRI. Isotropic and Tan-Meyer could not reduce all image signal intensity deviations or deviations from quantitative T1 and T2 values in MRF. As shown, the GIRF is able to cope with the high slew rate at the center of the Hargreaves trajectory. GIRF is also a more generic model to predict other trajectory designs in an excellent manner.Conclusion
The GIRF model works well to correct for trajectory deviations and image artifacts arising from these. It also improves accuracy of quantitative values generated by MRF. It is general in terms of trajectory designs even with near-limit slew rates. A small residuum was still present in image space, which can potentially be addressed by off-resonance and Maxwell corrections. A one-time system calibration for a robust GIRF model takes only six minutes – without any additional equipment – making the approach very promising to extensively improve spiral imaging quality and quantitative mapping using MRF.Acknowledgements
We gratefully thank Prof. Mark Griswold and his group and collaborators at Case Western Reserve University, Cleveland, OH for support and for many intensive discussions.References
1. Duyn J, Yang Y, Frank J, et al. Simple Correction Method for k-Space Trajectory Deviations in MRI. Journal of Magnetic Resonance. 132, 150–153 (1998).
2. Tan H, Meyer C: Estimation of k-Space Trajectories in Spiral MRI. Magnetic Resonance in Medicine. 2009;61:1396-1404.
3. Campbell-Washburn A, Xue H, Lederman R, et al. Real-Time Distortion Correction of Spiral and Echo Planar Images Using the Gradient System Impulse Response Function. Magnetic Resonance in Medicine. 2016;75:2278-2285.
4. Vannesjo J, Haeberlin M, Kasper L, et al. Gradient System Characterization by Impulse Response Measurements with a Dynamic Field Camera. Magnetic Resonance in Medicine. 2013;69:583-593.
5. Vannesjo J, Graedel N, Kapser L, et al. Image Reconstruction Using a Gradient Impulse Response Model for Trajectory Prediction. Magnetic Resonance in Medicine. 2016;76:45-58.
6. Hargreaves B. Variable-Density Spiral Design Functions. Sept 2000. http://mrsrl.stanford.edu/~brian/vdspiral. Accessed October 2016.
7. Meyer C, Zhao L, Lustig M, et al: Dual-density and parallel spiral ASL for motion artifact reduction. Proceedings ISMRM 2011;3986.
8. Robison R, Pipe J: Linear Gradient System Characterization Using a Rapid Thin-slice Measurement. Proceedings ISMRM 2016;4283.
9. Jiang Y, Ma D, Seiberlich N, et al. MR fingerprinting using fast imaging with steady state precession (FISP) with spiral readout. Magnetic Resonance in Medicine. 2015;74(6):1621-1631.
Figures