0931
Longitudinal study of myocardial T1 and T2 relaxation times in aortic stenosis patients: before, and 3- and 12 months after aortic valve replacement1Institution for Medicine and Health, Linköping University, Linköping, Sweden, 2Center for Medical Image Science and Visualization, Linköping, Sweden
Synopsis
The purpose of this pilot study is to investigate whether myocardial relaxation times (T1 and T2), alter over time in patients with severe aortic valve stenosis, from pre-surgery to 12 months after aortic valve replacement. Myocardial relaxation times were measured pre surgery, and 3 months and 12 months post surgery with 3D-QALAS, T1-MOLLI and T2-GraSE. The results demonstrated significant changes in myocardial relaxation times over time after surgery in this patient group.
Purpose
Severe aortic valve stenosis is associated with increased diffuse myocardial fibrosis. Previous studies have demonstrated correlations between diffuse myocardial fibrosis and elevated native T1 relaxation time (1) together with shortened contrast enhanced T1 relaxation time (2). Furthermore, myocardial fibrosis has been correlated to shortened T2 relaxation times in animal studies (3). To our knowledge, the combination of T1 and T2 has not been investigated for patients with severe aortic stenosis in a longitudinal study post aortic valve replacement. The purpose of this pilot study is to investigate whether myocardial relaxation times (T1 and T2), alter over time in patients with severe aortic valve stenosis, from pre-surgery to 12 months after aortic valve replacement.Methods
Eight patients with severe aortic stenosis referred for surgical aortic valve replacement were included in this pilot study. Quantitative CMR scans at 3T were performed at baseline (prior to), 3 months and 12 months post surgery. The CMR scans included one 3D-QALAS (4) acquisition pre contrast and one 3D-QALAS acquisition post injection of 0.2 ml/kg Gadovist contrast agent. The 3D-QALAS method provides full coverage of the LV myocardium with simultaneous 3D mapping of T1- and T2 relaxation times in one breath hold. The patients also underwent native 2D MOLLI (5) T1 acquisitions and 2D T2-GraSE acquisitions, as well as post contrast 2D MOLLI T1 acquisitions at apical, mid-ventricular and basal slice position. Data from each patient were analyzed in 16 myocardial segments. In order to investigate differences in T1 and T2 over time after surgery, Friedman Analysis of Variance (ANOVA) with repeated measures were used in segment-wise data. The Wilcoxon signed-rank tests with Bonferroni corrections were performed as a post hoc test to reveal which specific means differed over time and to adjust for multiple comparisons.
Results
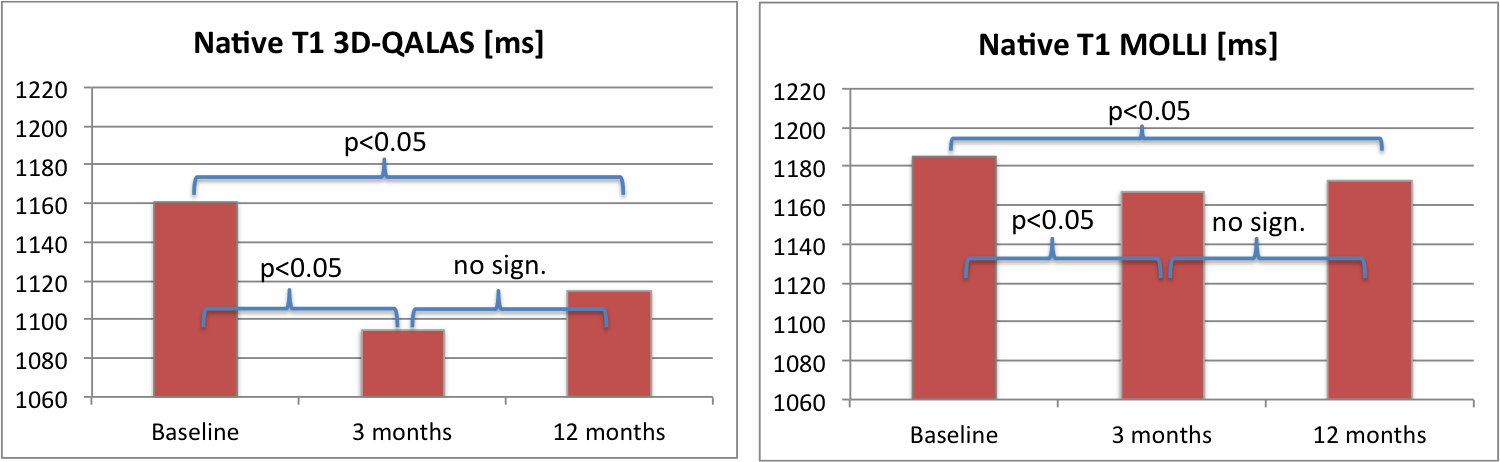
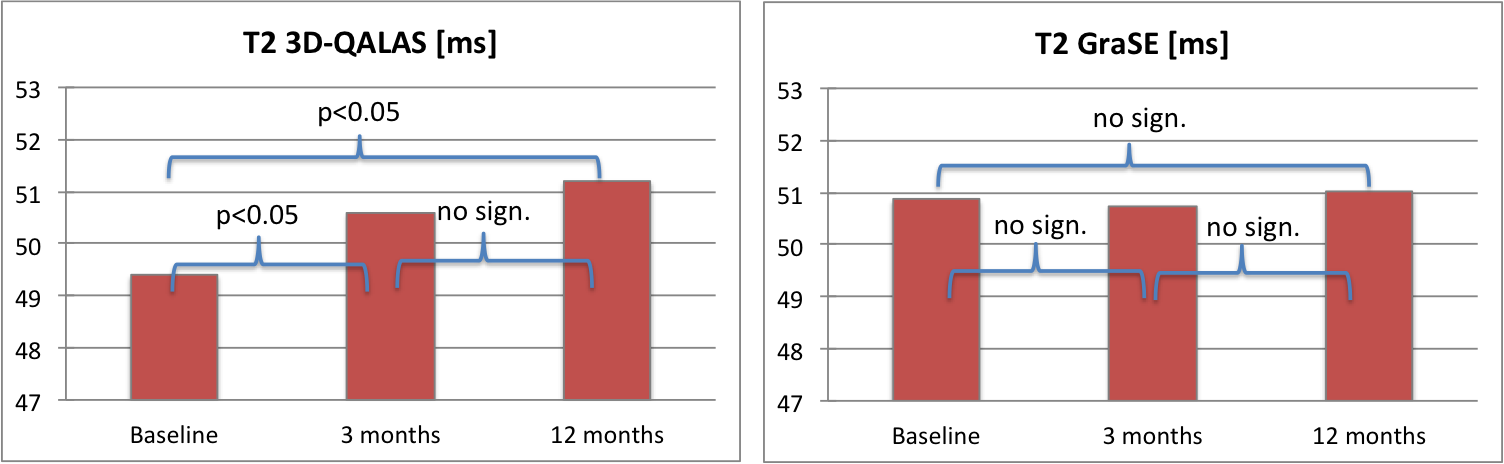
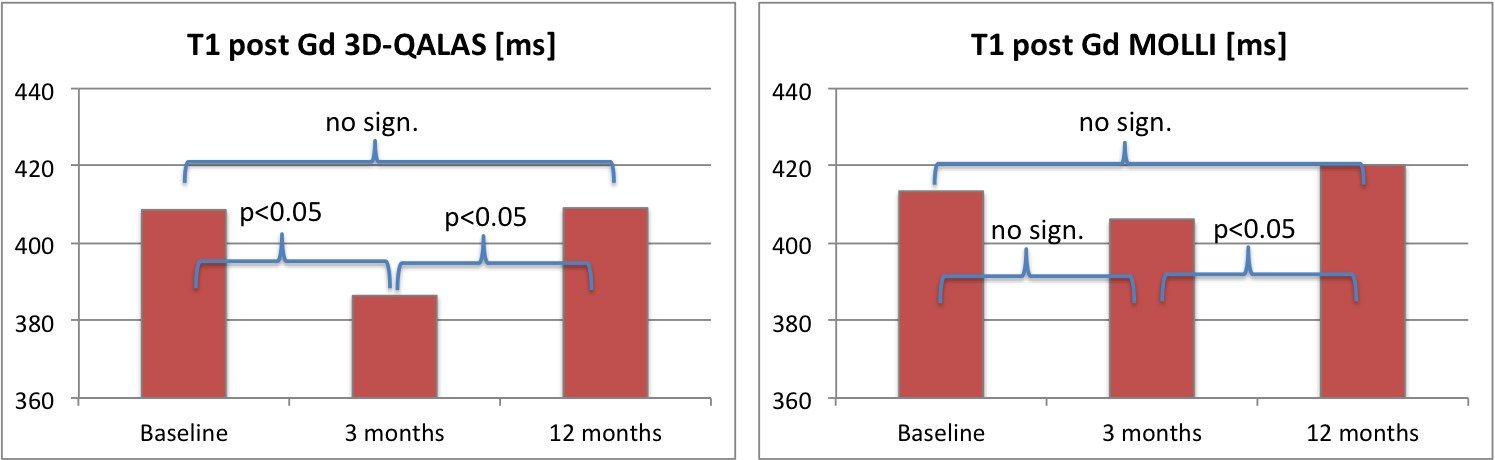
For native data, the T1 relaxation times were significantly shorter at 3 and 12 months post surgery than at baseline (Figure 1). Data show similar development over time for both the 2D method and 3D-method. The T2 relaxation times with 3D-QALAS were significantly longer at 3 and 12 months post surgery than at baseline (Figure 2). However, for the 2D-method, GraSE, no significant differences were found. In contrast enhanced tissue, T1 relaxation times with 3D-QALAS were significantly shorter at 3 months compared with baseline and significantly longer at 12 months compared with 3 months (Figure 3). No difference was found between baseline and the 12 months follow up. For MOLLI, data show the same trend as for 3D-QALAS, but the results were only significant between 3 and 12 months.Discussion
The longitudinal evolution of native myocardial T1 and T2 relaxation times, especially when measured with 3D-QALAS, may be interpreted as a remodeling of myocardial tissue after surgery. In contrast enhanced tissue, the long T1 time at baseline, might be contradictory to the theory where increased amount of myocardial fibrosis and thus a short T1 time would be expected at that time point. This may be explained by the impaired myocardial perfusion in this patient group at baseline, resulting in lower inflow of Gd-based contrast agent before the aortic valve replacement. The greater enhancement of contrast at 3 months after surgery might reflect the initial reversal of myocyte hypertrophy, subsequently leading to increased relative concentrations of diffuse myocardial fibrosis at this point.Conclusions
Myocardial relaxation times (native T1 and T2 together with contrast enhanced T1) have shown to change over time in patients with severe aortic valve stenosis, from pre-surgery to 12 months post aortic valve replacement.Acknowledgements
No acknowledgement found.References
1. Dass S, Suttie JJ, Piechnik SK, Ferreira VM, Holloway CJ, Banerjee R, et al. Myocardial Tissue Characterization Using Magnetic Resonance Noncontrast T1 Mapping in Hypertrophic and Dilated Cardiomyopathy. Circulation: Cardiovascular Imaging. 2012 November 1, 2012;5(6):726-33.
2. Iles L, Pfluger H, Phrommintikul A, Cherayath J, Aksit P, Gupta SN, et al. Evaluation of Diffuse Myocardial Fibrosis in Heart Failure With Cardiac Magnetic Resonance Contrast-Enhanced T1 Mapping. Journal of the American College of Cardiology. 2008;52(19):1574-80.
3. Bun S-S, Kober F, Jacquier A, Espinosa L, Kalifa J, Bonzi M-F, et al. Value of In Vivo T2 Measurement for Myocardial Fibrosis Assessment in Diabetic Mice at 11.75 T. Investigative Radiology. 2012;47(5):319-23. PubMed PMID: 00004424-201205000-00008.
4. Kvernby S, Warntjes MJB, Haraldsson H, Carlhäll C-J, Engvall J, Ebbers T. Simultaneous three-dimensional myocardial T1 and T2 mapping in one breath hold with 3D-QALAS. Journal of Cardiovascular Magnetic Resonance. 2014;16(1):1-14.
5. Messroghli DR, Radjenovic A, Kozerke S, Higgins DM, Sivananthan MU, Ridgway JP. Modified Look-Locker inversion recovery (MOLLI) for high-resolution T1 mapping of the heart. Magn Reson Med. 2004;52.
Figures