0928
Self-Gated Golden Angle Spiral CINE MRI for Endothelial Function Assessment1Division of Cardiology, Department of Medicine, Johns Hopkins University School of Medicine, Baltimore, MD, United States, 2Division of MR Research, Russel H. Morgan Department of Radiology and Radiological Science, Johns Hopkins University School of Medicine, Baltimore, MD, United States
Synopsis
A novel self-gated 2D spiral CINE MRI method is proposed to assess coronary endothelial function (CEF) and was tested in healthy volunteers. Cardiac self-gating data were extracted from the k-space center and showed high correlation with simultaneously-recorded ECG. High coronary image quality and CEF measures, in good agreement with a standard ECG-triggered method, can now be obtained without the need for ECG.
Introduction
Coronary endothelial cell release of nitric oxide (NO) in non-diseased vascular tissue maintains vascular tone and attenuates inflammation1. Abnormal coronary endothelial function (CEF) represents a marker for sub-clinical atherosclerotic disease and an independent predictor of cardiovascular events2. Despite this importance, CEF is rarely measured in clinical practice due to the invasive nature of catheterization-based methods previously required to measure CEF. Recently, a non-invasive method to quantify CEF was introduced that combined isometric handgrip exercise (IHE) with ECG-triggered cine MRI3 and those MRI-based measures were shown to be primarily NO-dependent and impaired in patients with coronary artery disease4. However, CEF measures are sometimes hindered by the requirement for ECG triggering in the MRI scanner. The ECG signal may be distorted by the magnetic and radiofrequency fields, motion, and muscular activity during IHE.Here, we propose a cardiac self-gating technique in combination with a golden-angle-interleaved spiral acquisition and iterative reconstruction (SG-GA) to eliminate the need for ECG gating during MRI. However, such a technique can also use ECG triggers, if available, for retrospective gating (ECG-GA). The SG-GA method was tested in healthy volunteers to quantify CEF and it was compared here to ECG-GA and to gold-standard ECG-triggered spiral cine3 (ECG-STD).
Methods
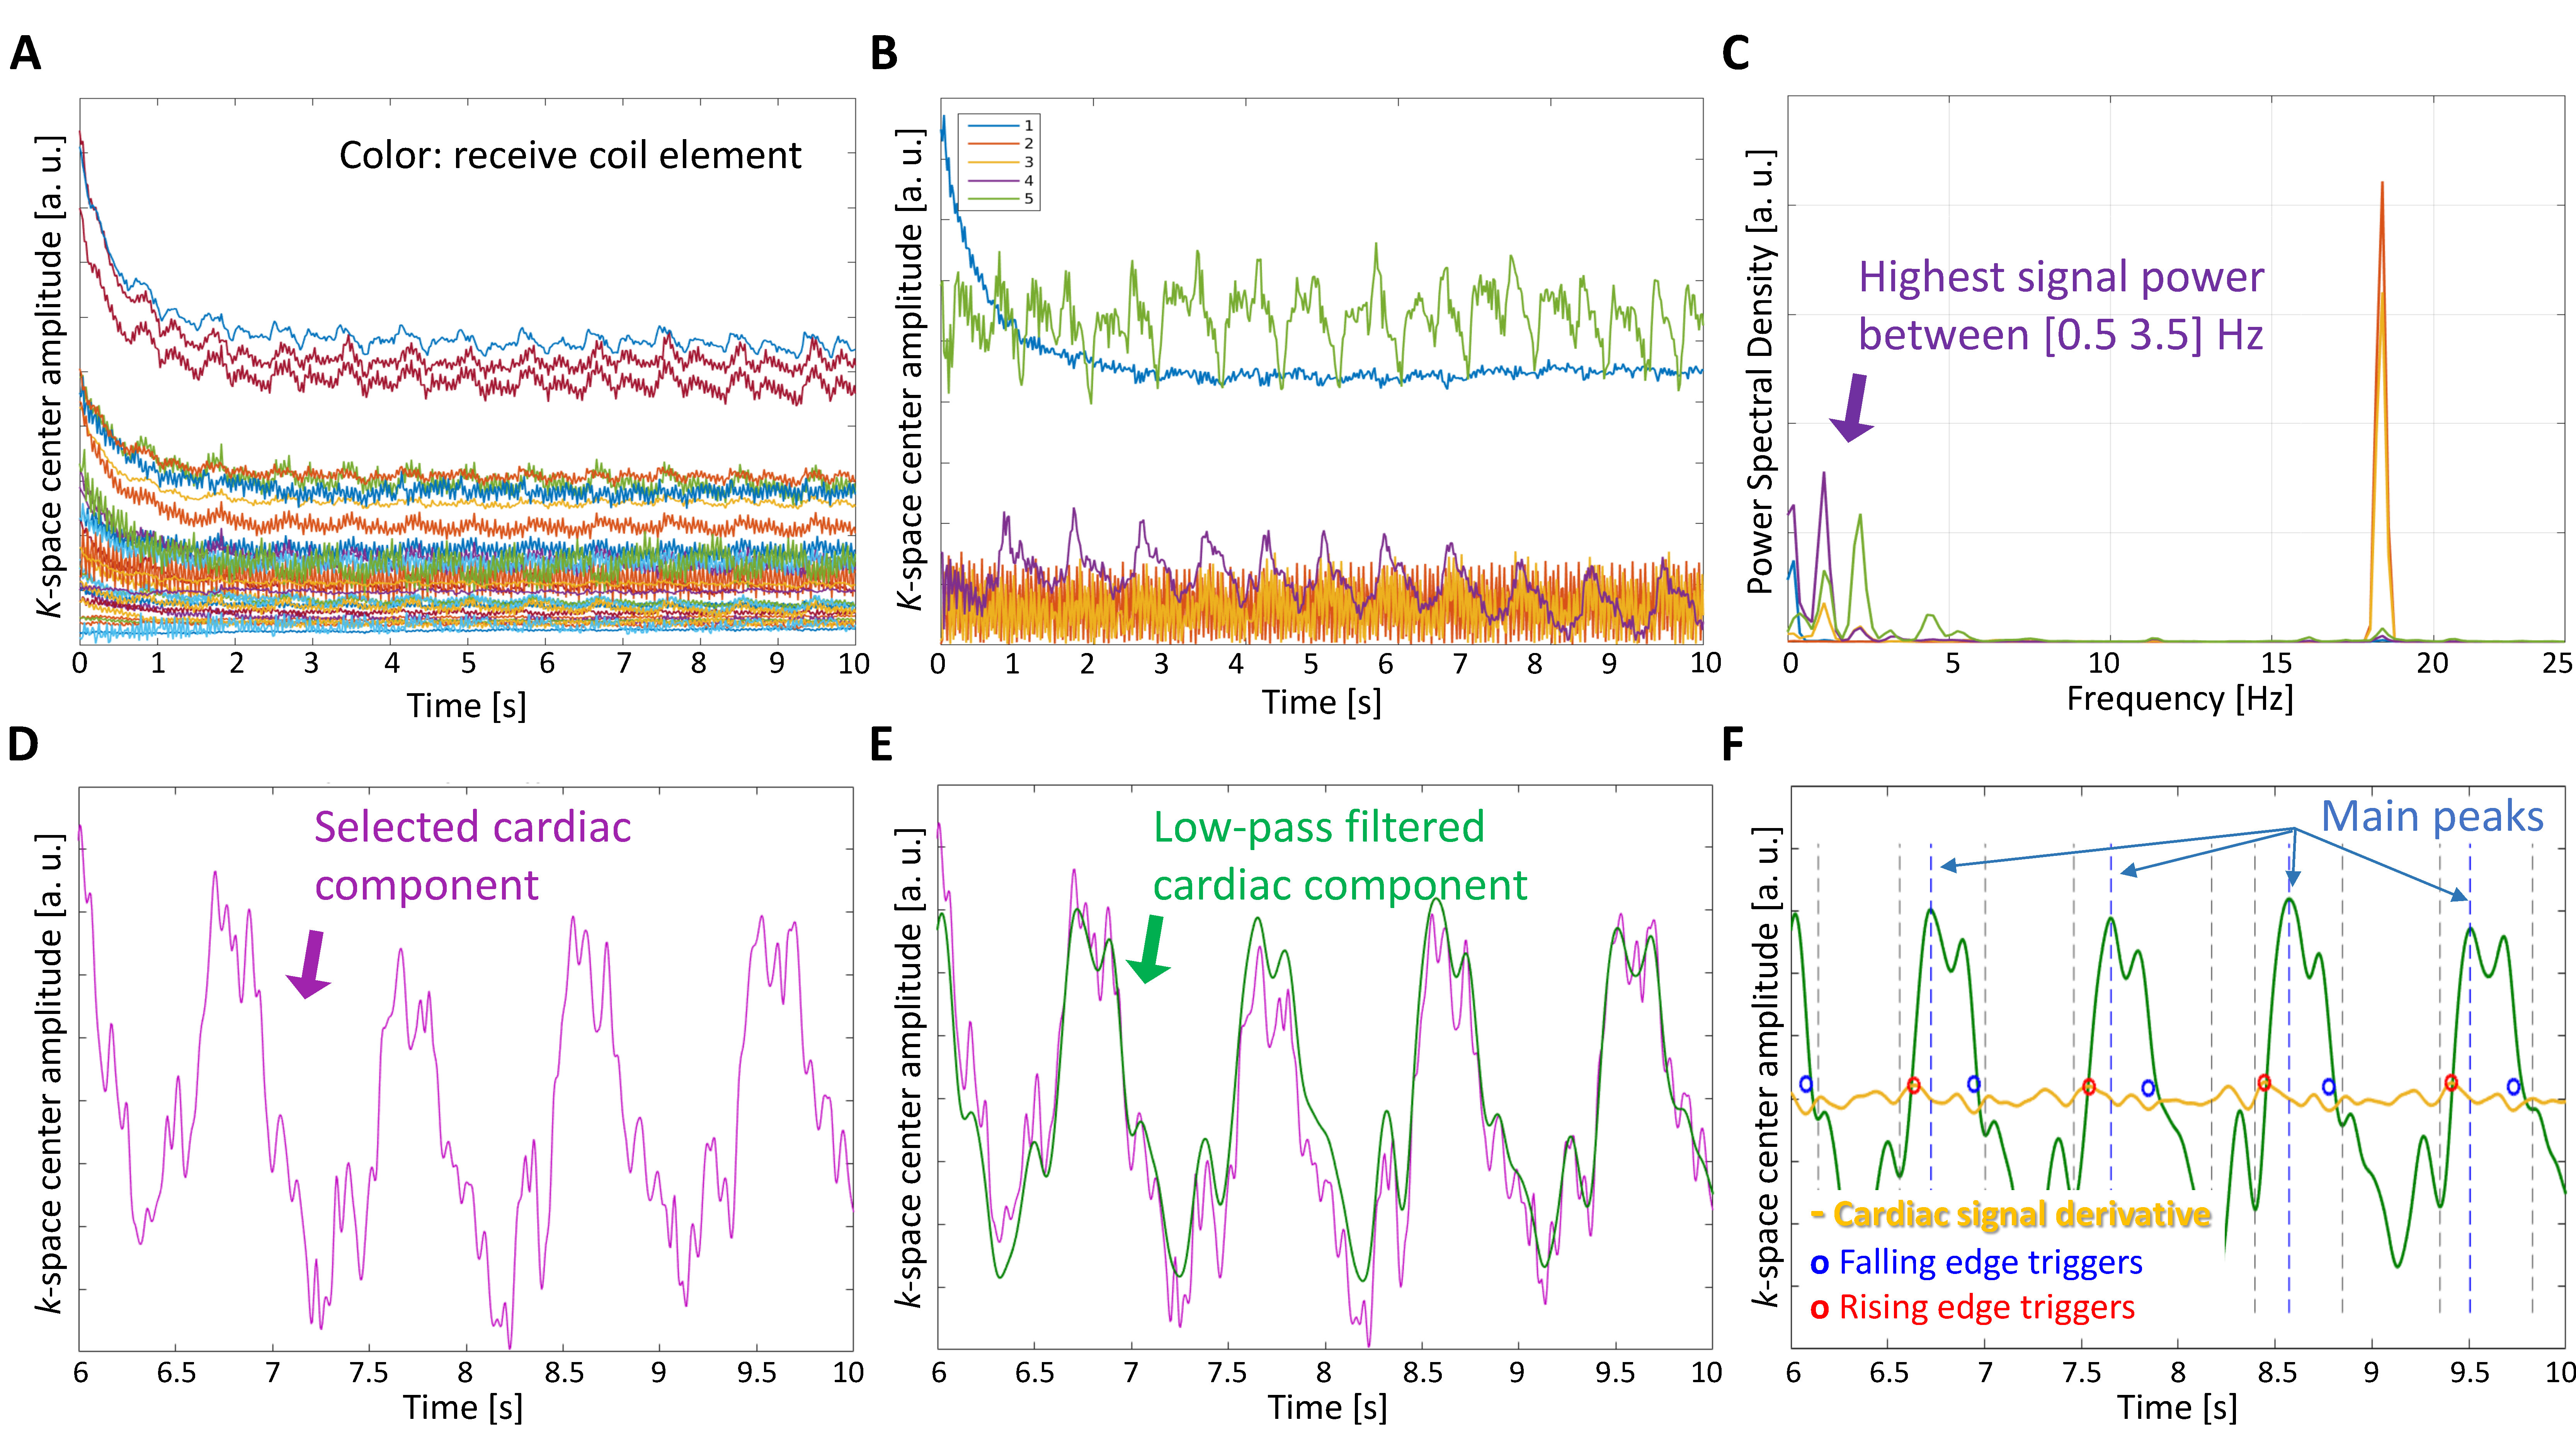
For self-gating, a cardiac signal is extracted from independent component analysis of k-space center amplitude5 acquired for all receive coils at the beginning of each spiral arm without the need of additional acquisitions. After low-pass filtering, peak analysis of the signal is performed to identify the onset of each heartbeat. Cardiac triggers are identified at the steepest points on the edges of the detected heartbeats of the cardiac signal, Figure 1. CEF data were obtained in 10 healthy volunteers, after fasting, at rest and during IHE stress with the three methods (SG-GA, ECG-GA and ECG-STD) from cross-sectional images of the proximal right and left coronary arteries in a 3T MR scanner (Achieva, Philips). Breath-held ECG-STD was acquired as reference3 and reconstructed at the scanner with a gridding algorithm6. The golden-angle7 variable-density 2D spiral8 GRE sequence was matched for scan time (19.5s) and resolution (0.89x0.89x8mm3). The data were reconstructed with an iterative-SENSE9 algorithm in GPI10 using cardiac triggers from either the proposed self-gating approach (SG-GA) or the scanner ECG (ECG-GA). The heartbeat intervals (time between sequential heart beats) detected with self-gating (x) were compared with those from the ECG (y) (R-R interval) using Pearson’s correlation coefficient (CC), and a metric for accuracy µ(|x-y|) and precision σ(x-y). For CEF assessment, lumen cross-sectional area (CSA) change between rest and IHE, was quantified using a FWHM algorithm (Cine, GE). For image quality, vessel sharpness (VS%) was quantified.11 All CSA and VS% measurements were averaged from 3 diastolic CINE frames after post-processing with a deblurring algorithm12. For statistical comparisons, one-way repeated measures ANOVA and Bonferroni’s multiple comparison test were used.Results
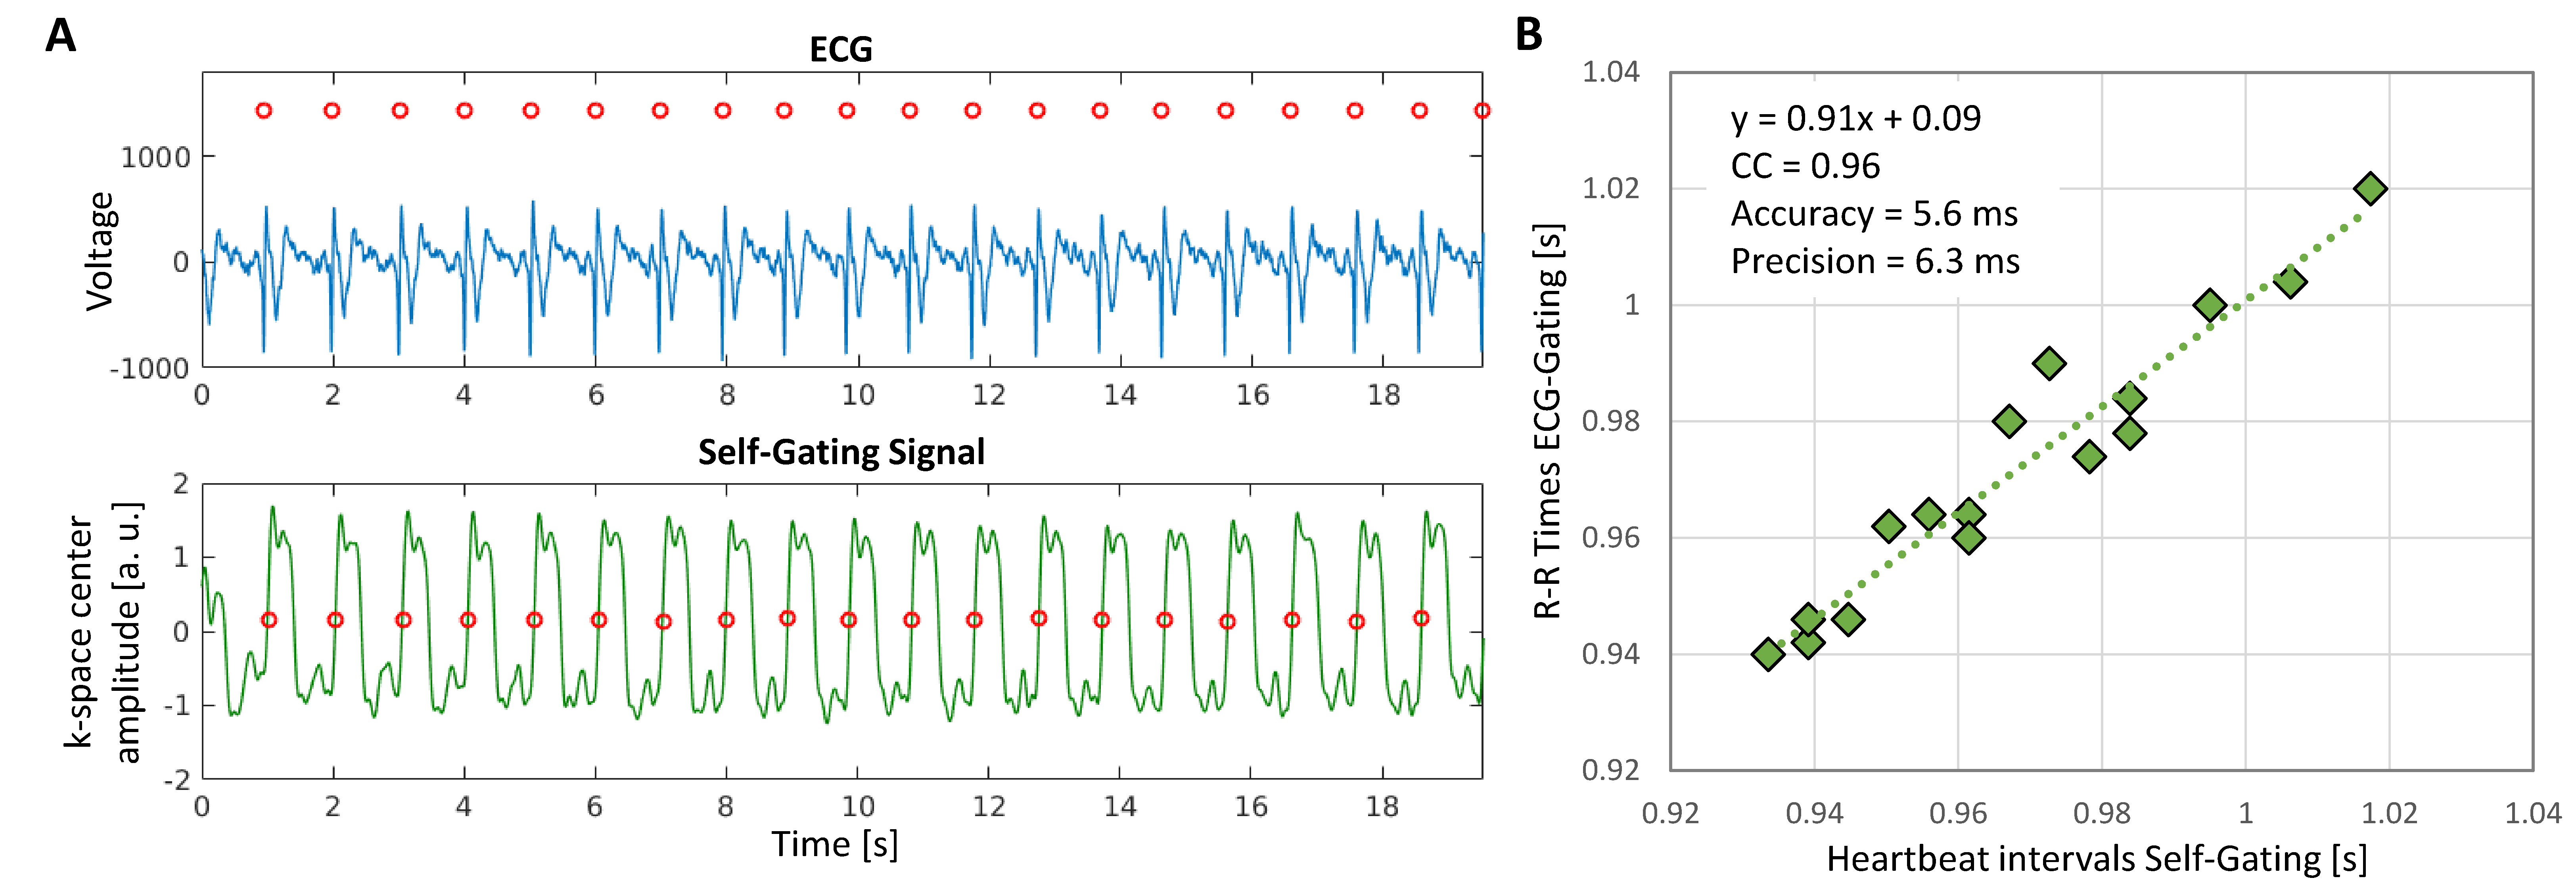
Self-gated heartbeat intervals showed high correlation overall with those from the ECG: CC=0.91±0.11, accuracy=8.9±6.2ms, and precision=10.8±9.2ms, Figure 2.Four acquired poor-quality scans were discarded (2 ECG-STD for bad triggering, 2 SG/ECG-GA for bad orientation that could not be verified at the scanner because of the off-line reconstruction). 1 ECG-STD and 1 SG/ECG-GA could not be scanned due to time constraints during IHE. As a result, 15/20 imaged coronaries provided good quality in all 6 datasets and were considered for analysis (90/120 total datasets).
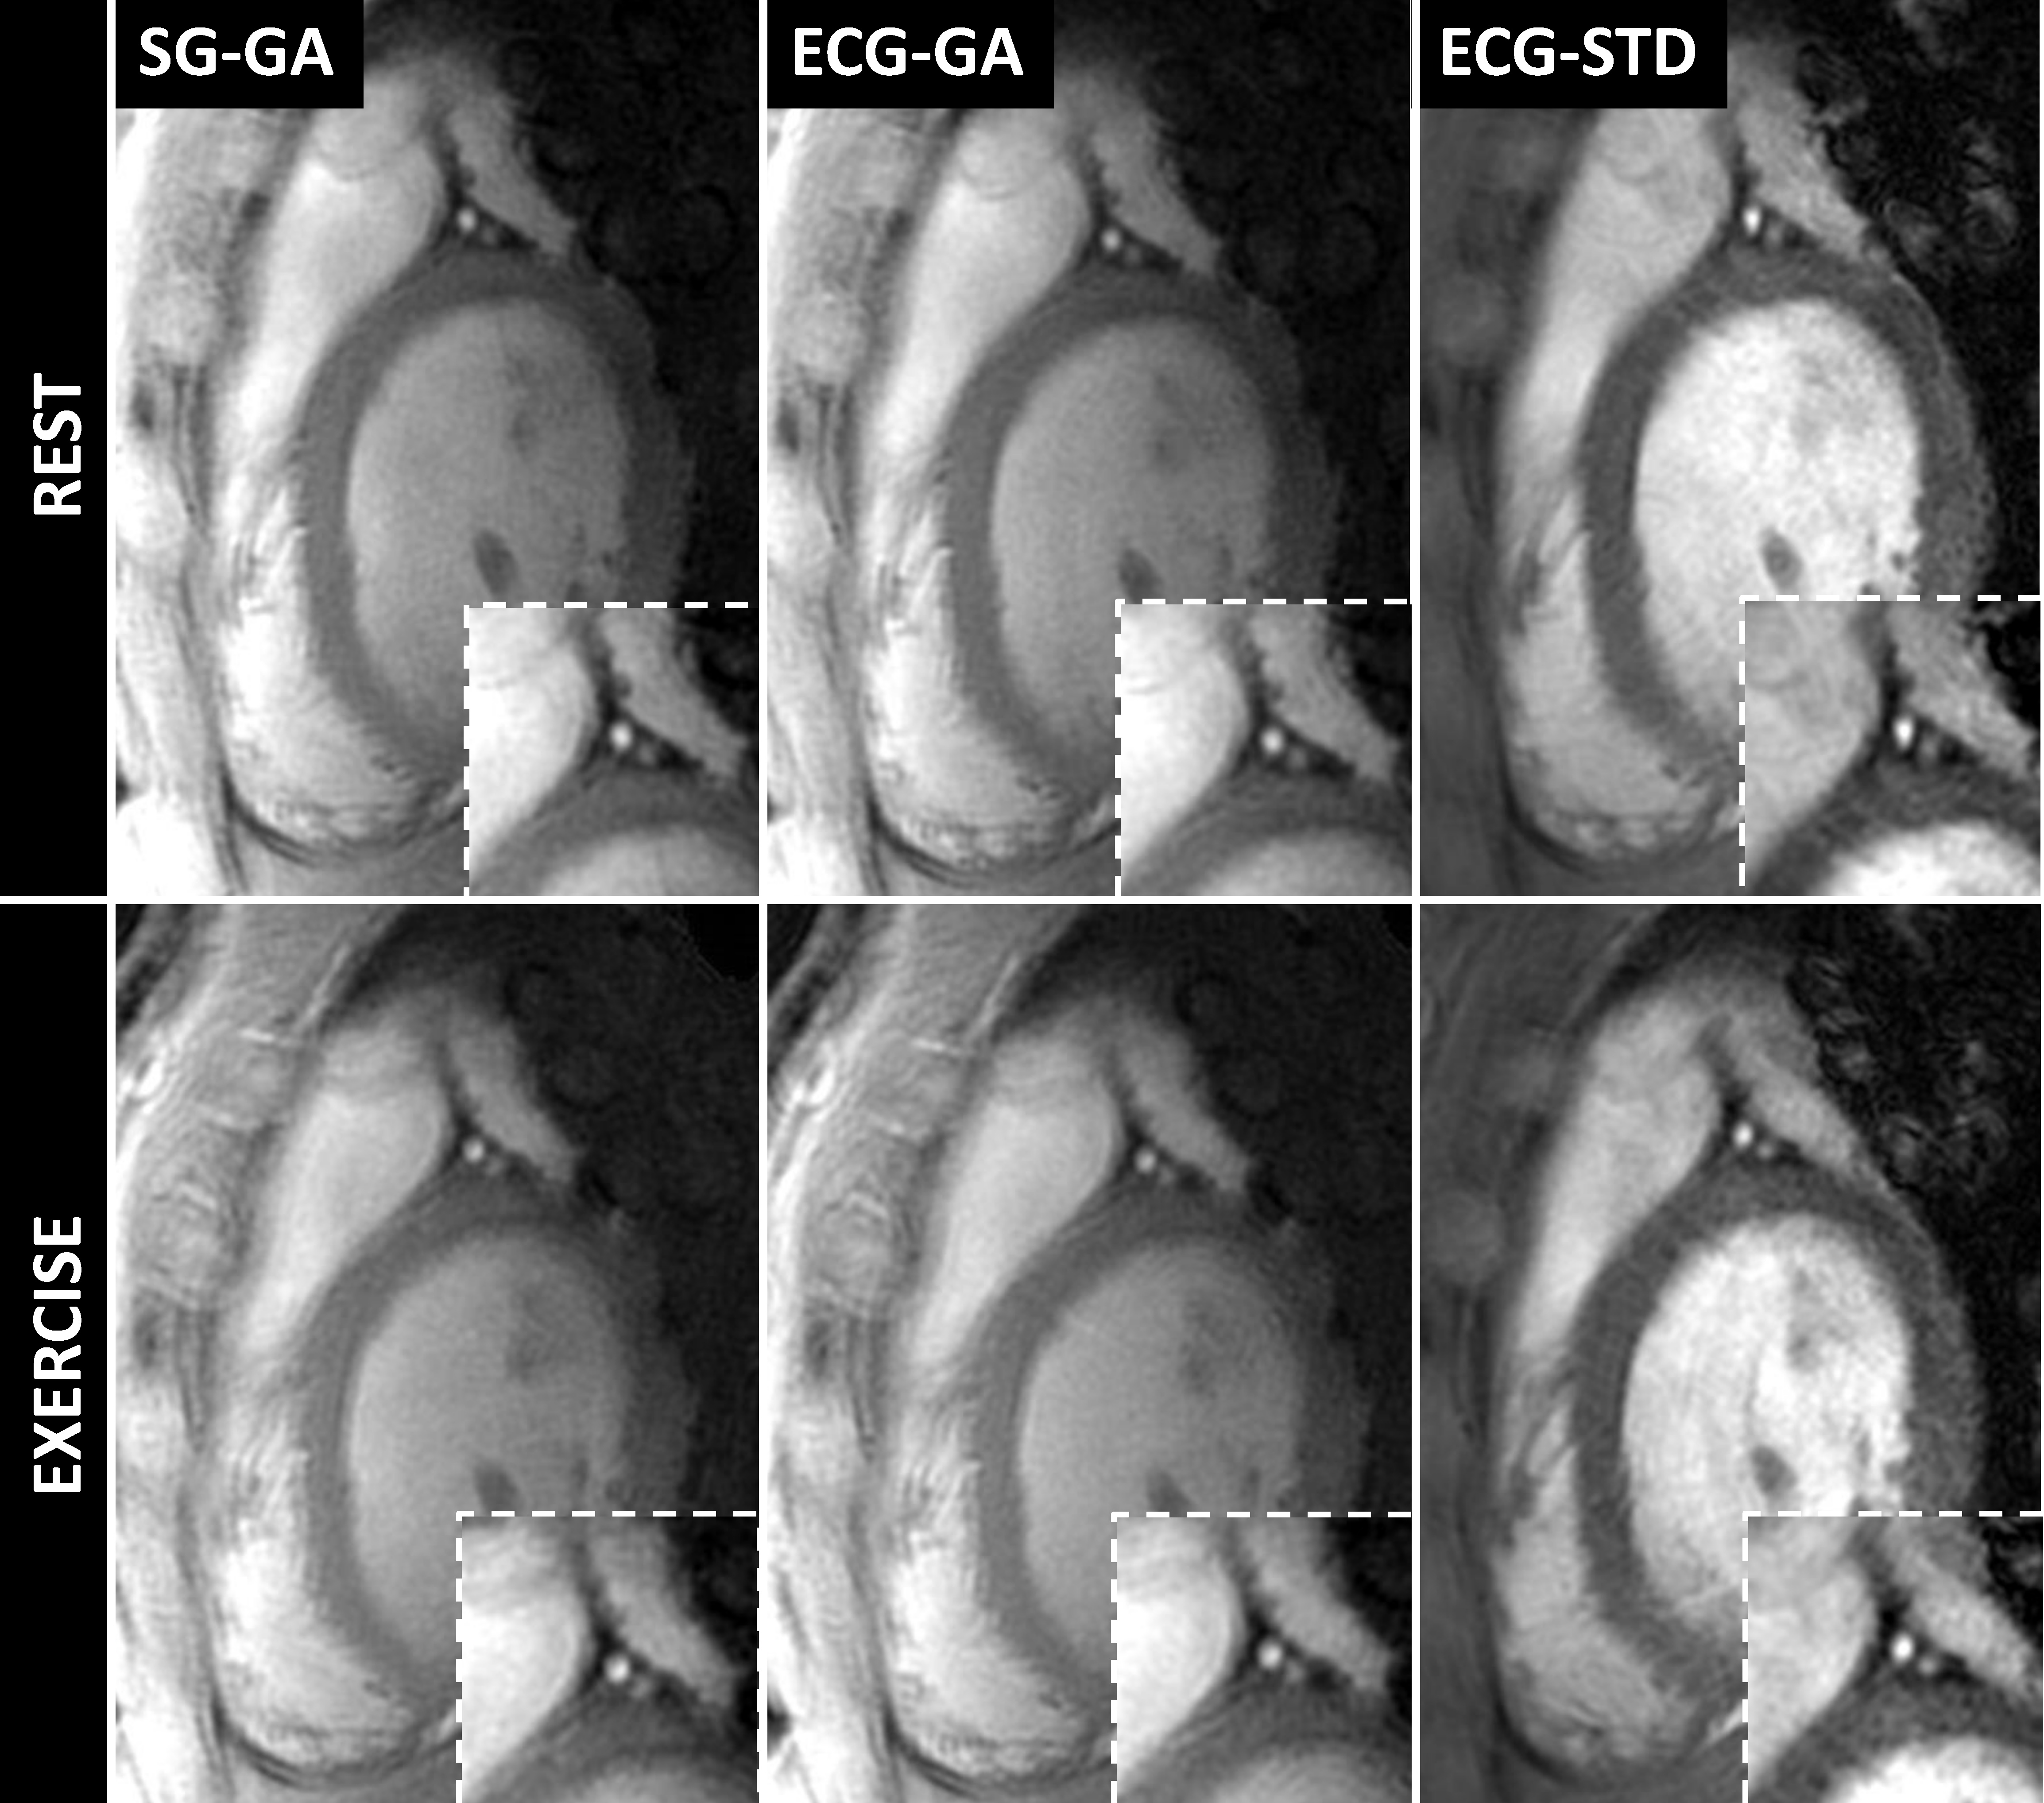
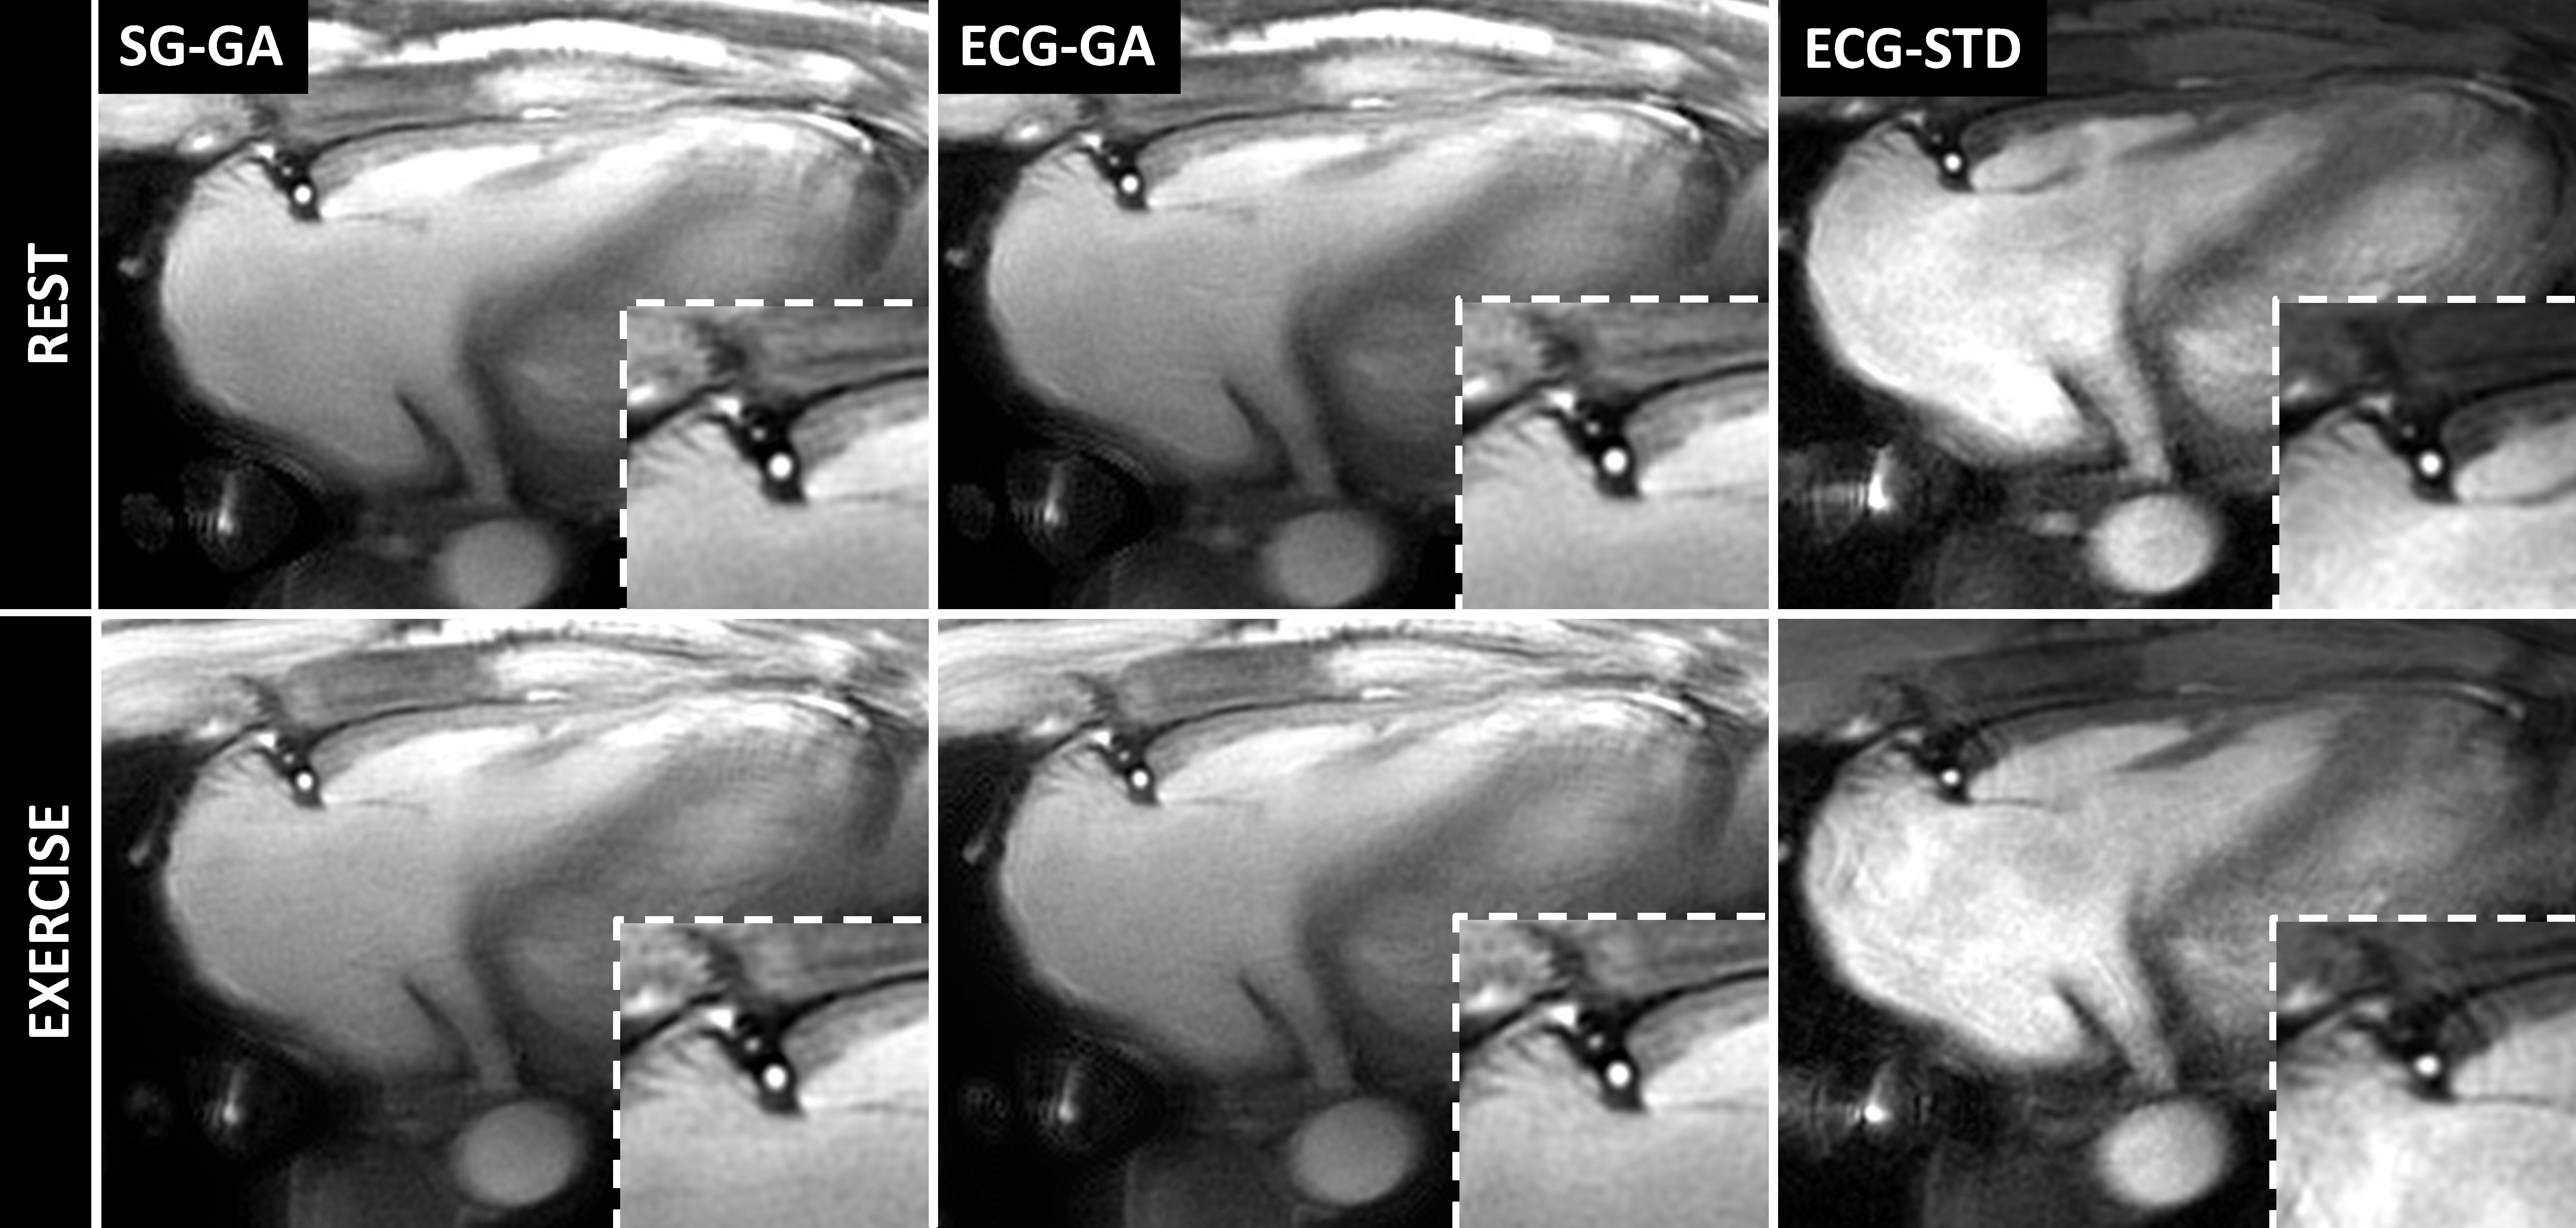
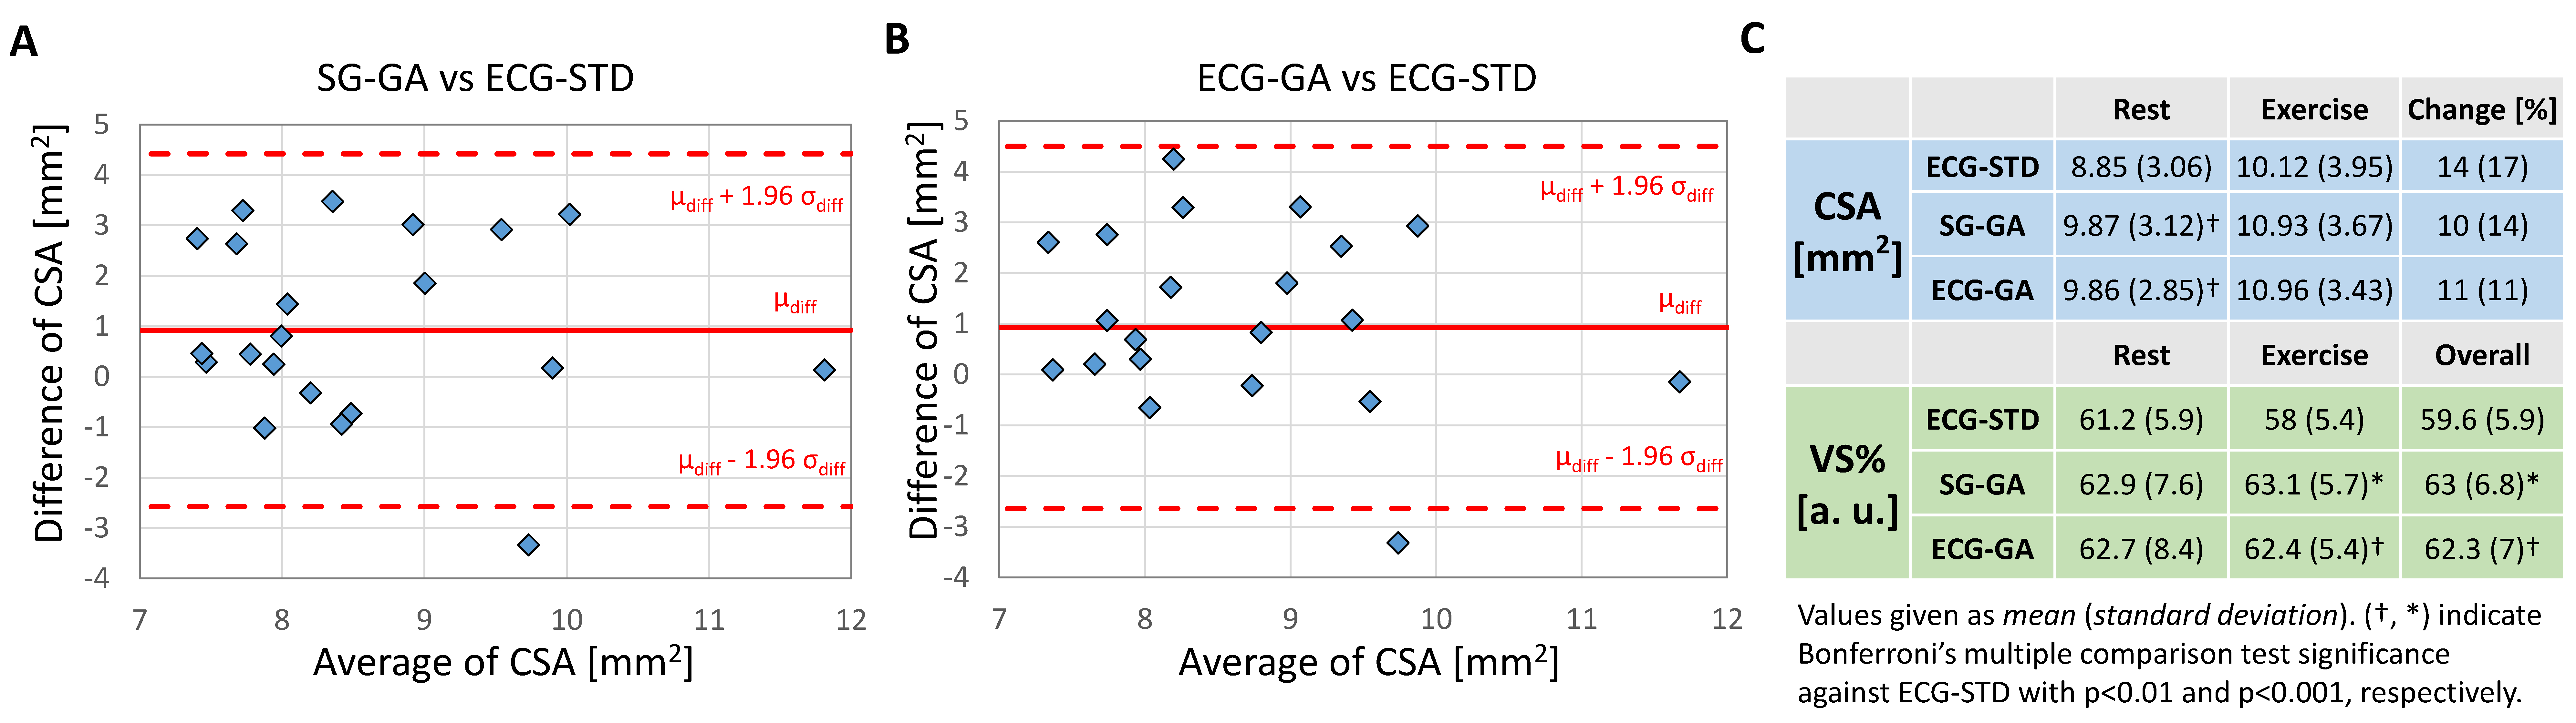
Good depiction of the lumen was obtained in the right (Figure 3) and left (Figure 4) coronaries with all methods. Bland-Altman plots for CSA showed agreement of SG-GA and ECG-GA with ECG-STD (95% CI [-2.6 4.6] and [-2.6 4.5] mm2, respectively), Figure 5A-B. CSA and VS% at rest and during exercise, and CSA percentage change with exercise are listed in Figure 5C. ECG-STD CSA measures increased 14%±17% during IHE (average±SD over all subjects). CSA measures at rest were higher for SG-GA and ECG-GA when compared to ECG-STD (p<0.01), while CSA measures at IHE and CSA change were not statistically different among all methods. Higher VS% was measured for SG-GA and ECG-GA when compared to ECG-STD (p<0.001 and p<0.01, respectively during IHE and overall), Figure 5C.
Discussion
The proposed cardiac self-gated MRI technique does not require ECG gating but provides high coronary artery image quality and CEF measures in agreement with the published standard sequence. The ECG signal is no longer a requirement but can still be used if available to provide a more flexible acquisition. Simultaneously, the golden-angle variable density trajectory lends itself for further improvements with compressed sensing algorithms. Evaluation of the technique in patients with cardiovascular disease is warranted.Acknowledgements
Work supported by HL120905 and HL125059.References
1. Ludmer PL, Selwyn AP, Shook TL, et al. Paradoxical Vasoconstriction Induced by Acetylcholine in Atherosclerotic Coronary Arteries. N Engl J Med. 1986;315(17):1046-1051.
2. Schächinger V, Britten MB, Zeiher AM. Prognostic impact of coronary vasodilator dysfunction on adverse long-term outcome of coronary heart disease. Circulation. 2000;101(16):1899-1906.
3. Hays AG, Hirsch GA, Kelle S, Gerstenblith G, Weiss RG, Stuber M. Noninvasive visualization of coronary artery endothelial function in healthy subjects and in patients with coronary artery disease. J Am Coll Cardiol. 2010;56(20):1657-1665.
4. Hays AG, Iantorno M, Soleimanifard S, et al. Coronary vasomotor responses to isometric handgrip exercise are primarily mediated by nitric oxide: a noninvasive MRI test of coronary endothelial function. Am J Physiol Heart Circ Physiol. 2015;308(11):H1343-H1350.
5. Bonanno G, Piccini D, Maréchal B, Zenge MO, Stuber M. A New Binning Approach for 3D Motion Corrected Self-Navigated Whole-Heart Coronary MRA Using Independent Component Analysis of Individual Coils. Proc Intl Soc Magn Reson Med Volume 23. Milan, Italy; 2014. p 936.
6. Jackson JI, Meyer CH, Nishimura DG, Macovski A. Selection of a convolution function for Fourier inversion using gridding [computerised tomography application]. IEEE Trans Med Imaging. 1991;10:473-478.
7. Winkelmann S, Schaeffter T, Koehler T, Eggers H, Doessel O. An optimal radial profile order based on the Golden Ratio for time-resolved MRI. IEEE Trans Med Imaging. 2007;26(1):68-76.
8. Pipe JG, Zwart NR. Spiral trajectory design: A flexible numerical algorithm and base analytical equations: Spiral Trajectory Design. Magn Reson Med. 2014;71(1):278-285. doi:10.1002/mrm.24675.
9. Pruessmann KP, Weiger M, Börnert P, Boesiger P. Advances in sensitivity encoding with arbitrary k-space trajectories. Magn Reson Med. 2001;46(4):638-651.
10. Zwart NR, Pipe JG. Graphical programming interface. Workshop on data sampling and image reconstruction. In: Proceedings of the Workshop Series of ISMRM. Sedona, Arizona; 2013.
11. Etienne A, Botnar RM, Van Muiswinkel AM, Boesiger P, Manning WJ, et al. (2002) "Soap-Bubble" visualization and quantitative analysis of 3D coronary magnetic resonance angiograms. Magn Reson Med 48: 658-666.
12. Noll DC, Pauly JM, Meyer CH, Nishimura DG, Macovski A. Deblurring for non-2D Fourier transform magnetic resonance imaging. Magn Reson Med. 1992;25(2):319-333.
Figures