0926
Impact of eddy-currents and cardiac motion in DTI of the in-vivo heart - a comparison of second-order motion compensated SE versus STEAM1Institute for Biomedical Engineering / University and ETH Zurich, Zurich, Switzerland
Synopsis
Motion-compensated (M2) spin-echo (SE) and stimulated-echo acquisition mode (STEAM) sequences have been proposed to generate diffusion contrast in in-vivo cardiac imaging. When comparing measured fractional anisotropy and mean diffusivity of cardiac tissue, marked differences have been reported between SE and STEAM. Cardiac motion, perfusion, different mixing times and eddy-currents have been discussed as potential source of discrepancies. In this study it is shown that signal dephasing due to eddy-currents play a minor role. While SE is more prone to motion-induced dephasing compared to STEAM, reported differences in mean diffusivity can only marginally be explained by motion-induced signal loss in SE.
Introduction
Diffusion-weighted STEAM1-3 has successfully been used for in-vivo cardiac diffusion tensor imaging (cDTI). Alongside, second-order motion compensated spin-echo (M2-SE) sequences have been propoesed7-9 yielding improved SNR efficiency10. However, an increased mean diffusivity (MD) and reduced fractional anisotropy (FA) have been reported for the M2-SE approach when compared to data obtained with STEAM. Differences in the diffusivity profile at different mixing times, perfusion as well as signal dephasing due to non-compensated motion and eddy-currents have been identified as potential sources of error. While STEAM is compromised by non-periodicity of cardiac motion, the M2-SE approach is susceptible to cardiac jerk and higher-order motion terms resulting in residual dephasing. It is the objective of the present work to study signal dephasing and thereby quantify eddy-current and motion-induced errors affecting quantification in in-vivo cardiac DTI.Methods
Data acquisition
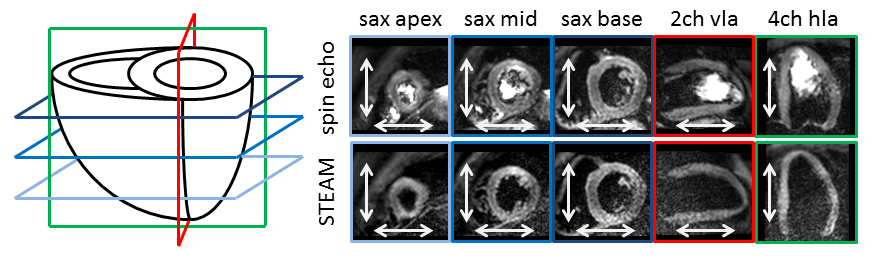
Imaging was performed on a 1.5T clinical MR system (Philips Healthcare, Best, The Netherlands) equipped with a 32-channel cardiac receiver array and a gradient system delivering 80mT/m@100mT/m/ms. Data was acquired with ECG triggering and during navigator gated (5mm gating window) breath holding. Three short-axis slices were acquired including one unweighted image and diffusion weighting in frequency encoding and in phase encoding direction. Through-plane dephasing was captured in the four-chamber horizontal long axis view (hla) and the two-chamber vertical long axis view (vla) (Figure 1). The key imaging parameters were identical for both M2-SE and STEAM: spatial resolution 2.5×2.5mm2, slice thickness 10mm, reduced FOV11 230×104mm2, signal averages 3, TR=3 R-R, TE=58ms/65ms/73ms/78ms (M2-SE) 29ms/32ms/37ms/41ms (STEAM), b-values: 100, 200, 400 and 600s/mm2. For the STEAM acquisition in short-axis view a TR of 6R-R intervals was chosen to allow for slice cycling. The trigger delay was set to the systolic strain sweet spot (50% systole)12 for STEAM imaging and matched for SE imaging so that the echo time points coincided.
Five healthy volunteers (3 female/HR 68±5bpm/age 27±2years) were imaged and the identical experiments were repeated in a 10l bottle filled with agar to assess eddy-current induced signal distortions.
Data analysis
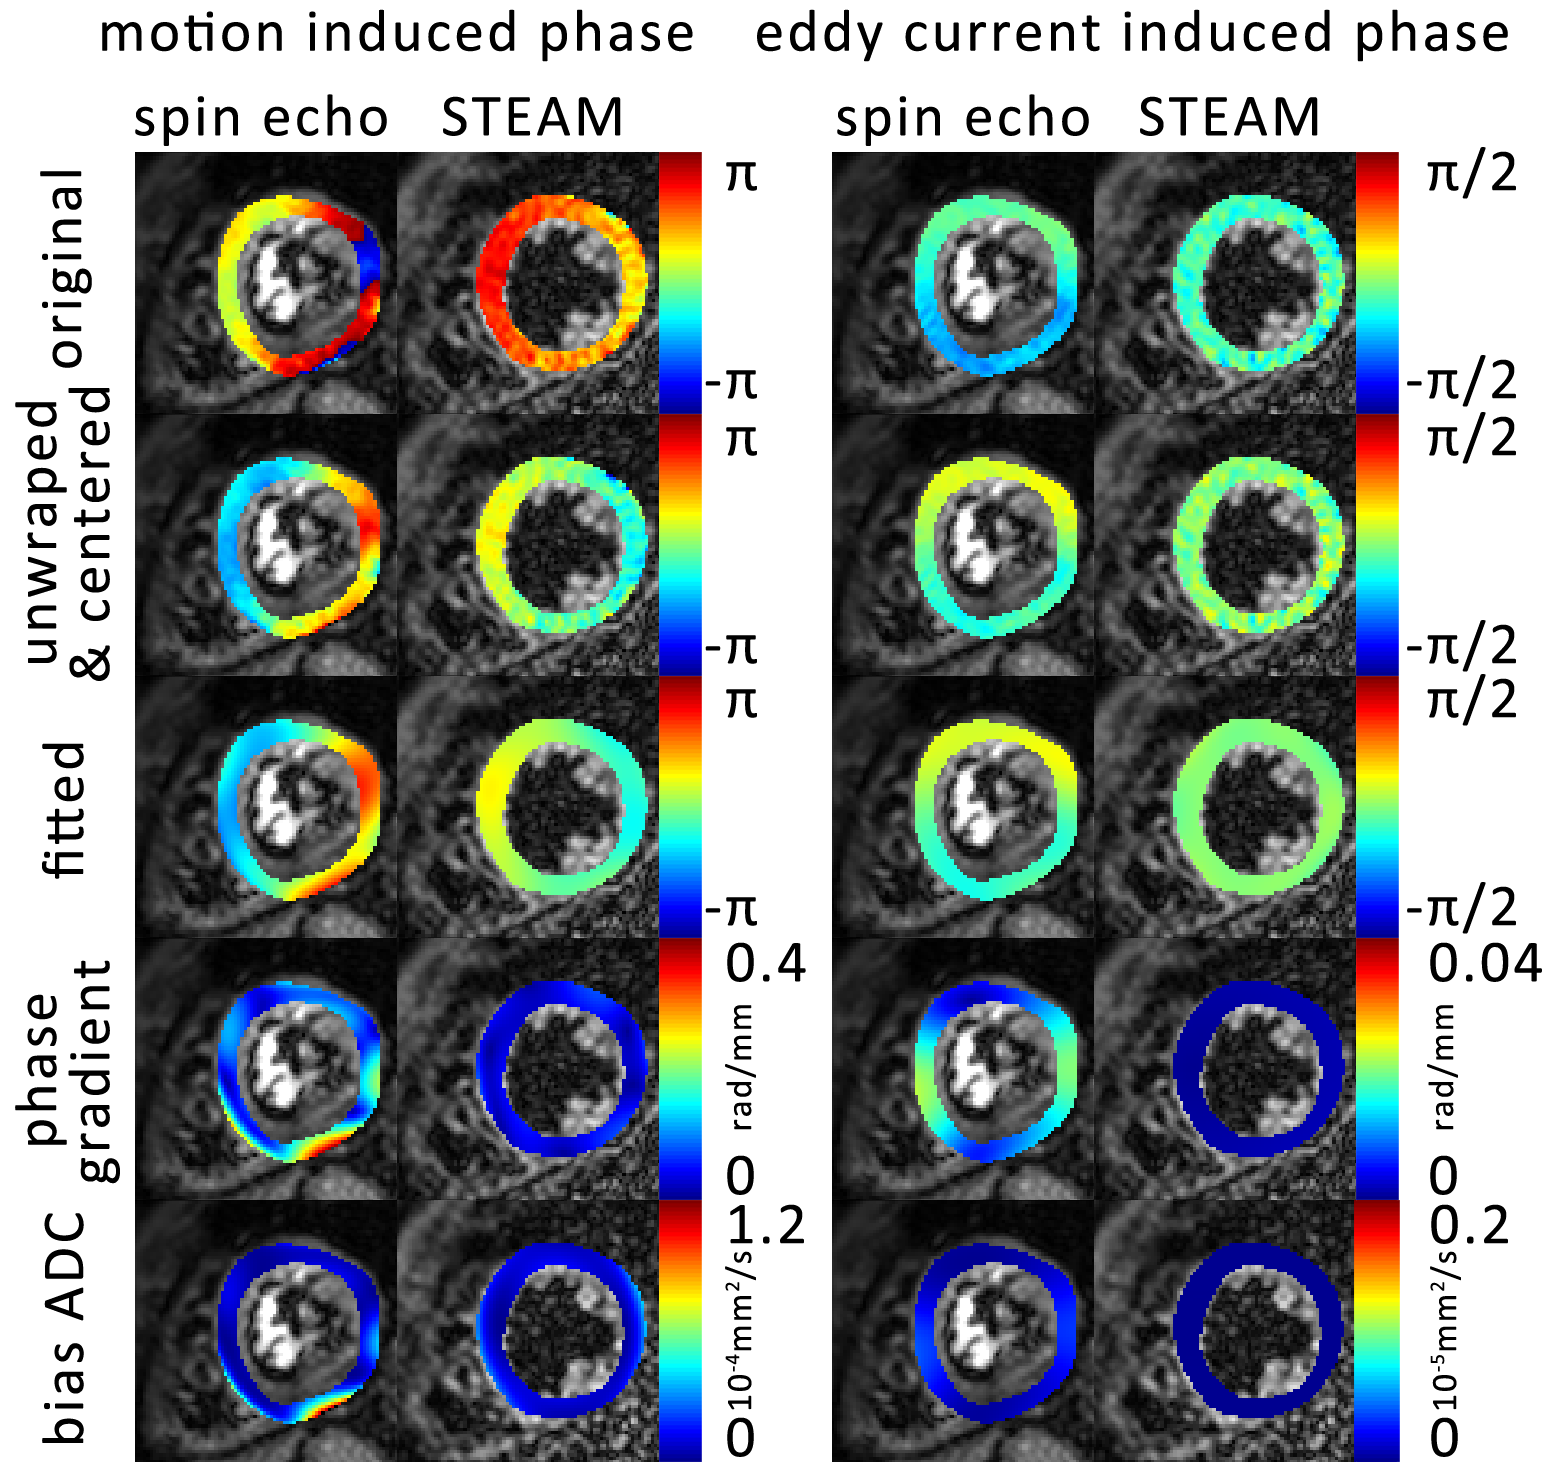
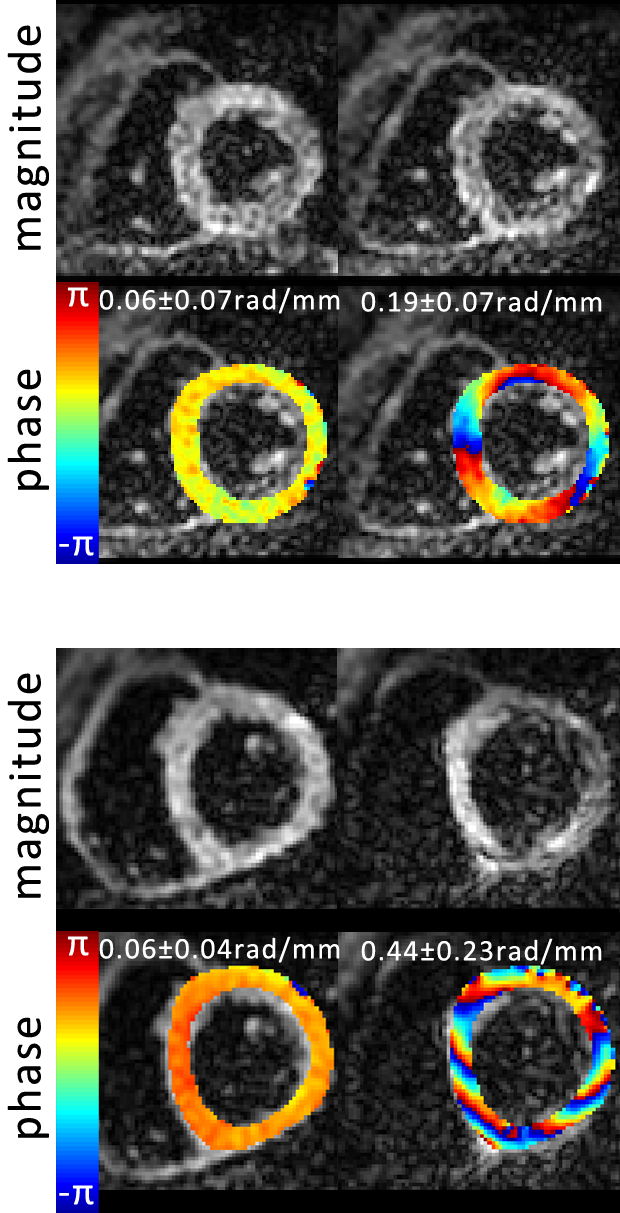
Eddy-current induced phases were estimated by complex division of the diffusion-weighted phantom data by the corresponding unweighted complex image. Resulting eddy-current induced phase was removed from in-vivo data and diffusion weighted images were divided by the unweighted images. Upon phase unwrapping and fitting to 5th order polynomial surfaces, phase gradients were computed (Figure 2). Based on visual inspection, phase data corrupted by insufficient breath holding were discarded (STEAM only). The error in MD was calculated according to:
$$D_{apparent}=D_{true}+D_{motion}=-\frac{1}{N}\sum_{i=1}^{N}\frac{1}{b}\left(log\left(\frac{S_{i true}}{S_{0}}\right)+log\left(\alpha_{i}\right)\right)$$
with αi being the signal attenuation due to dephasing along one encoding direction: $$$\alpha_{i}=\left|sinc\left(\frac{\overrightarrow{\nabla\phi_{i}}\cdot\overrightarrow{resolution}}{2}\right)\right|$$$.
Results
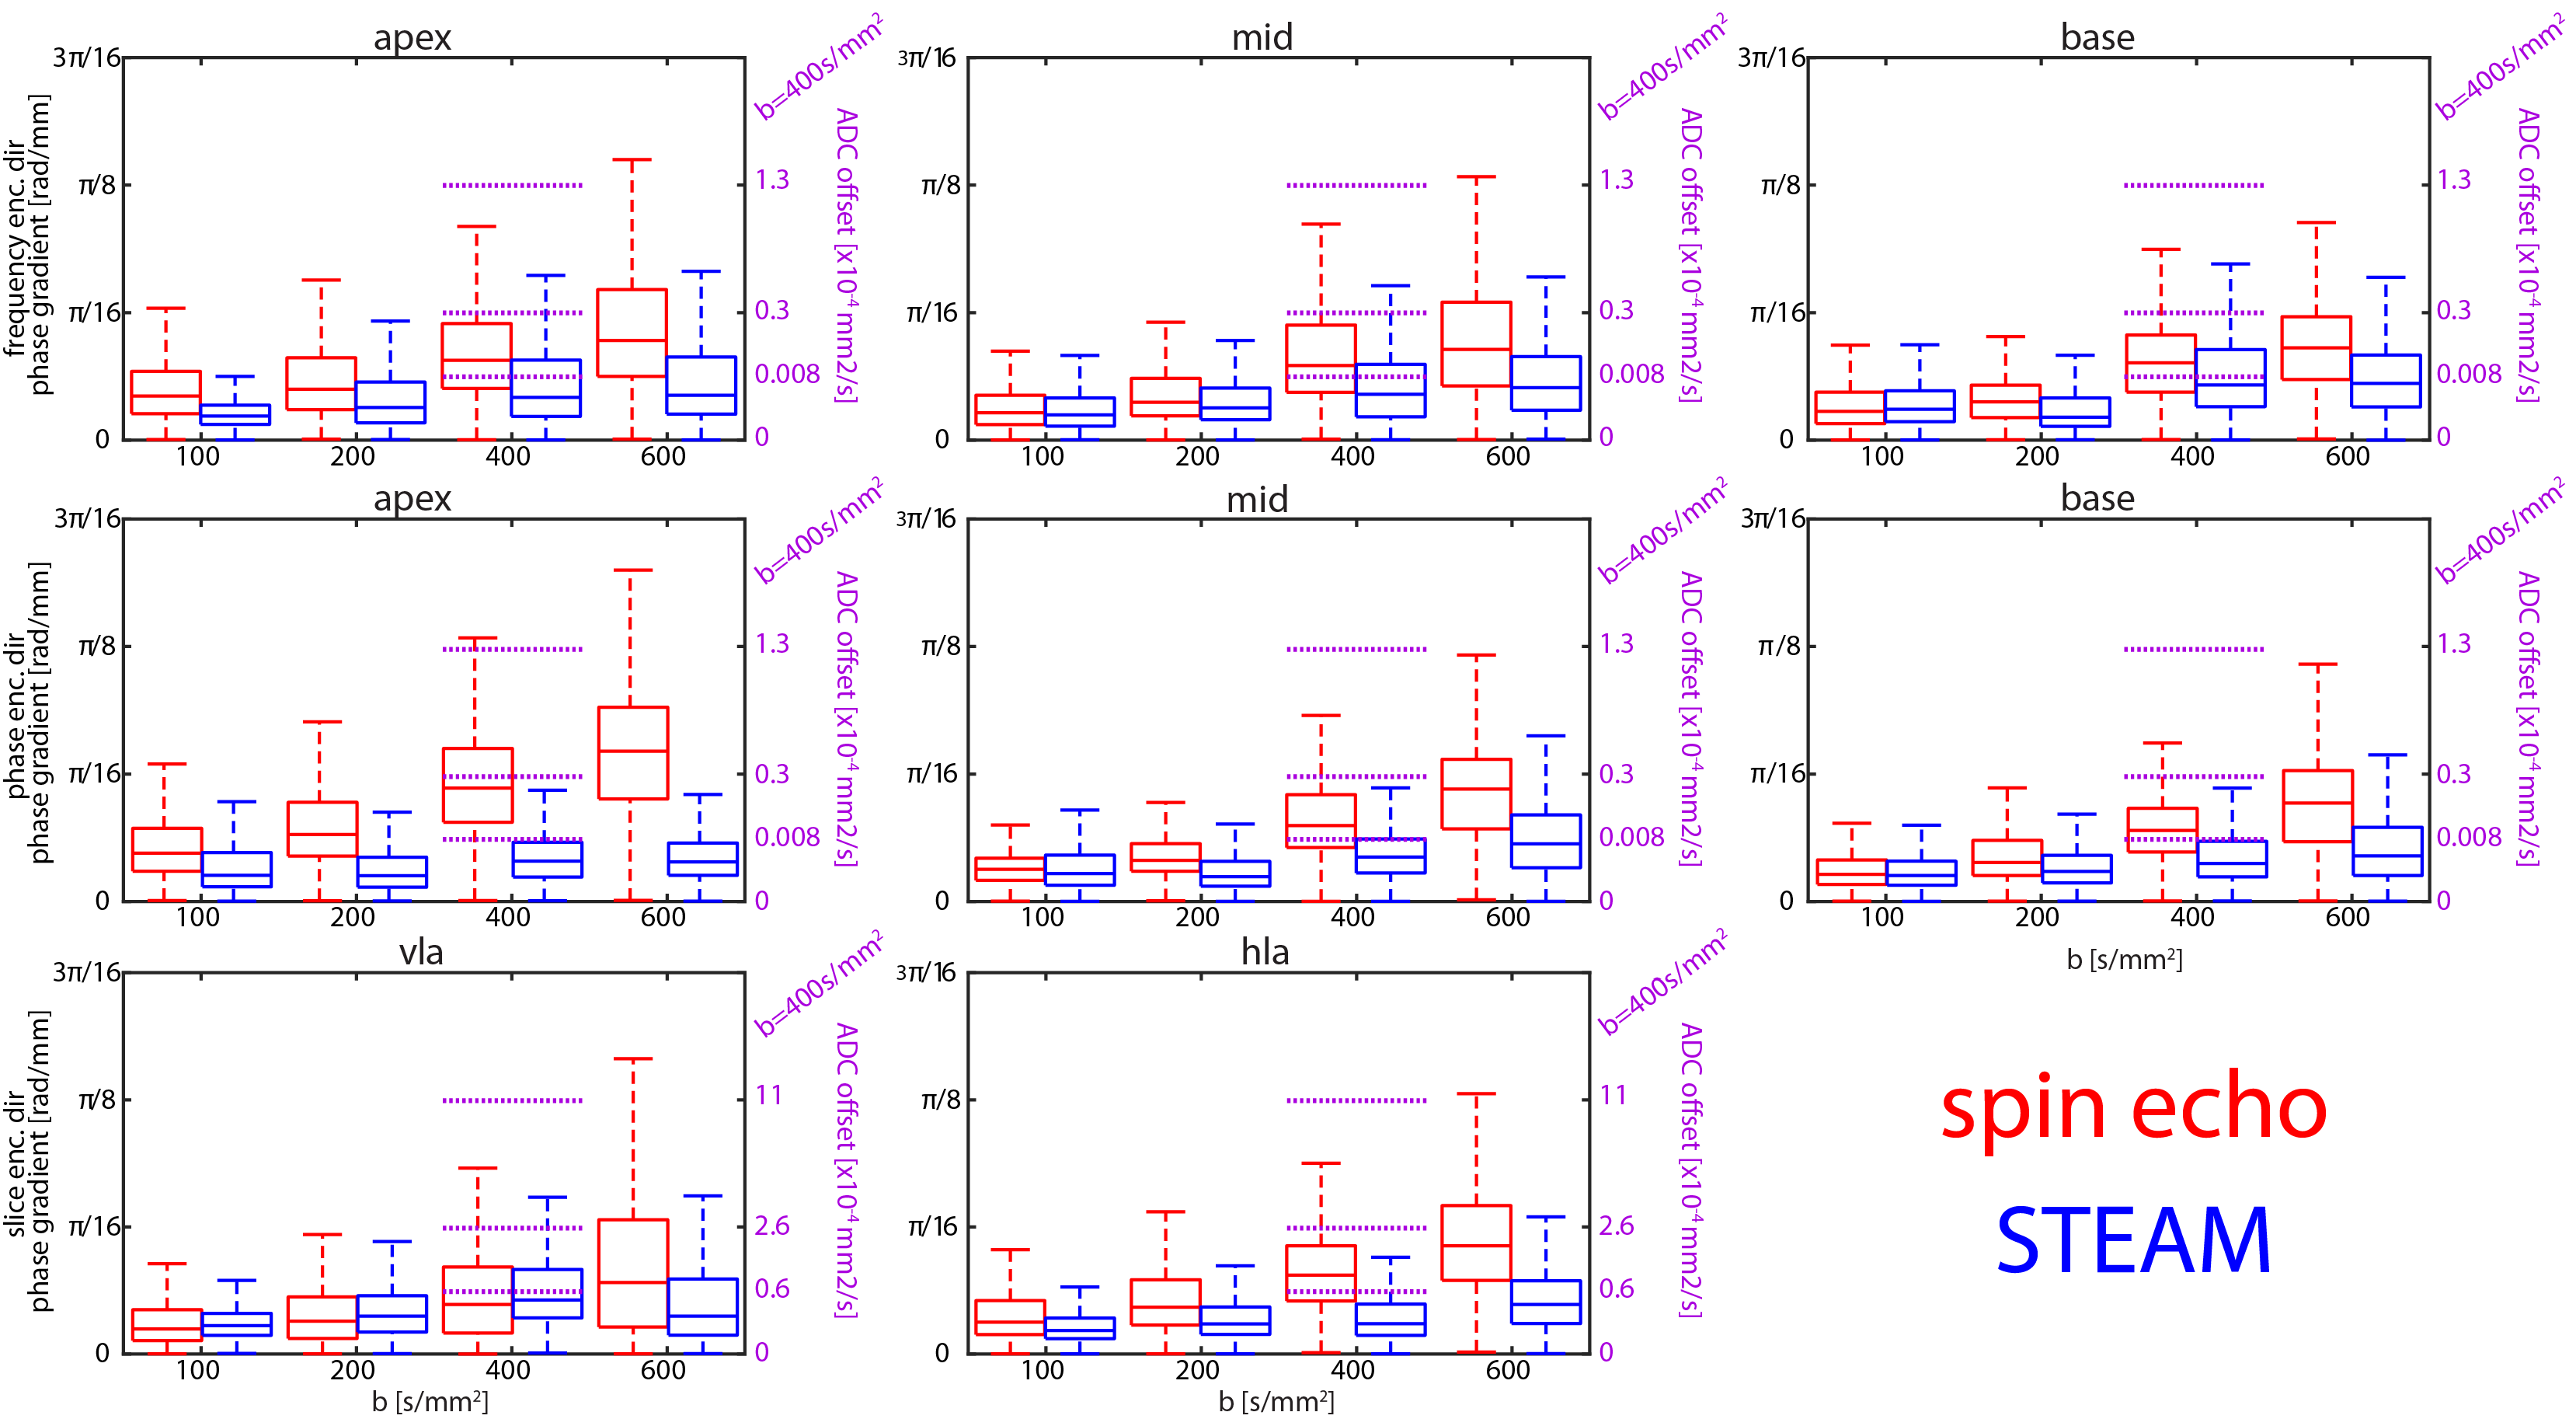
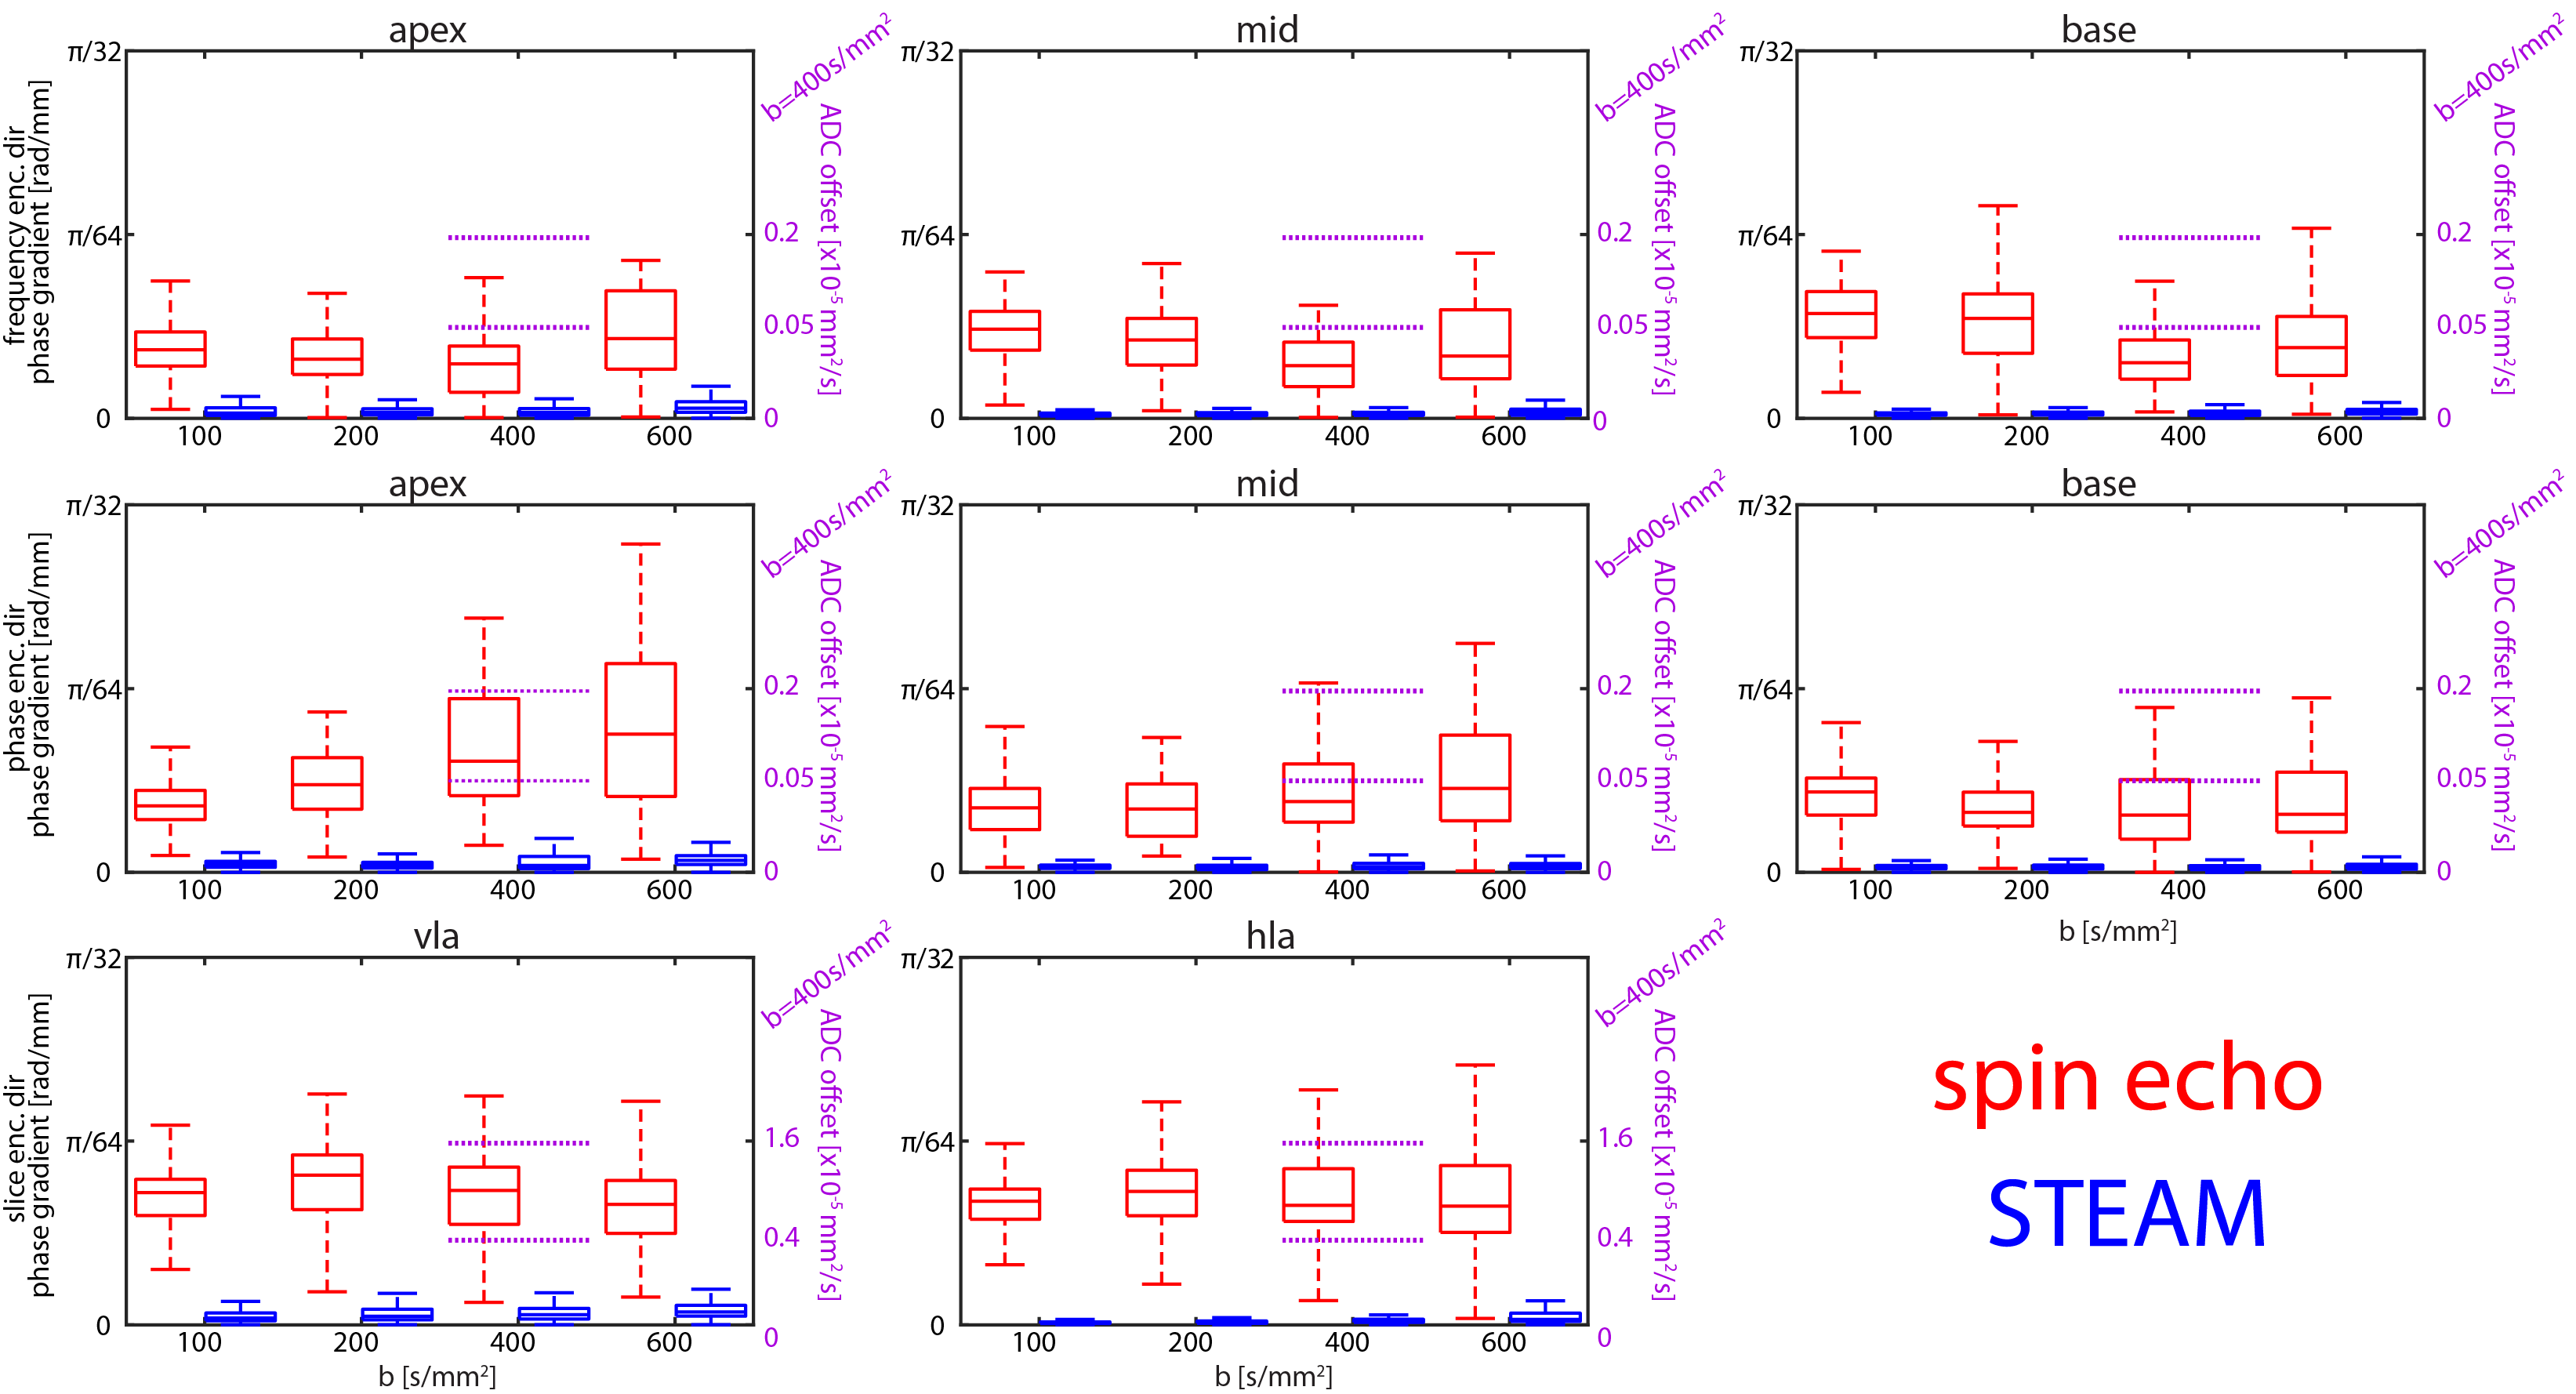
Accumulated phase due to motion/eddy-currents is more pronounced for the M2-SE case. Figure 3 compares motion-induced phase gradients for M2-SE versus STEAM. It is seen that uncompensated motion in M2-SE leads to increased phase dispersion per voxel for increasing b-values. In Figure 4 phase dispersion due to eddy-currents only are summarized. STEAM exhibits significantly reduced phase distortions relative to M2-SE. For an example resolution10 of 2.8×2.8×8mm3 an overestimation of MD due to motion of 3.9/1.4/0.3/0.2×10-4mm2/s for M2-SE vs. 0.5/0.3/0.2/0.1×10-4mm2/s for STEAM is found when averaged over the three ventricular levels (b=100,200,400 and 600s/mm2). The error in MD due to eddy-currents only is: 1.7/0.8/0.3/0.2×10-5mm2/s (SE) vs. 7.8/4.7/0.9/2.4×10-8mm2/s (STEAM). Finally, while breathing level drifts during breath holding did not pose any problem for the M2-SE sequence, significant phase gradients occurred in STEAM acquisitions (Figure 5).Discussion
At b-values commonly used for DTI, motion-induced overestimation of MD was 0.1×10⁻⁴mm2/s higher for M2-SE compared to STEAM. It is noted that with increasing b-value the error in estimated diffusivity decreases, as for the phase gradients found in this study the $$$1/b$$$ term in $$$-log\left(\alpha_{i}\right)/b$$$ dominates. Previously10 reported differences of 3.8×10⁻⁴mm2/s at a b-value of 450s/mm2 appear to be only partly explained by cardiac motion. M2-SE sequences employ strong gradients leading to significantly higher eddy-current induced bias in MD compared to STEAM. However, eddy-current induced dephasing remains one order of magnitude lower compared to motion-induced dephasing. In this study breathing motion has not been investigated and large phase gradients in STEAM images due to inconsistent breath holding have been neglected. From Figure 5 it is evident that image phase may serve as quality measure over image magnitude13, especially when envisioning free-breathing imaging.Conclusion
Phase analysis of M2-SE and STEAM sequences revealed that previously reported discrepancies in estimation of diffusivity are only marginally attributed to motion and may rather reflect different diffusional behavior at different mixing times or a potential bias due to perfusion.Acknowledgements
No acknowledgement found.References
1. Edelman R, Gaa J, Wedeen VJ, et al. In vivo measurement of water diffusion in the human heart. Magn Reson Med 1994;32:423–428.
2. Nielles-Vallespin S, Mekkaoui C, Gatehouse P, et al. In vivo diffusion tensor MRI of the human heart: Reproducibility of breath-hold and navigator-based approaches. Magn Reson Med 2013;70:454–465.
3. Stoeck CT, Kalinowska A, von Deuster C, et al. Dual-phase cardiac diffusion tensor imaging with strain correction. PLoS One 2014;9: e107159.
4. Gamper U, Boesiger P, Kozerke S. Diffusion imaging of the in vivo heart using spin echoes--considerations on bulk motion sensitivity. Magn Reson Med 2007;75:331–337.
5. Sosnovik DE, Mekkaoui C, Huang S et al. Microstructural impact of ischemia and bone marrow-derived cell therapy revealed with diffusion tensor magnetic resonance imaging tractography of the heart in vivo. Circulation 2014;129:1731-1741
6. Moulin K, Croisille P, Feiweier T et al. In vivo free-breathing DTI and IVIM of the whole human heart using a real-time slice-followed SE-EPI navigator-based sequence: A reproducibility study in healthy volunteers. Magn Reson Med 2015. 10.1002/mrm.25852.
7.Welsh C, Di Bella E, Hsu E. Higher-order motion-compensation for in vivo cardiac diffusion tensor imaging in rats. IEEE Trans Med Imaging 2015;34:1843–1853.
8. Stoeck CT, von Deuster C, Genet M, et al. Second order motion compensated spin-echo diffusion tensor imaging of the human heart. Magn Reson Med 2015. doi: 10.1002/ mrm.25784.
9. Nguyen C, Fan Z, Sharif, B et al. In vivo three-dimensional high resolution cardiac diffusion-weighted MRI: A motion compensated diffusion-prepared balanced steady-state free precession approach. Magn Reson Med 2013; doi
10.1002/mrm.25038 10. von Deuster C, Stoeck CT, Genet M, et al. Spin echo versus stimulated echo diffusion tensor imaging of the in vivo human heart. Magn Reson Med. 2015;doi: 10.1002/mrm.25998.
11. Wilm B, Gamper U, Henning A, et al. Diffusion-weighted imaging of the entire spinal cord. NMR Biomed. 2009;22(2):174-81
12. Tseng WY, Reese TG, Weisskopf RM et al. Cardiac Diffusion Tensor MRI In Vivo Without Strain Correction. MRM 1999; 42(2):393-403
13. Mekkaoui C, Reese TG, Jackowski MP et al. Accelerated free-breathing diffusion tensor MRI of the entire human heart using spatiotemporal registration and retrospective image selection. JCMR 2016 18(Suppl 1):O52
Figures