0925
Feature tracking myocardial strain analysis in acute myocarditis: Diagnostic value and association with myocardial inflammation and edema1Radiology, University of Bonn, Bonn, Germany
Synopsis
Cardiac magnetic resonance (CMR) can detect inflammatory myocardial alterations in patients with acute myocarditis. The addition of myocardial strain analysis might further broaden the diagnostic targets of CMR. We investigated myocarditis patients using multiparametric CMR including a feature-tracking analysis of myocardial strain parameters. We could demonstrate that myocardial strain measurements can reliable discriminate between diseased and healthy patients. Furthermore, strain measurements are associated with the extent of myocardial edema/inflammation. These findings indicate that CMR feature-tracking strain analysis adds important diagnostic information, and might serve as a new tool for the assessment of myocardial dysfunction in patients with acute myocarditis.
Introduction
Myocarditis is an important cause of cardiac morbidity and mortality, accounting for up to 20% of sudden unexpected deaths in young adults. 1 In these patients, cardiac magnetic resonance (CMR) can reliably characterize acute inflammatory myocardial alterations by the use of a combination of imaging sequences that can detect edema, hyperemia and necrosis. 2, 3 The addition of functional markers such as myocardial strain analyses might increase the diagnostic value of CMR and further broaden its diagnostic targets. 4 In this prospective study, a comprehensive CMR examination with the addition of myocardial strain analysis was performed in patients suspected of having acute myocarditis. The purpose of our study was to investigate: (1) whether feature tracking derived strain parameters can differentiate between patients with acute myocarditis and control subjects, (2) to which degree myocardial strain parameters correlate with other markers of myocardial inflammation (e.g. T1 and T2 relaxation times), and (3) which myocardial strain parameters offer the best diagnostic performance in patients suspected of having myocarditis.Methods
The institutional review board approved this prospective study and all subjects gave written informed consent. The study population consisted of patients with clinically defined acute myocarditis and control subjects. All scans were performed on a 1.5 Tesla CMR system. CMR scans allowed for assessment of cardiac function (including global peak systolic longitudinal, circumferential and radial strain values), myocardial edema (T2 signal intensity ratio (T2-ratio), T1 and T2 relaxation times), hyperemia (early gadolinium enhancement ratio (EGEr)) and myocardial necrosis (late gadolinium enhancement (LGE)). For functional analysis ECG-gated steady-state free precession cine images were obtained. Strain measurements were obtained using the feature tracking technique. 4 T1 Maps were acquired before and 10 minutes after contrast administration. The extracellular volume (ECV) was calculated from pre- and post-contrast T1 relaxation times. Correlation analysis was performed using Spearman’s rank correlation coefficient. The diagnostic performance of strain parameters was analyzed by plotting receiver operation characteristics (ROCs) and comparing the area under the ROCs. The level of statistical significance was set to P<0.05.Results
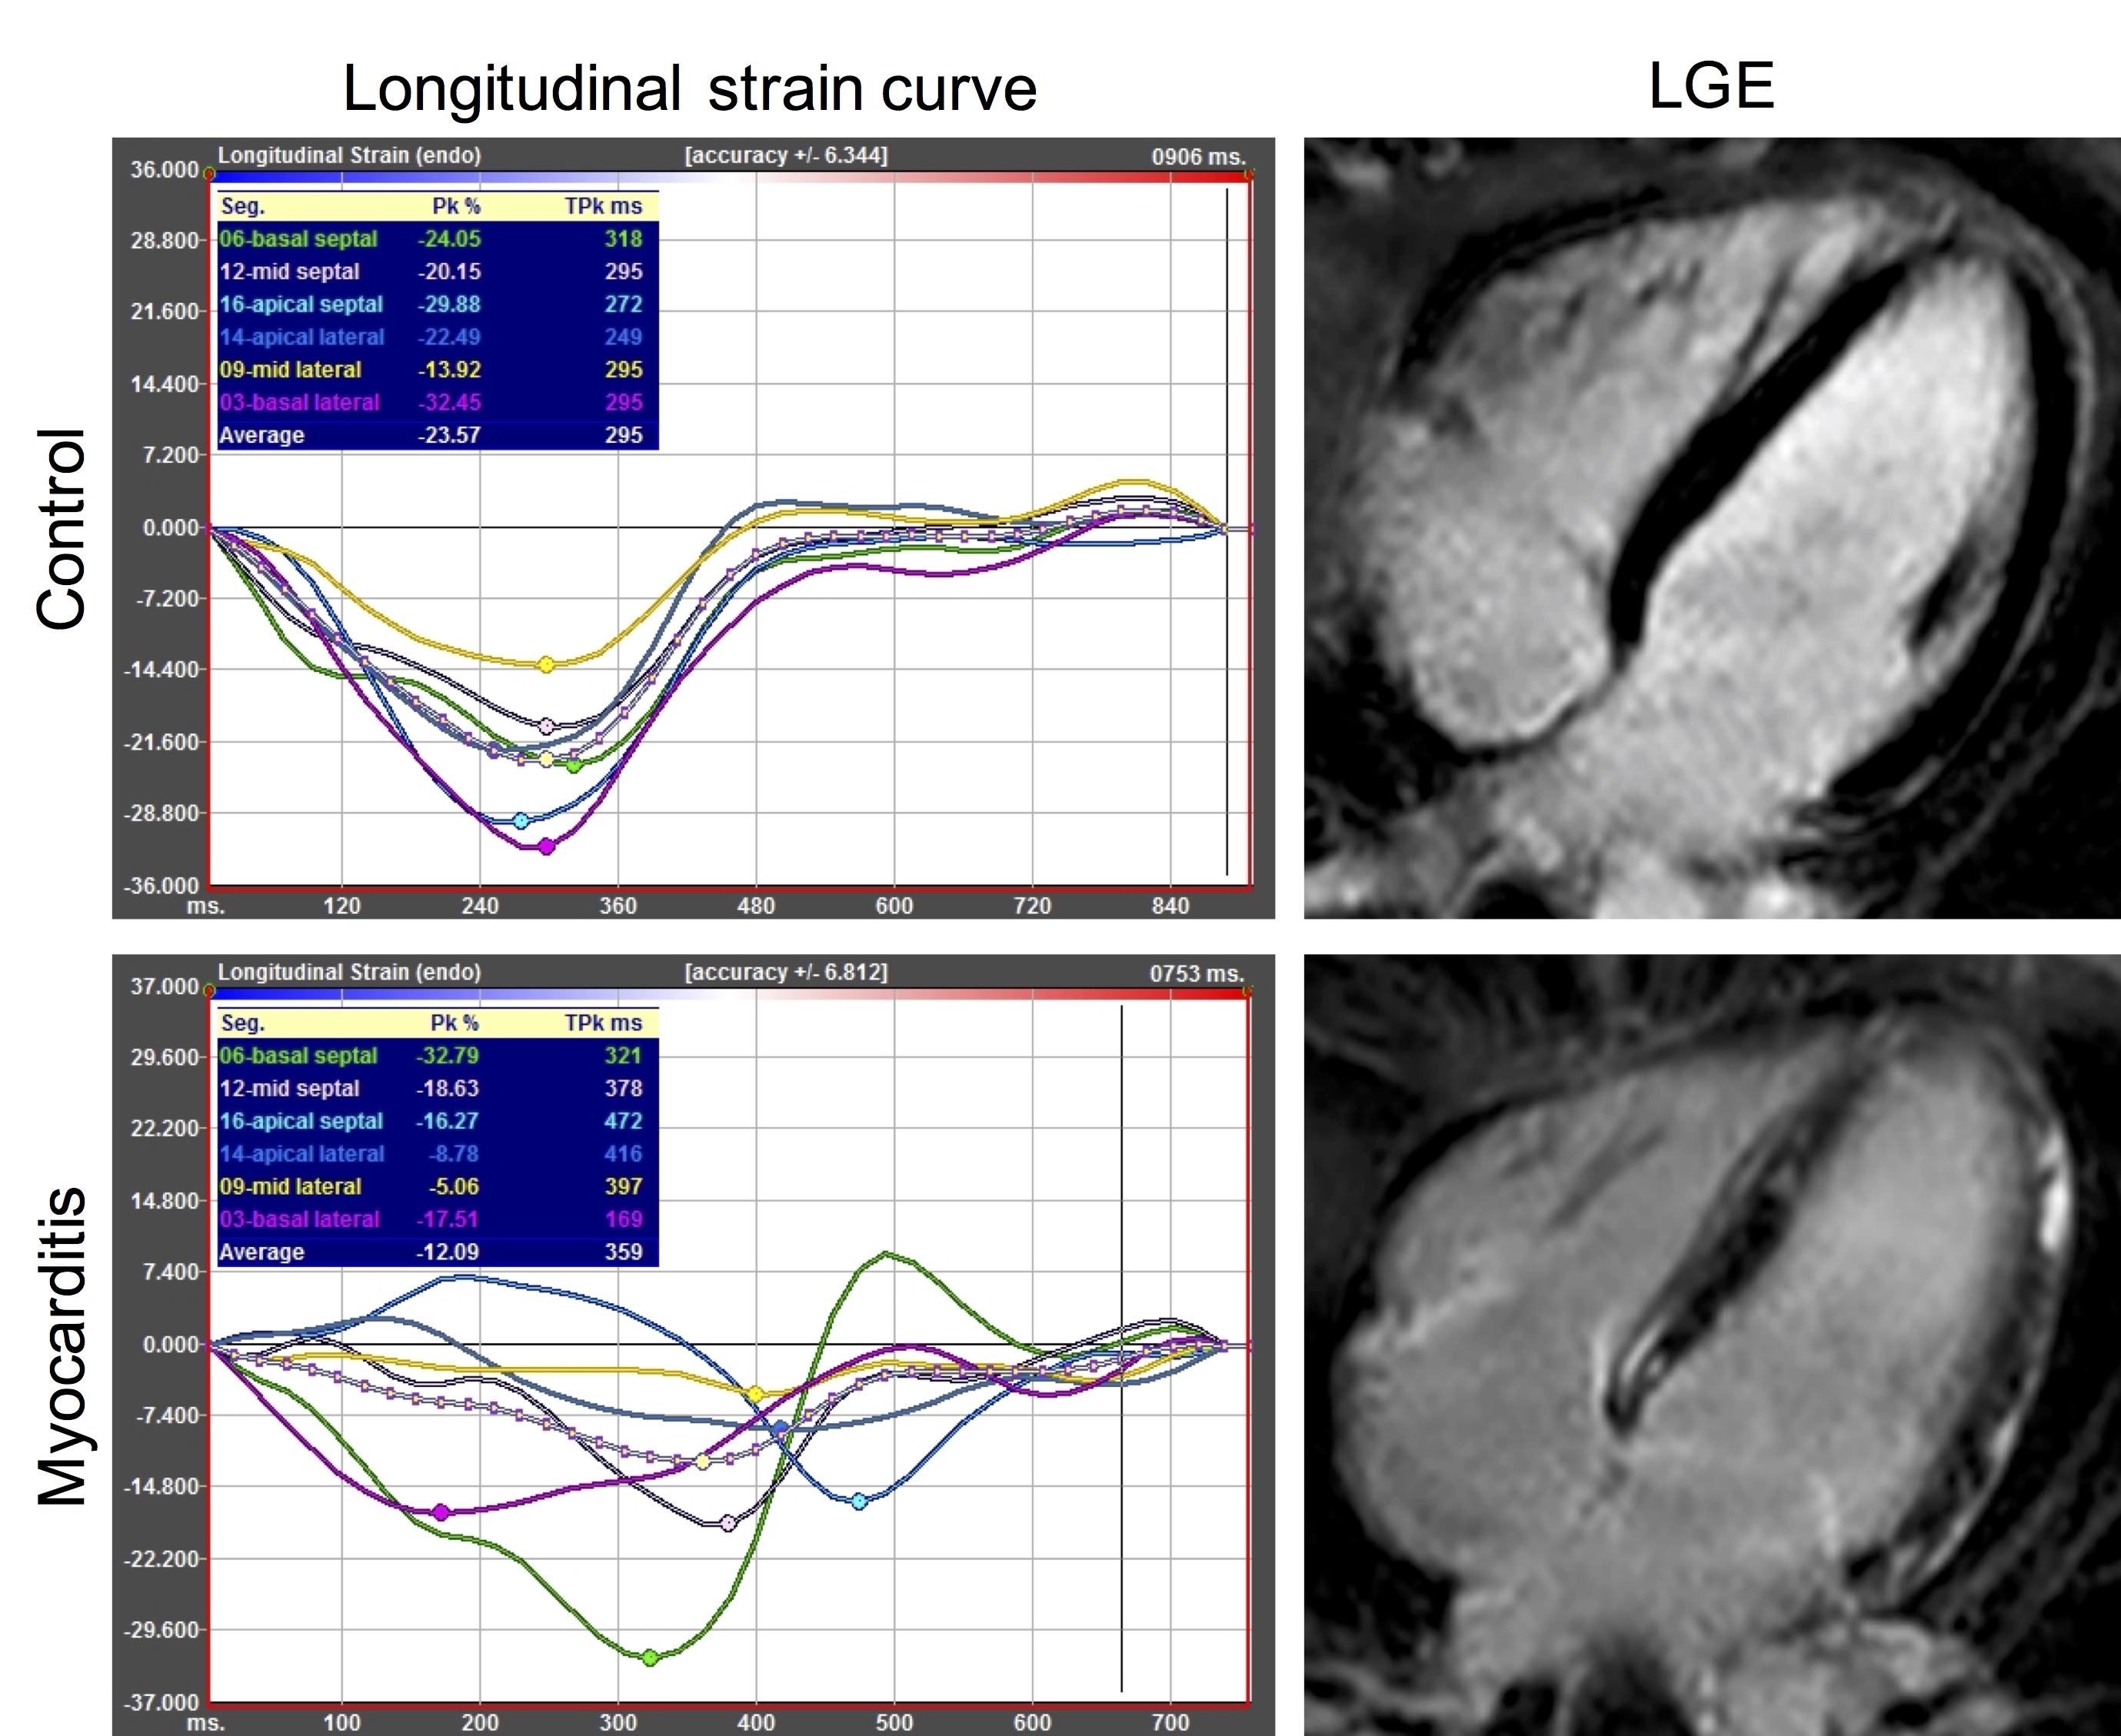
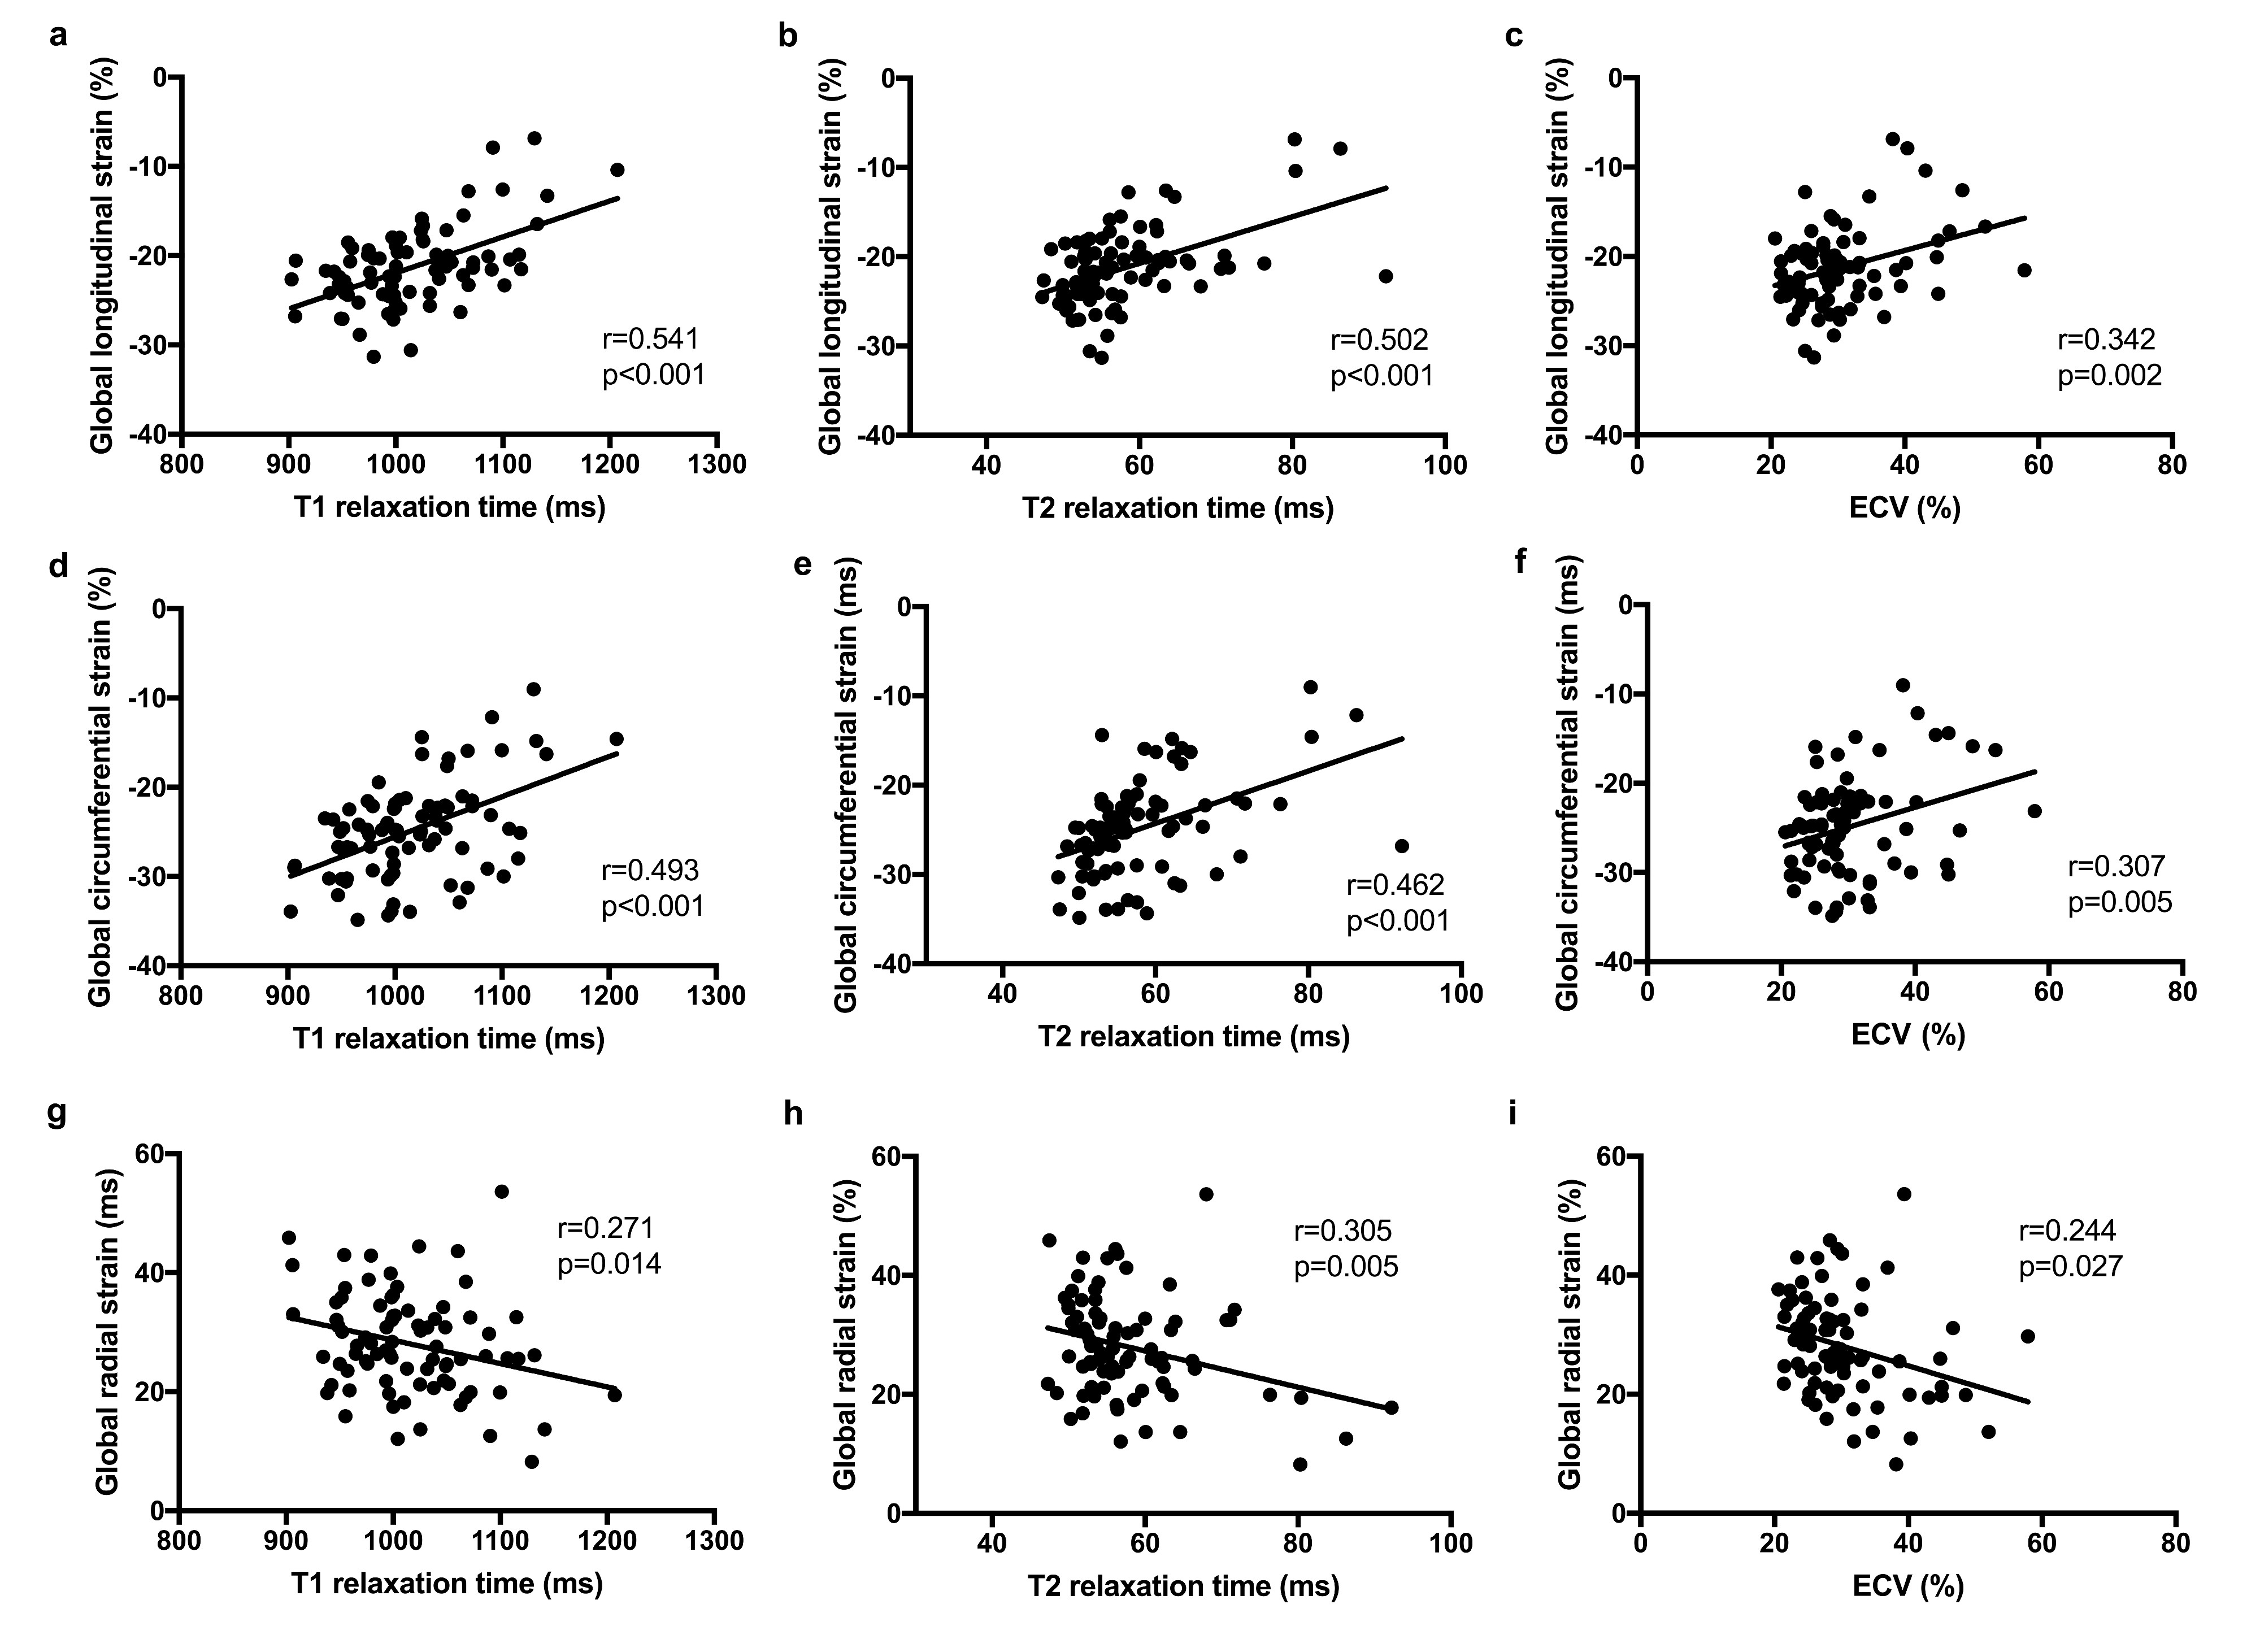
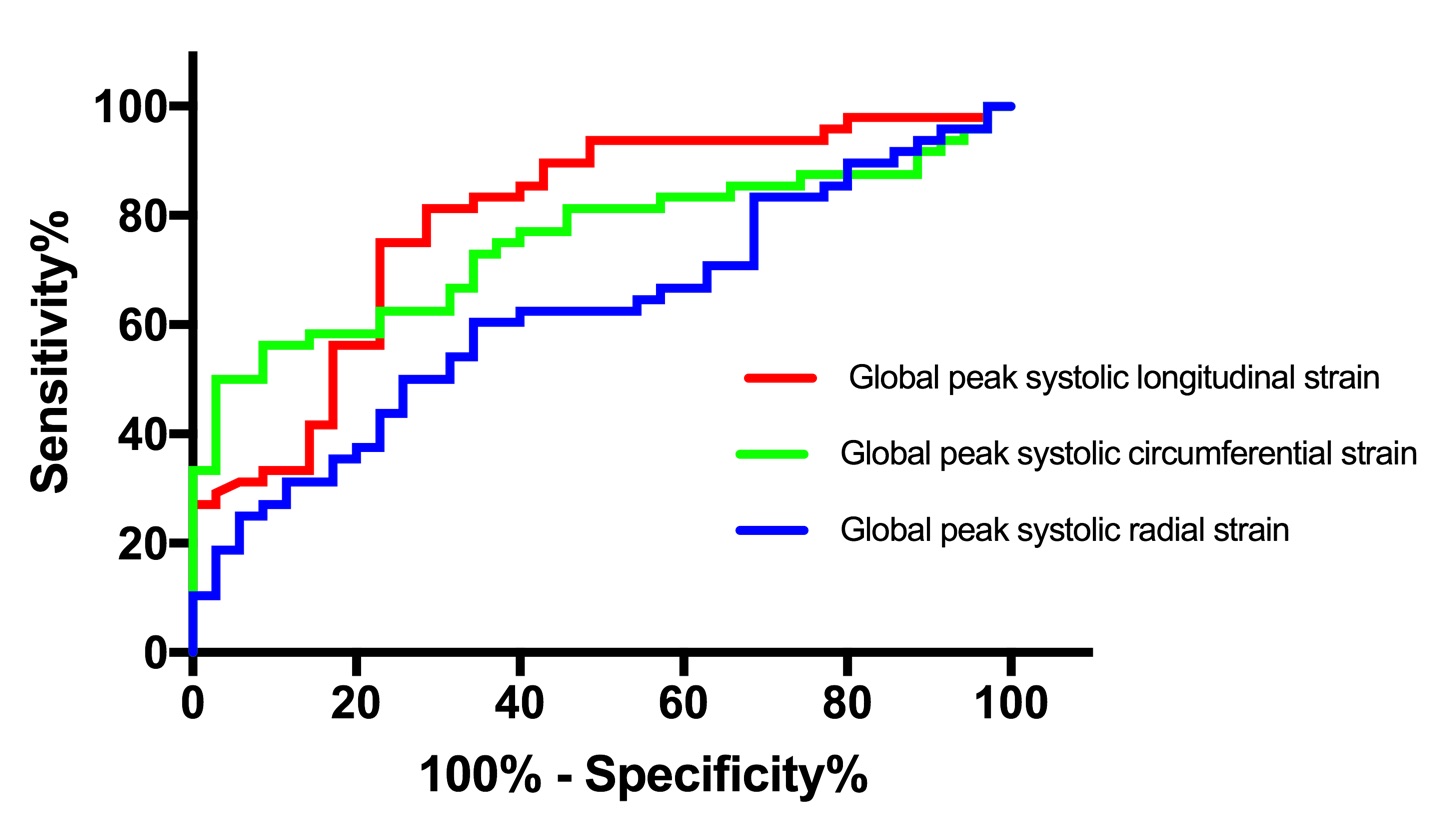
48 patients with acute myocarditis and 35 control subjects were included in this study. Mean time from admission to CMR was 2.7±1.9 days. All CMR parameters indicating inflammatory alterations of the myocardium were significantly elevated in the myocarditis group compared to the control group: T2-ratio (1.8±0.4 vs.1.6±0.3, P=0.001), EGEr (3.9±2.8 vs. 1.9±1.4, P<0.001), native T1 relaxation time (1050.8±49.1ms vs. 966.7±30.6ms, P<0.001), T2 relaxation time (62.2±8.8ms vs. 52.3±2.5ms, P<0.001), and ECV (32.9±8.0% vs. 26.7±4.8%, P<0.001). Global peak systolic longitudinal (-19.5±4.4% vs. -23.6±3.1%, P<0.001), circumferential (-23.0±5.8% vs.-27.4±3.4%, P<0.001), and radial (29.0±8.5% vs. 32.4±7.4%; P=0.049) strain values were significantly reduced in the myocarditis group compared to the control group (see Figure 1). Global peak systolic longitudinal strain was the only strain parameter, which showed a significant correlation with all other continuous CMR parameters of myocardial inflammation/edema (T2-ratio: r=0.238, P=0.030; EGEr: r=0.296, P=0.008, native T1 relaxation time: r=0.462, P<0.001; ECV: r=0.258, P=0.019, T2 relaxation time: r=0.436, P<0.001). Global peak circumferential strain showed moderate correlations with T1 (r=0.429, P<0.001) and T2 relaxation times (r=0.467, P<0.001), whereas the correlations between global peak radial strain and T1 (r=-0.226, P=0.041) and T2 (r=-0.229, P=0.038) relaxation times were only weak (see Figure 2). Global peak systolic longitudinal and circumferential strain showed a good diagnostic performance with AUC values of 0.79 (longitudinal strain) and 0.75 (circumferential strain). Both parameters had significantly higher AUC values compared to global peak systolic radial strain (0.62) (P<0.05, respectively) (see 3 Figure).Discussion
The main findings of our study are that (1) myocardial strain parameters were significantly reduced in patients with acute myocarditis compared to control subjects, (2) global peak longitudinal and circumferential strain were the only strain parameters to be closely correlated with other CMR parameters of myocardial inflammation (e.g. myocardial T1 and T2 relaxation times), and (3) global peak longitudinal and circumferential strain provided the best diagnostic performance of all strain parameters evaluated.Conclusion
In patients suspected of having acute myocarditis, feature tracking derived myocardial strain measurements allowed for a reliable discrimination between diseased and healthy patients. Especially, global peak systolic and longitudinal strain showed good diagnostic accuracies in confirming the presence of acute myocarditis. Both parameters were most closely correlated with CMR measures of myocardial edema. Global peak systolic and longitudinal strain may serve as novel parameters in detecting global and regional myocardial dysfunction in patients suspected of having acute myocarditis and therefore further broaden the diagnostic targets of CMR.Acknowledgements
The authors declare that they have no conflict of interest.References
1. Drory Y, Turetz Y, Hiss Y, et al. Sudden unexpected death in persons less than 40 years of age. Am J Cardiol. 1991;68:1388-92.
2. Luetkens JA, Doerner J, Thomas DK, et al. Acute Myocarditis: Multiparametric Cardiac MR Imaging. Radiology. 2014;273:383-92.
3. Luetkens JA, Homsi R, Sprinkart AM, et al. Incremental value of quantitative CMR including parametric mapping for the diagnosis of acute myocarditis. Eur Heart J Cardiovasc Imaging. 2016;17:154-61.
4. Kuetting D, Sprinkart AM, Doerner J, et al. Comparison of magnetic resonance feature tracking with harmonic phase imaging analysis (CSPAMM) for assessment of global and regional diastolic function. Eur J Radiol. 2015;84:100-7.
Figures