0923
CMR Demonstrates Structure-Function Relationship in Patients after Heart Transplantation1Radiology, Northwestern University, Chicago, IL, United States, 2Cardiology, Northwestern University, Chicago, IL, United States
Synopsis
Cardiac MRI demonstrates differences between heart transplant recipients and controls using tissue phase mapping (TPM), T2, and T1. Significant correlations between myocardial velocities and dyssynchrony obtained from TPM (myocardial function) and T2 and T1 (myocardial tissue structure) suggest a relationship between impaired structure and function among transplant recipients.
Introduction
Following heart transplantation (Tx), recipients are monitored with frequent endomyocardial biopsies (EMB), echocardiograms, and office visits to detect histopathologic, functional, or symptomatic evidence of common causes of mortality [1], but each of these modalities has limitations. The current gold standard screening tool for ACAR is EMB, but it is invasive and has limited sensitivity due to sampling error [2]. Cardiac magnetic resonance imaging (CMR) has shown promise as an alternative imaging modality due to its capacity to quantify regional changes in left ventricular (LV) tissue morphology and function. The goal of this study was to apply three complementary CMR techniques for the assessment of relationships between altered myocardial tissue structure and function: tissue phase mapping (TPM) for measurement of regional LV velocities [3,4], pre- and post-Gd T1-mapping for assessment of fibrosis by extracellular volume fraction (ECV) [5], and T2-mapping for myocardial edema quantification [4,6,7]. Our hypotheses were that 1) TPM can detect changes in myocardial function compared to controls, 2) T2-mapping, T1-mapping, and ECV fraction can detect changes in myocardial structure compared to controls, and 3) LV structural abnormalities are associated with impaired LV function.Methods
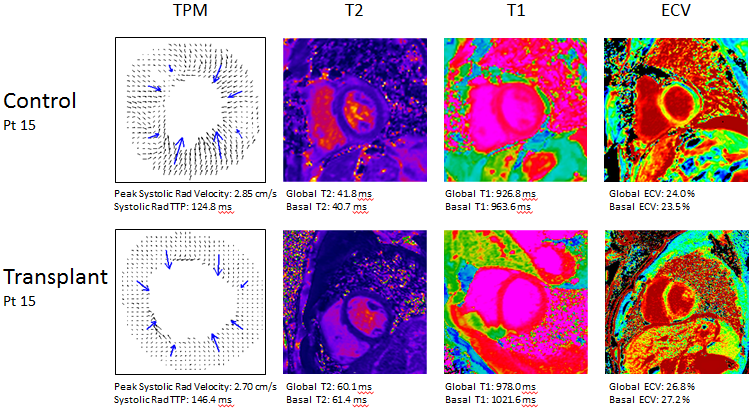
Seventy Tx recipients (age 50.6±17.2 years, female 43%) were prospectively recruited for 98 total scans (6.4±6.2 years post Tx, 23% within 1yr post Tx) from 2014-2016. Eighteen age-matched healthy controls (age 50.1±16.1 years, female 33%) were also recruited, and a scan from each was included in the study (TPM was only included in 10 controls). All patients underwent CMR at 1.5T (Magnetom Aera or Avanto, Siemens, Erlangen, Germany). Measures of LV systolic function (EDV, ESV, SV, HR, CO, EF, end diastolic myocardial mass) were calculated from a stack of 2D cine SSFP images of the LV using dedicated software (cvi42, v 5.3.6, Circle, Calgary, Canada). In addition, T2-mapping, as well as native and post-Gd T1-mapping (to generate ECV using hematocrit drawn at the time of CMR) were performed in short axis orientation at the LV base, mid, and apex. Finally, TPM data acquisition used a black-blood cine 2D phase-contrast sequence with tri-directional velocity encoding for the LV base, mid, and apex (venc=25 cm/s, temporal resolution=24 ms, spatial resolution=2.0x2.0 mm²). Data analysis included the calculation of T2, native T1, and ECV maps and LV segmentation to quantify global and regional T2, T1, and ECV (cvi42, v5.3.6, Circle, Calgary, Canada). TPM analysis included semi-automated identification of endo-and epi-cardial LV contours throughout the cardiac cycle and calculation of radial and longitudinal LV peak velocities and time to peak velocity (TTP) using an in-house tool (Matlab, Mathworks, Natick, MA). Dyssynchrony was calculated using the standard deviation of TTP in radial and longitudinal directions.Results
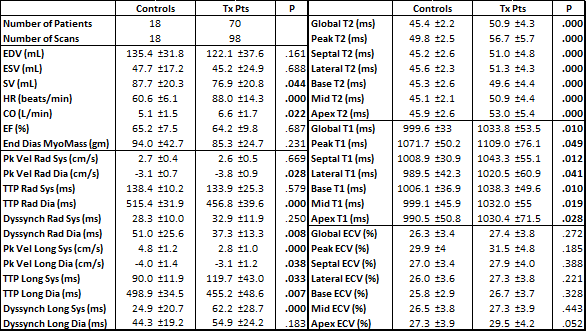
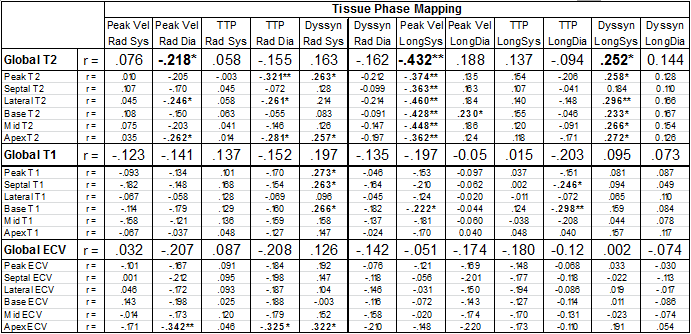
Comparisons between Tx recipients and controls are shown in Table 1. Tx recipients had nearly 50% higher heart rates compared to controls (p<0.001), an expected result of cardiac denervation during Tx. Tx recipient SVs were lower than in controls (p=0.044), but CO was increased (p=0.022). TPM results showed equivalent or better LV function in the radial direction, but significantly worse function longitudinally: peak longitudinal velocity was significantly decreased compared to controls during both systole and diastole (p<0.001, p=0.038), and systolic longitudinal dyssynchrony was also significantly increased (p<0.001). All T2 parameters (global, peak, septal, lateral, 3 slices) were significantly elevated in Tx recipients compared to controls (all p<0.001), indicating increased levels of edema in Tx patients. All native T1 parameters (global, peak, septal, lateral, 3 slices) were significantly increased as well (p=0.010 to 0.049), but there were no differences in ECV. Correlation analysis results between TPM and T2, T1, and ECV are summarized in Table 2. A significant inverse relationship was found between all T2 parameters and peak systolic longitudinal velocity (global r=-0.43, p<0.001). T2 also correlated with systolic longitudinal dyssynchrony (r=0.25, p=0.021). Peak, septal, and basal T1 were associated with systolic radial dyssynchrony (r=0.27, p=0.012; r=0.26, p=0.015; r=0.27, p=0.014).Conclusion
Despite similar normal global LV function, TPM, T2-mapping, and T1-mapping each showed differences between control and Tx hearts. TPM showed lower longitudinal velocities and more dyssynchrony among Tx patients, but no impairment radially. Significantly higher T2 in Tx patients indicates more edema and inflammation in transplanted hearts at baseline, and higher T1 in Tx patients suggests diffuse fibrotic interstitial disease in these hearts. Correlations between T2 and TPM, as well as T1 and TPM, provide evidence of a relationship between impaired structure and function following Tx.Acknowledgements
Grant support by NHLBI R01 HL117888.References
1. Costanzo MR, et al. The International Society of Heart and Lung Transplantation guidelines for the care of heart transplant recipients. J Heart Lung Transplant 2010; 29:914-956.
2. Fishbein MC, Kobashigawa J. Biopsy-negative cardiac transplant rejection: Etiology, diagnosis, and therapy. Curr Opin Cardiol. 2004; 19:166-169.
3. Foll D, et al. Magnetic resonance tissue phase mapping of myocardial motion: New insight in age and gender. Circ Cardiovasc Imaging 2010; 3:54-64.
4. Markl M, et al. Myocardial T2-mapping and velocity mapping: Changes in regional left ventricular structure and function after heart transplantation. Magn Reson Med. 2012, published online.
5. Lee JJ, et al. Myocardial T1 and extracellular volume fraction mapping at 3 Tesla. J Cardiovasc Magn Reson. 2011; 13:75.
6. Giri S, et al. T2 quantification for improved detection of myocardial edema. J Cardiovasc Magn Reson. 2009; 11:56.
7. Usman AA, et al. Cardiac magnetic resonance T2 mapping in the monitoring and followup of acute cardiac transplant rejection: A pilot study. Circ Cardiovasc Imaging 2012; 5:782-790.
Figures