0922
Quantification of Increased Myocardial Stiffness in Patients with Hypertrophic Cardiomyopathy Using 3D High Frequency Cardiac Magnetic Resonance Elastography1Radiology, Mayo Clinic, ROCHESTER, MN, United States, 2Cardiovascular Diseases, Mayo Clinic, ROCHESTER, MN, United States, 3Biomedical Engineering and Physiology, Mayo Clinic, ROCHESTER, MN, United States
Synopsis
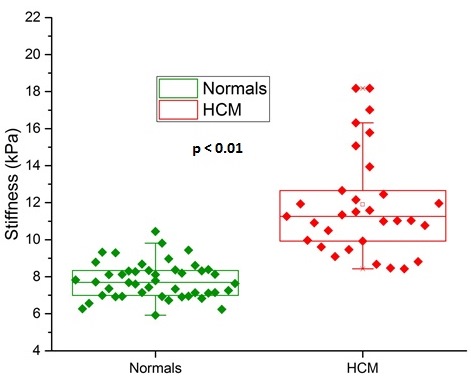
Abnormal thickening of myocardium in patients with hypertrophic cardiomyopathy impairs the pump function, and in particular affects diastolic filling with a known increase in myocardial stiffness. The purpose of this work was to determine if 3D high frequency cardiac MR elastography (MRE) can quantitatively differentiate increased myocardial stiffness in HCM patients compared to healthy volunteers. 36 patients with clinical diagnosis for hypertrophic cardiomyopathy (HCM) and 47 healthy volunteers were studied. The myocardial stiffness of HCM patients (mean: 12.01 kPa) was found to be significantly stiffer (p < 0.01) than healthy controls (mean: 7.79 kPa).
Purpose
Hypertrophic Cardiomyopathy (HCM) is a common genetic cardiovascular disease that occur 1 in 500 births (1). HCM is the most frequent cause of sudden death in young people and some trained athletes, and can lead to functional disability from heart failure and stroke. However many cases remain undiagnosed without affecting life expectancy (2). HCM can cause dyspnea, syncope or even sudden cardiac death, which is believed to be due to the increased myocardial stiffness of the left ventricle (LV), which impairs ventricular filling resulting in elevated pressures in the left atrium and left ventricle (3). In-vivo measurement of myocardial stiffness in these patients could provide additional information for clinical management of these patients. Magnetic Resonance Elastography (MRE) is a non-invasive phase contrast based imaging technique that can measure tissue stiffness in-vivo (4). Stiffness measurements using 3D MRE are becoming increasingly common and our recent work demonstrated a high level of agreement with dynamic material testing (intra-class correlation coefficient up to 0.99) (5). 3D high frequency cardiac MRE technique at 140 Hz was recently shown to be feasible in normal volunteers to measure in-vivo myocardial stiffness (6). The purpose of this work was to determine if 3D high frequency cardiac MRE can quantitatively differentiate increased myocardial stiffness in HCM patients compared to healthy volunteers.Methods
Forty-seven healthy volunteers (Male = 20; Female = 27) between ages 18-35 were enrolled for cardiac MRE with institutional review board (IRB) approval and informed consent was obtained from all the participants. Cardiac MRE exams from 36 patients with clinical diagnosis for HCM were retrospectively obtained with IRB approval that underwent clinical cardiac MRI between July1– Oct 15 2016. Cardiac MRE was performed on these patients at 140 Hz vibration frequency as previously described (6). A “no-motion” scan with the vibration amplitude set to zero was also included in the MRE exam in order to establish a baseline reference for noise to differentiate scans with motion. Octahedral shear strain signal to noise ratio (OSS-SNR) was calculated as a measure to assess shear wave quality (7) . A noise threshold was established at two standard deviations above the mean OSS-SNR of all no-motion scans across all participants. MRE exams with mean OSS-SNR at or above this threshold in the included myocardial volume are considered successful and were included for analysis. The left ventricle (LV) was segmented using Cir 42 clinical software (Cardiovascular Imaging, Calgary, Alberta) to quantify left ventricular myocardial stiffness. MRE stiffness was obtained by applying the curl to the 3D displacement field and performing 3D Local Frequency Estimation (LFE) (8). MRE shear stiffness is reported as the mean stiffness in the segmented LV volume. OriginPro 2016 software (OriginLab Corporation, Northampton, MA) was used for statistical analysis and plotting. The Mann-Whitney U test of significance was used in this study, considering a p-value of less than 0.01 as statistically significant.Results
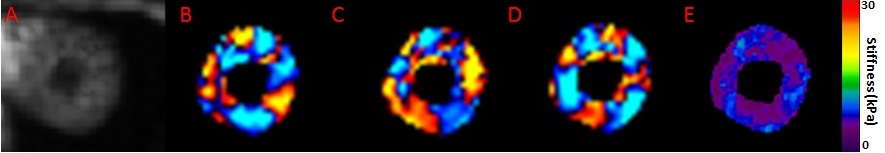
A threshold OSS-SNR value of 1.21 (two standard deviations above the mean of 0.91) was used as a shear wave quality factor to discriminate noisy MRE exams. MRE exams of 5 HCM patients and 1 normal volunteer had a mean OSS-SNR below this threshold and therefore were excluded from analysis in this study. Figure 1 shows the MRE images from a 26 year old female healthy volunteer; (A) shows the magnitude image, (B), (C), (D) show the X, Y and Z-component of the curled images and (E) shows the corresponding elastogram. Similarly, Figure 2 shows the MRE images from a 65 year old male HCM patient. Figure 3 shows a box plot of MRE shear stiffness between normal volunteers and HCM patients. The LV myocardial stiffness of HCM patients (mean: 12.01 kPa, was significantly higher (p < 0.01) than the LV myocardial stiffness of 46 normal healthy volunteers (mean: 7.79 kPa) (Figure 3).Discussion and Conclusions
The results from this study demonstrates the feasibility of 3D high-frequency cardiac MRE to quantitatively differentiate the increased myocardial stiffness in patients with HCM from normal volunteers. The myocardial stiffness of HCM patients (mean 12.01 kPa) was found to be significantly stiffer (p < 0.01) than healthy volunteers (mean: 7.79 kPa). These results motivate the use of myocardial stiffness as a biomarker in diagnosing HCM patients along with other clinical measurements.Acknowledgements
This work was supported by National Institutes of Health (NIH) grants 5R01HL115144 and EB001981 and Mayo Clinic Department of Radiology internal funding.References
1. Braunwald, E., 2015. Hypertrophic Cardiomyopathy: The Past, the Present, and the Future. In Hypertrophic Cardiomyopathy (pp. 1-8). Springer London.
2. Maron, B.J. and Maron, M.S., 2013. Hypertrophic cardiomyopathy. The Lancet, 381(9862), pp.242-255.
3. Dewey, S., Xu, Q. and Gomes, A., 2010. Static and dynamic properties of the HCM myocardium. Journal of molecular and cellular cardiology, 49(5), p.715.
4. Muthupillai, R., Lomas, D.J., Rossman, P.J. and Greenleaf, J.F., 1995. Magnetic resonance elastography by direct visualization of propagating acoustic strain waves. Science, 269(5232), p.1854.
5. Arunachalam SP, Rossman PJ, Arani A, Lake DS, Glaser KJ, Trzasko JD, Manduca A, McGee KP, Ehman RL, Araoz PA. Quantitative 3D magnetic resonance elastography: Comparison with dynamic mechanical analysis. Magnetic resonance in medicine : official journal of the Society of Magnetic Resonance in Medicine / Society of Magnetic Resonance in Medicine 2016.
6. Arani A, Glaser KL, Arunachalam SP, Rossman PJ, Lake DS, Trzasko JD, Manduca A, McGee KP, Ehman RL, Araoz PA. In vivo, high-frequency three-dimensional cardiac MR elastography: Feasibility in normal volunteers. Magnetic resonance in medicine : official journal of the Society of Magnetic Resonance in Medicine / Society of Magnetic Resonance in Medicine 2016.
7 .McGarry MD, Van Houten EE, Perrinez PR, Pattison AJ, Weaver JB, Paulsen KD. An octahedral shear strain-based measure of SNR for 3D MR elastography. Physics in medicine and biology 2011;56(13):N153-164.
8. Manduca A, Muthupillai, R., Rossman, P. J., Greenleaf, J. F., & Ehman, R. L. . Local wavelength estimation for magnetic resonance elastography. In Image Processing, 1996 Proceedings, International Conference on 1996;3:527-530.
Figures