0921
Longitudinal MRS, MRI and DTI of the spinal cord in Friedreich’s Ataxia1Center for Magnetic Resonance Research, University of Minnesota, Minneapolis, MN, United States
Synopsis
We report the first longitudinal MRS, structural MRI, and diffusion MRI data in the cervical spinal cord of subjects with Friedreich’s ataxia. We were able to detect significant changes in spinal cord area (-18%), tNAA/mIns ratio (-17%), fractional anisotropy (-11%) and mean diffusivity (+26%) in a group of 10 patients over 24 months. Our data suggest that MR of the spinal cord could be useful to assess the impact of potential treatments on neurodegeneration in upcoming clinical trials in FRDA.
Purpose
Friedreichʼs ataxia (FRDA) is one of the most common inherited ataxias [1]. A hallmark of the disease, and early event in the pathogenesis, is atrophy of the spinal cord, which can be quantified on anatomical images [2]. However, to our knowledge, there is no published data available in the spinal cord of patients with FRDA using MR modalities other than structural imaging. Preliminary cross-sectional MRS and DTI results were reported in abstract form in the spinal cord in FRDA [3]. Here, we present the first longitudinal MRS, MRI, and DTI data in the spinal cord in FRDA, as well as cross-sectional data in a large cohort.Methods
Subjects: Twenty-eight
patients with FRDA (age 19.0 ± 7.3 years, 15F, 13M) and 20 healthy age- and gender-matched controls
participated in the study. In addition, 10 of the 28 patients returned for
longitudinal follow-up at 12 and 24 months. Most patients were at a relatively
early stage of the disease (disease duration 5.6
± 3.8 years, clinical score 42.7
± 10.5 out of a maximum of 117 on the validated FARS scale). Datasets from one
control and two patients were excluded because of excessive
motion artifacts, resulting in n=26 patients and n=19 controls.
MR setup: All
measurements were performed on a Siemens Trio 3T scanner (Siemens, Erlangen,
Germany). The standard body coil was used
for RF transmission while the neck matrix and spine matrix were used for signal reception. In addition, a
12-channel head
matrix was also used for reception for MRS.
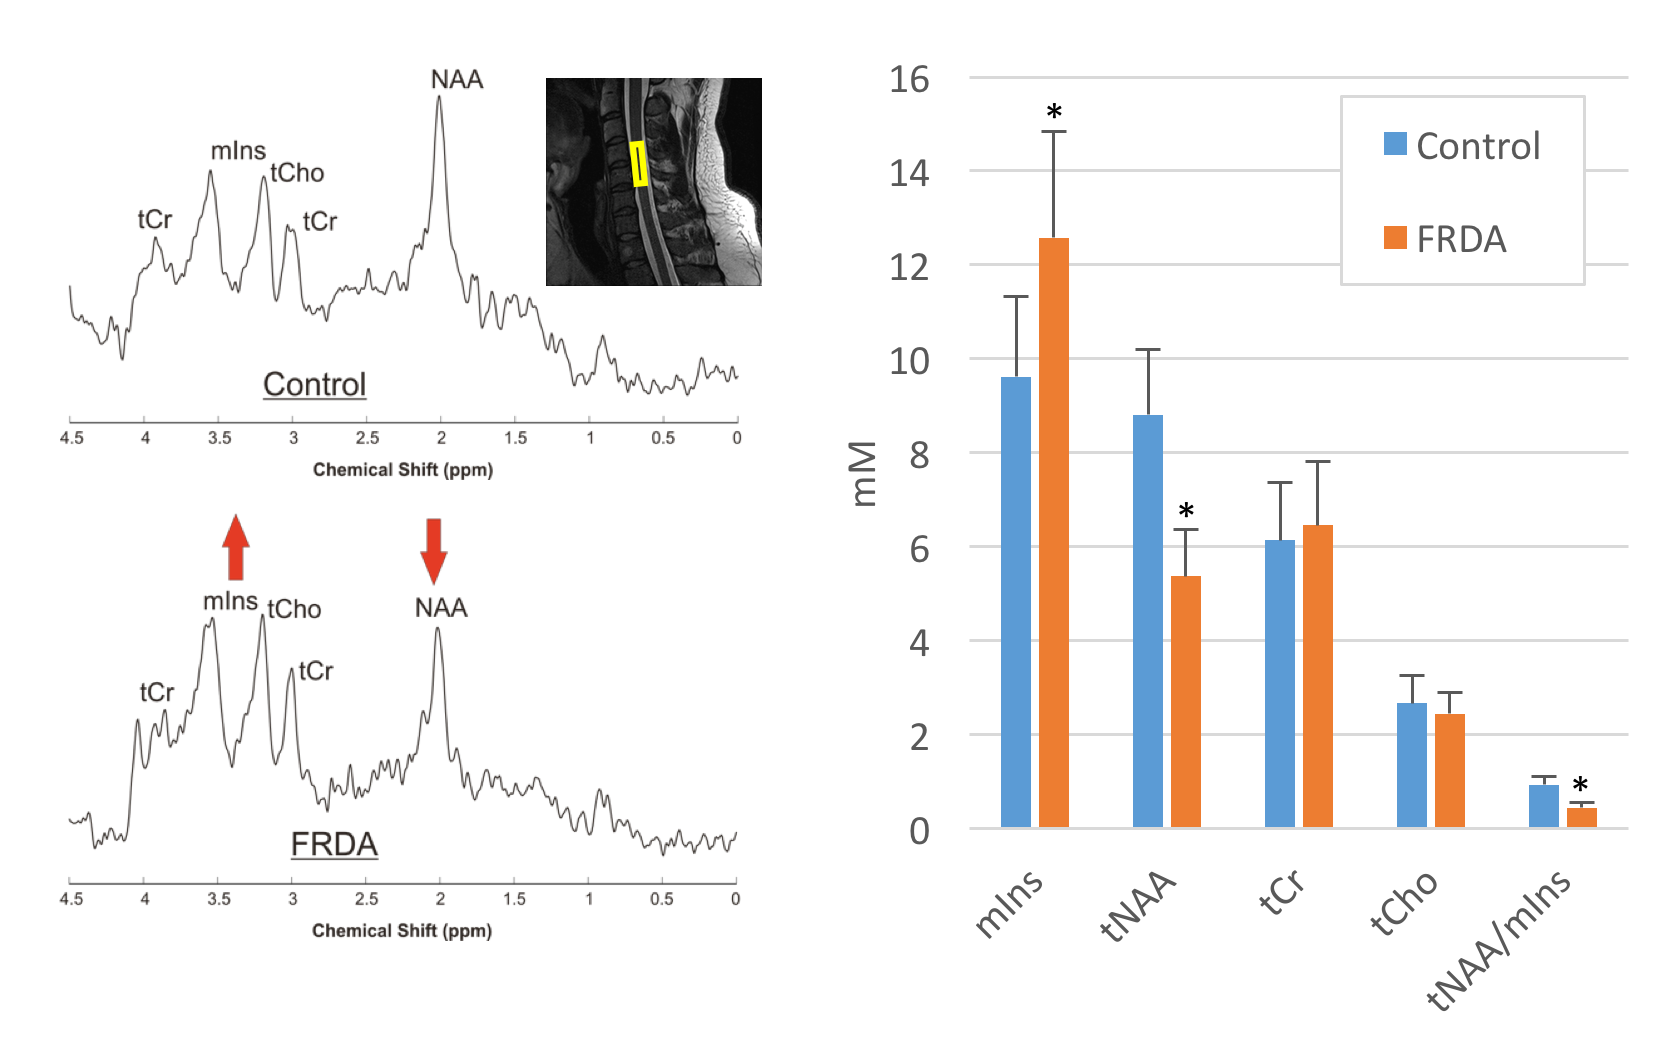
MRS: Proton MR
spectra (TR/TE=5000/28ms, 256 averages) were acquired in the spinal cord using
a modified semi-LASER sequence [4] from a 8x6x30 mm3 voxel positioned along the C4-C5 vertebrae. Spectra
were quantified with LCModel using water as an internal reference.
DTI: DTI was
acquired to cover C2 to C7 using a readout-segmented echo-planar sequence [5]
with the following parameters: TR/TE = 4500/66ms; voxel size =
1.1x1.1x3.3mm3; iPAT=2; 30 axial slices; 30 diffusion gradients with
b-value= 650 s/mm2 and 6
additional b=0 volumes. DTI was
acquired in two opposite phase encoding directions (A-P and P-A) and combined
to correct for geometric and eddy current distortions [6]. The
spinal cord was manually segmented at the C4-C5 level over 10 mm to obtain
average values for fractional anisotropy and axial and radial diffusivity.
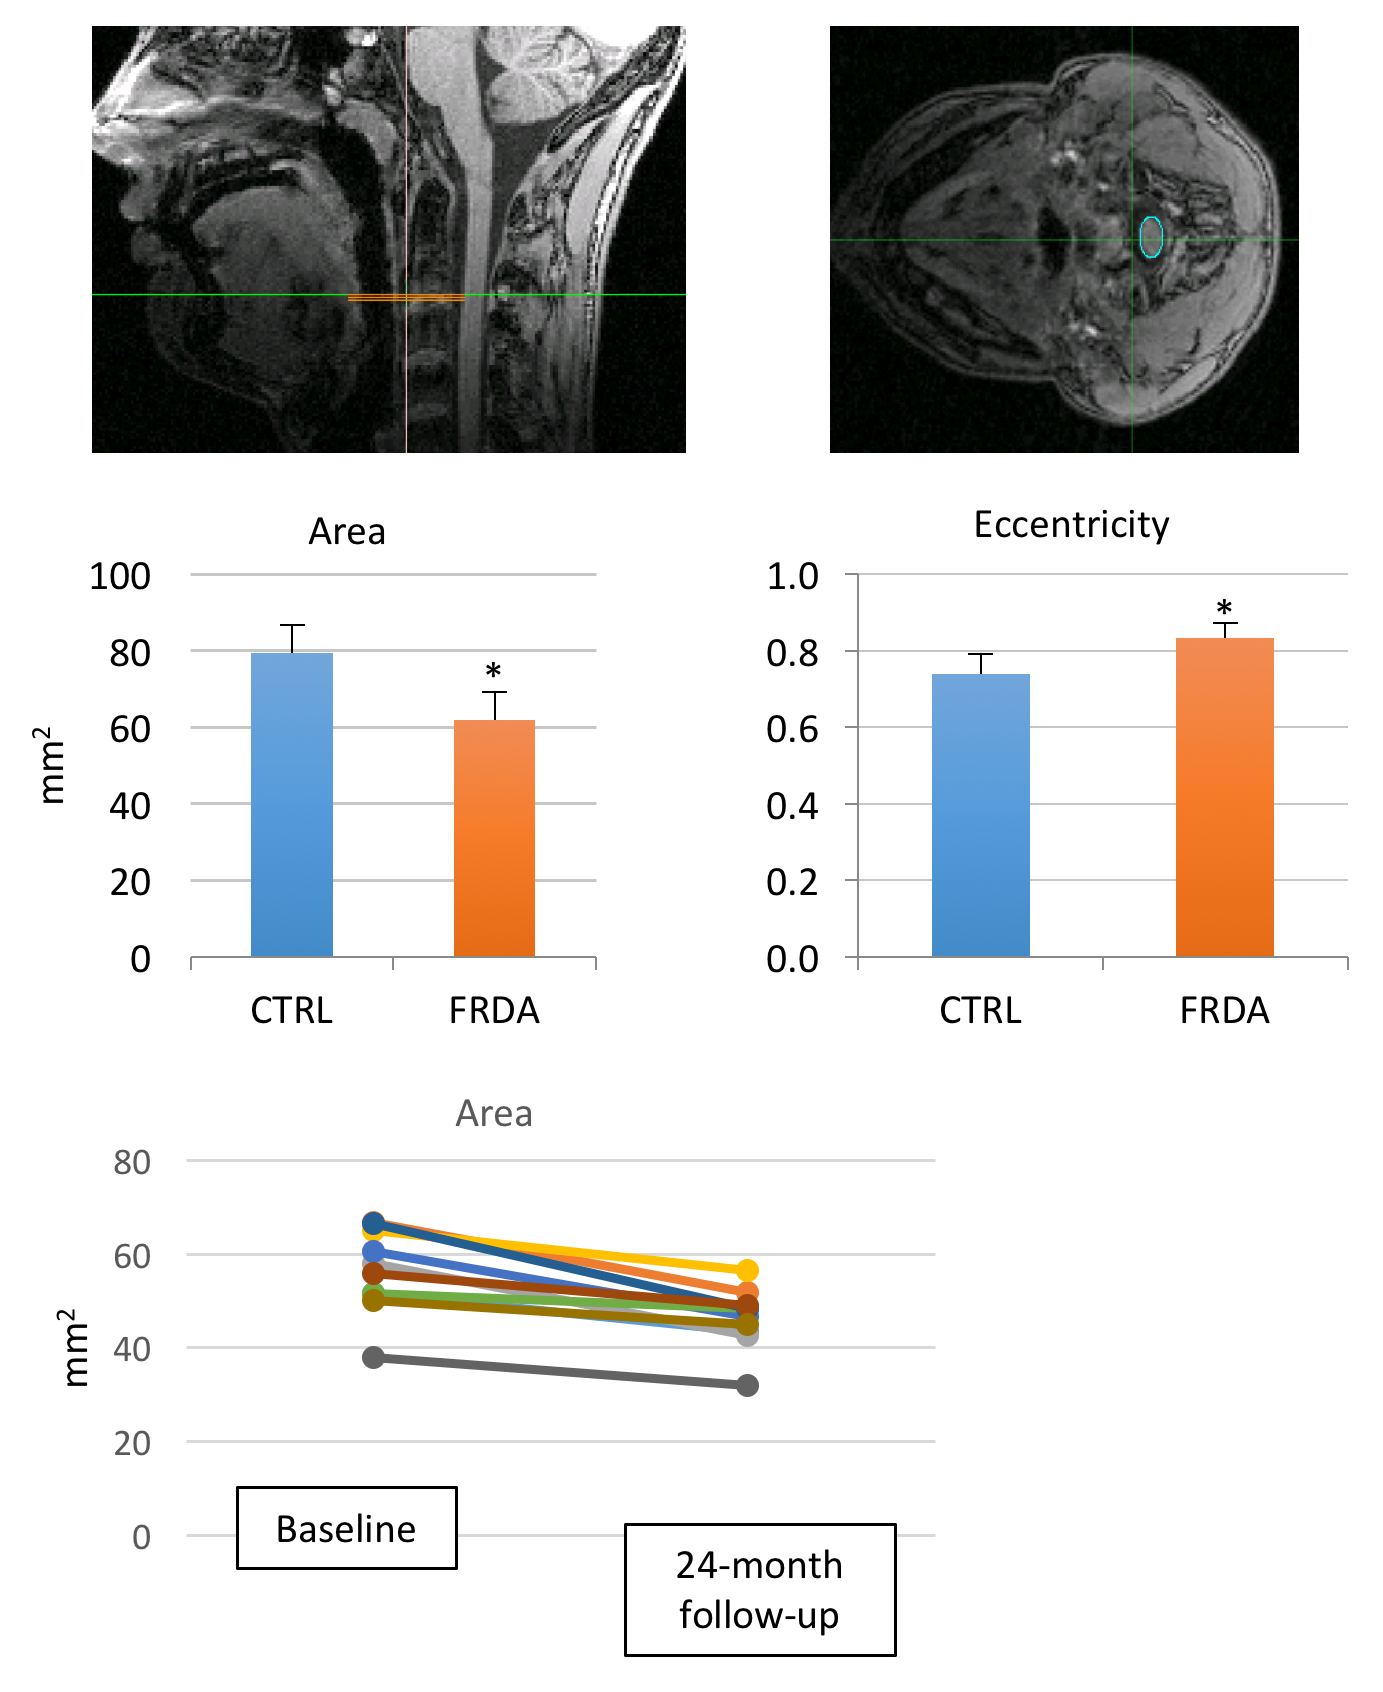
Morphometry: MP-RAGE T1
images were obtained with 1 mm isotropic resolution. Cervical spinal cord was
manually segmented with an ellipse on T1 images using Spineseg [2] to
determine average spinal cord area and eccentricity on three contiguous slices
at C2-C3 level.
Results and discussion
Cross-sectional:
We observed significant differences
(two-tailed unpaired t-test) between controls and patients with both DTI and MRS data. MRS
showed significant differences in tNAA (-40%,p<1e-10), mIns (+30%, p<1e-4), and tNAA/mIns ratio (-47%,
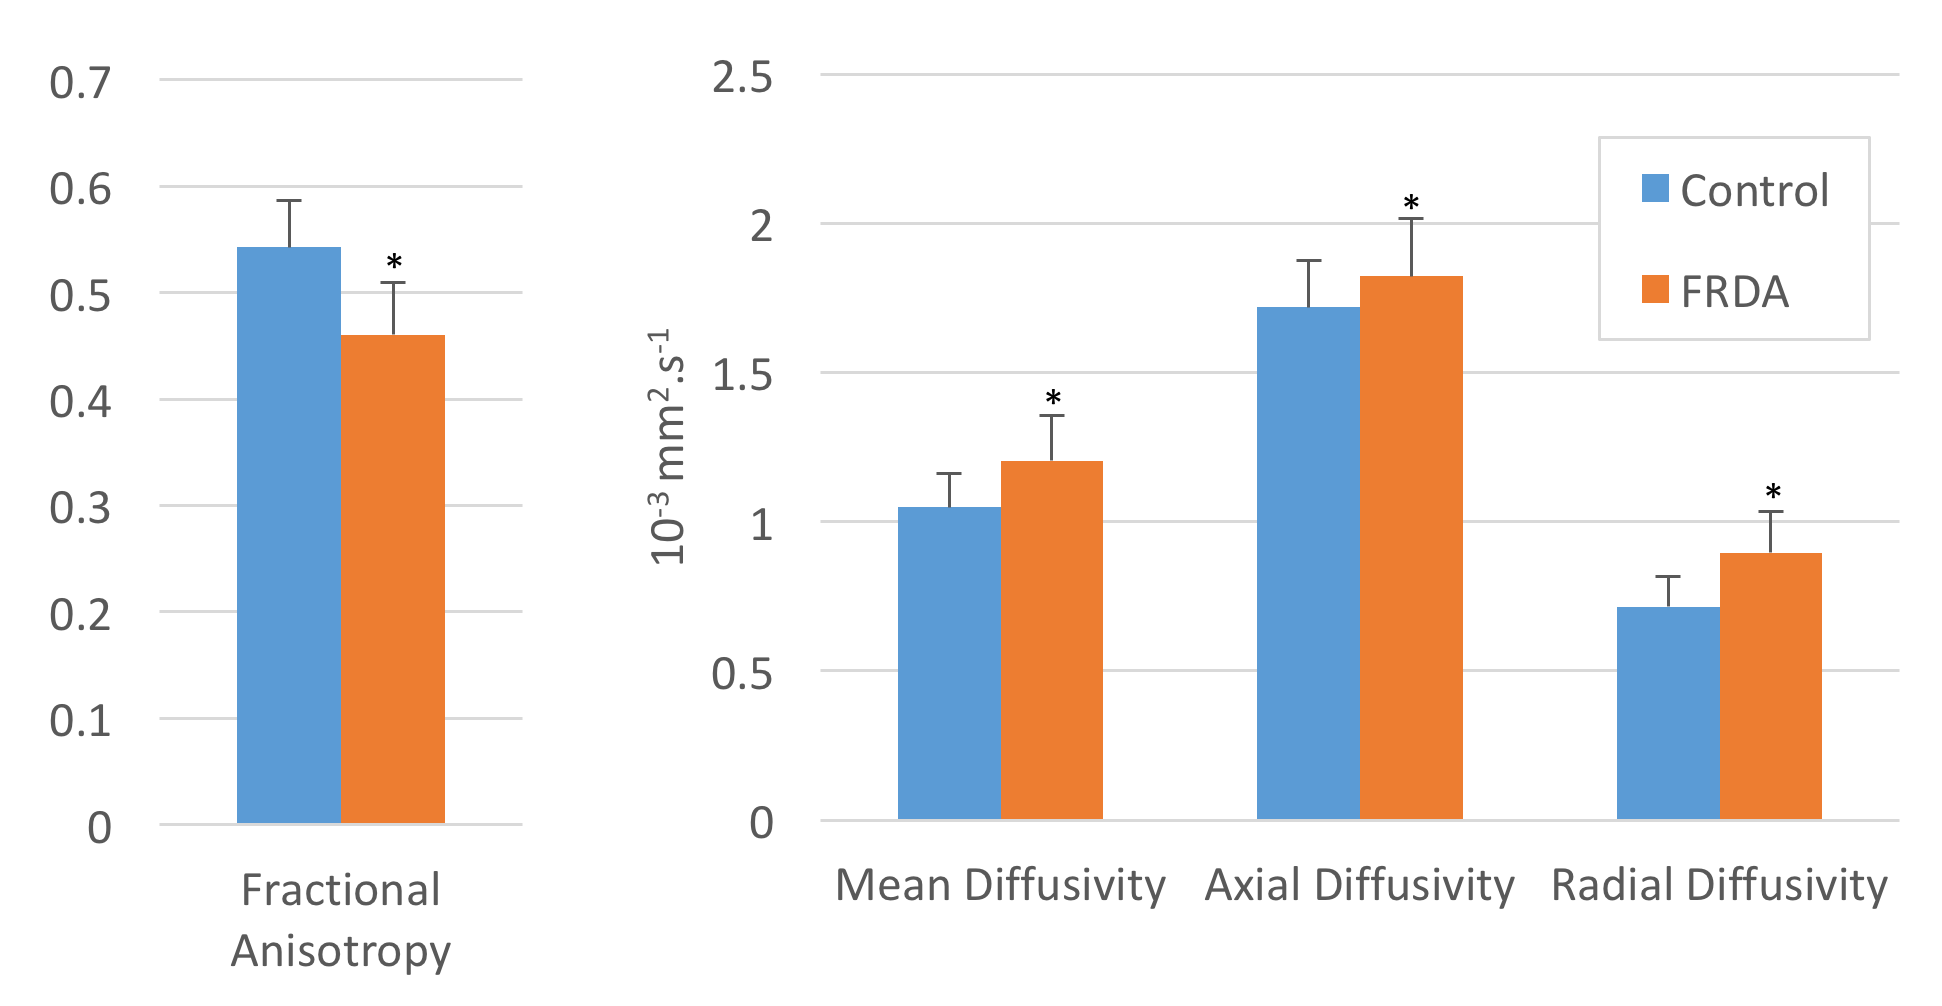
p<1e-13) (Fig. 1). DTI showed significant differences in fractional
anisotropy (-15%, p<1e-6), mean diffusivity (+15%, p<0.0005), axial
diffusivity (AD, +6%, p=0.05) and radial diffusivity (RD, +25%, p<1e-5) (Fig. 2). These
differences likely reflect neuronal damage and gliosis associated with
neurodegeneration. Morphometry showed reduced spinal cord area (-28%, p<1e-7)
and increased eccentricity in FRDA (+13%,p<1e-6) (Fig. 5), consistent with atrophy
of dorsal and lateral columns of the spinal cord [2].
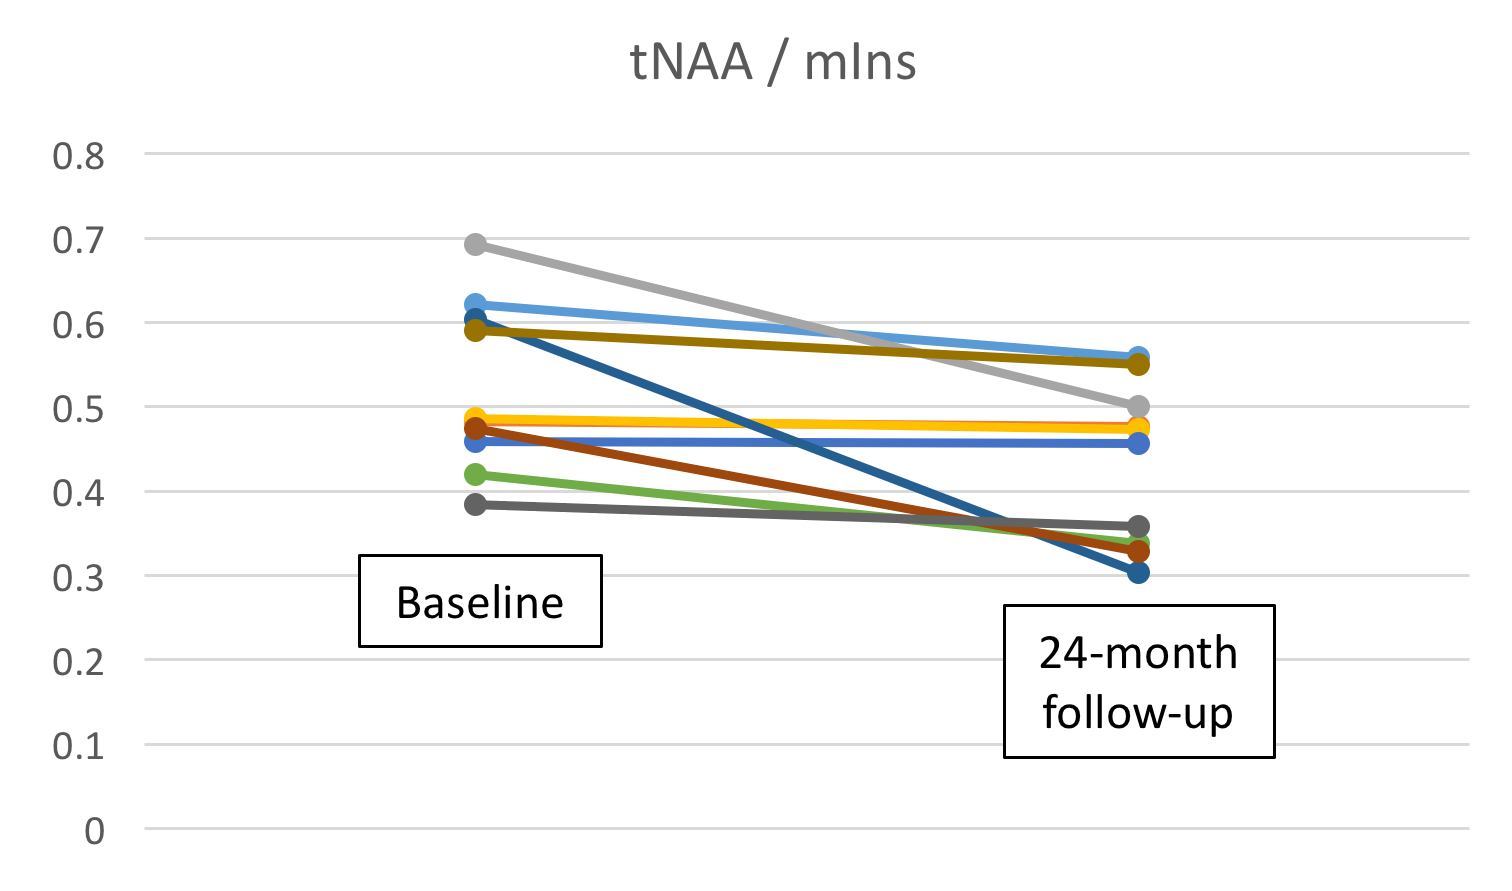
Longitudinal:
MRI and MRS also revealed significant changes
(two-tailed paired t-test) over 24 months in the subset of 10 patients who were
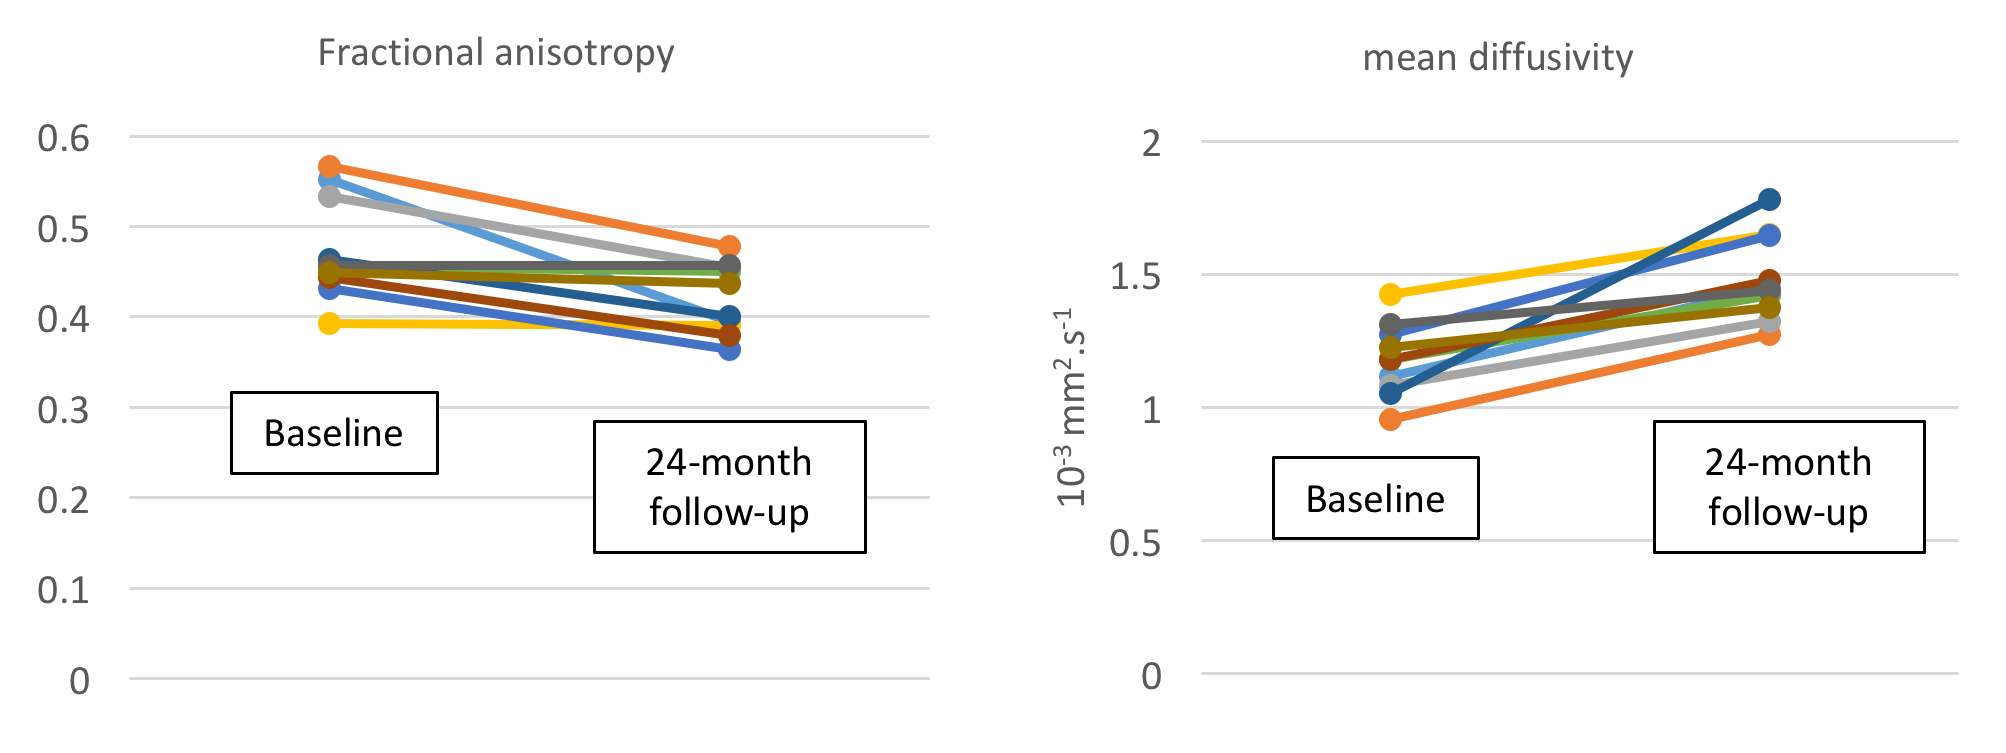
followed-up longitudinally, The tNAA/mIns ratio decreased by 17% on average
over 24 months (p=0.02) (Fig. 3). Fractional anisotropy decreased by 11%
(p<0.005) and mean diffusivity increased by 26% (p<0.0005) (Fig. 4). Spinal
cord area decreased by 18% over 24 months (p < 0.0001) and eccentricity
increased by 3% over 24 months (p<0.01, not shown), (Fig. 5). Similar trends could be
observed at 12-months, with p-values in the 0.01-0.1 range (not shown). These
data demonstrate the ability of MRS and MRI to detect neurochemical, structural
and microstructural changes in the cervical spinal cord, even in a relatively small
group of 10 patients. Increased sample size should permit detection of longitudinal
changes in a shorter time frame.
Conclusion
Even though spinal cord MR is technically more challenging than in the brain, we were able to detect significant longitudinal alterations in the cervical spinal cord of patients with FRDA. With multiple therapeutic trials currently being planned in FRDA, including gene therapy trials, these data support a role for MRS and MRI as potential markers of to assess therapeutic efficacy in clinical trials.Acknowledgements
This work was supported by the Friedreich’s Ataxia Research Alliance, Ataxia UK, GoFAR, the Bob Allison Ataxia Research Center, and NIH grants P41 EB015894 and P30 NS076408.References
[1]
Pandolfo, M. Friedreich ataxia, Arch Neurol, 2008 65(10):1296-303.
[2]
Chevis, C.F., et al. Spinal cord atrophy correlates with disability in
Friedreich's ataxia. Cerebellum, 2013. 12(1):43-7.
[3]
Henry P.G. et al. MRS and
diffusion MRI of the spinal cord in Friedreich’s Ataxia. Proc ISMRM 2014, 571.
[4]
Öz, G.,Tkác, I., Short-echo, single-shot, full-intensity proton magnetic
resonance spectroscopy for neurochemical profiling at 4 T: validation in the
cerebellum and brainstem. Magn Reson Med, 2011. 65(4):901-10.
[5]
Porter, D.A., Heidemann, R.M., High resolution diffusion-weighted imaging using
readout-segmented echo-planar imaging, parallel imaging and a two-dimensional
navigator-based reacquisition. Magn Reson Med, 2009. 62(2):468-75.
[6]
Andersson, J. et al. A comprehensive Gaussian Process framework for correcting
distortions and movements in diffusion images, Proc ISMRM 2012
Figures