0918
Fully automatic segmentation of spinal cord gray matter on patients with degenerative cervical myelopathy1NeuroPoly Lab, Institute of Biomedical Engineering, Polytechnique Montreal, Montreal, QC, Canada, 2Division of Neurosurgery, Department of Surgery, University of Toronto, Toronto, ON, Canada, 3Toronto Western Hospital, University Health Network, Toronto, ON, Canada, 4Montreal Heart Institute, Montreal, QC, Canada, 5Functional Neuroimaging Unit, CRIUGM, Université de Montréal, Montreal, QC, Canada
Synopsis
Degenerative cervical myelopathy (DCM) occurs when arthritic changes cause extrinsic spinal cord (SC) compression, inducing motor and sensory disabilities due to gray matter (GM) and white matter (WM) injury. GM segmentation of MR images can quantify atrophy of both GM and WM and may offer biomarkers to improve diagnosis, monitoring of disease progression, and prognosis. In this study, the GM of 33 DCM patients and 8 healthy subjects was automatically segmented using the method included in the Spinal Cord Toolbox (SCT). GM segmentation results were in good accordance with the underlying anatomy, demonstrating the feasibility of automatic GM segmentation in DCM patients exhibiting severe SC compression.
Introduction
IntroductionCervical spondylosis is part of the aging process and is characterized by degenerative changes of different spine elements (vertebrae, intervertebral discs, facet joints, and associated ligaments). It affects 95% of men and 70 % of women by the age of 601, and is often asymptomatic in early stages. Over time these changes can result in a narrowing of the spinal canal inducing spinal cord (SC) compression, sometimes inducing neurological symptoms known as degenerative cervical myelopathy (DCM, which includes cervical spondylotic myelopathy). Segmenting the gray matter (GM) in DCM patients could help to quantify atrophy of the GM and white matter (WM) and estimate the degree of focal injury to specific myotomes and dermatomes, potentially providing relevant biomarkers for diagnosis, monitoring of disease progression, and prognosis2. The goal of this study was to demonstrate the feasibility of automatic GM segmentation in DCM patients exhibiting severe SC compressions.Methods
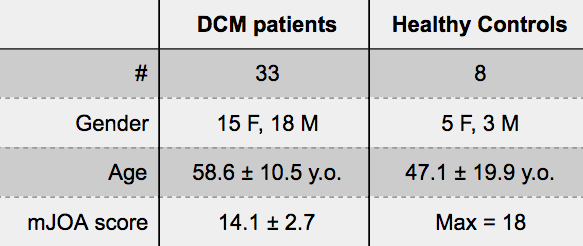
A cohort of 33 DCM patients and 8 healthy controls (HC) were scanned at the Toronto Western Hospital on a 3T MRI system (GE-Healthcare). Anatomical T2-weighted images were acquired using a 3D balanced steady-state free precession sequence (TR/TE=5.4/2.6ms, flip-angle=35°, resolution=0.8×0.8×0.8mm3). T2*-weighted were acquired using a 2D spoiled gradient echo sequence with multiple echoes (MERGE) averaged (axial orientation, TR/TE=650/[5, 10, 15]ms, flip-angle=20°, bandwidth=62kHz/line, resolution=0.6×0.6×4mm3). The clinical disability of the DCM patients was assessed by a spine surgeon (ARM) using the modified Japanese Orthopaedic Association (mJOA) score3. Demographic data are displayed in Table 1.
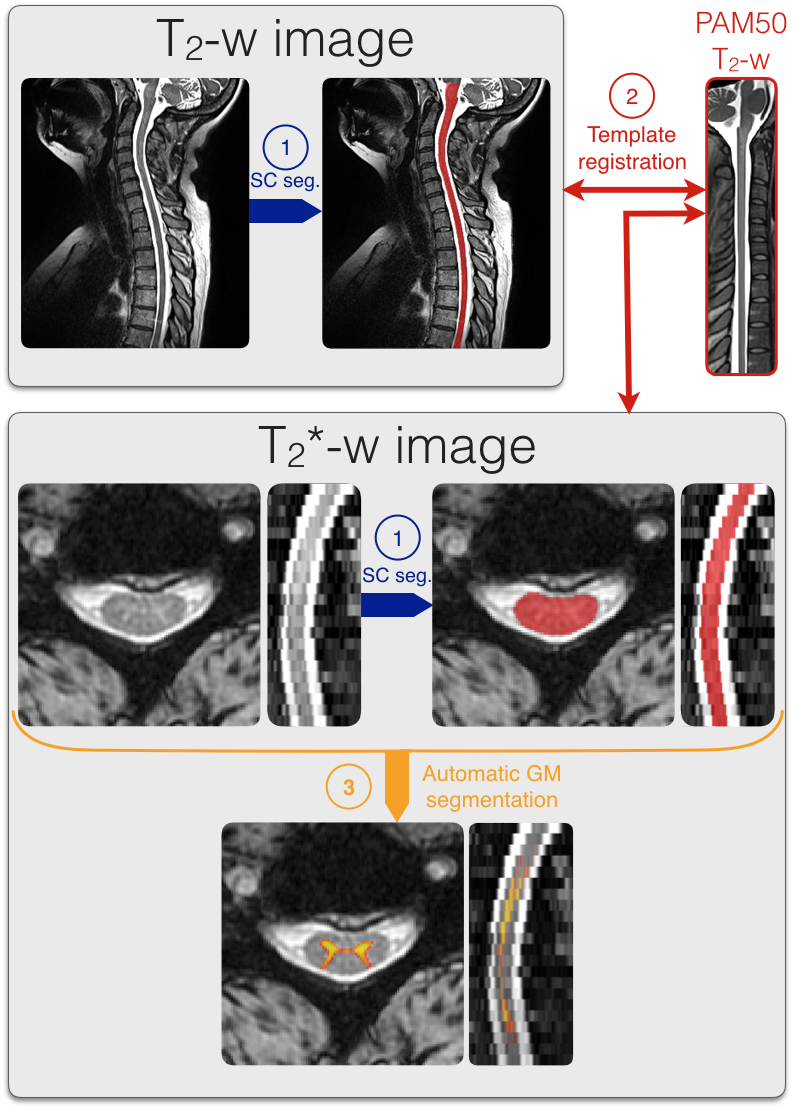
The data were processed using the spinal cord toolbox (SCT, https://sourceforge.net/projects/spinalcordtoolbox/)4 as described in Figure 1. First, the SC was automatically segmented on the T2-w and T2*-w data using Propseg5 and manually corrected when needed. Then, the PAM50 template6 was registered on the T2-w and T2*-w data using SCT tools (resp. sct_register_to_template and sct_register_multimodal). Finally, the GM was automatically segmented using SCT multi-atlas based GM segmentation7. This method was improved to account for severe SC compression that occur in DCM (included in SCT, version 3.0 and higher, see https://github.com/neuropoly/spinalcordtoolbox/releases/).
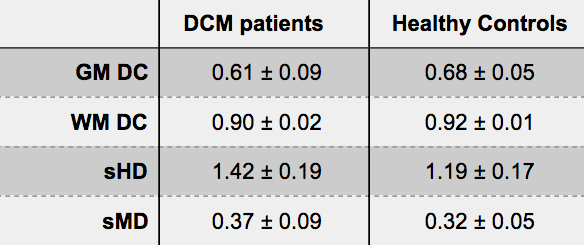
For validation purposes, the GM was manually segmented by an experienced rater when the GM/WM contrast was sufficient. For all slices acquired and manually segmented, the Dice coefficient8 (DC) was computed for the GM and WM. The skeletonized Hausdorff and median distances (resp. sHD and sMD) were also computed7.
Results
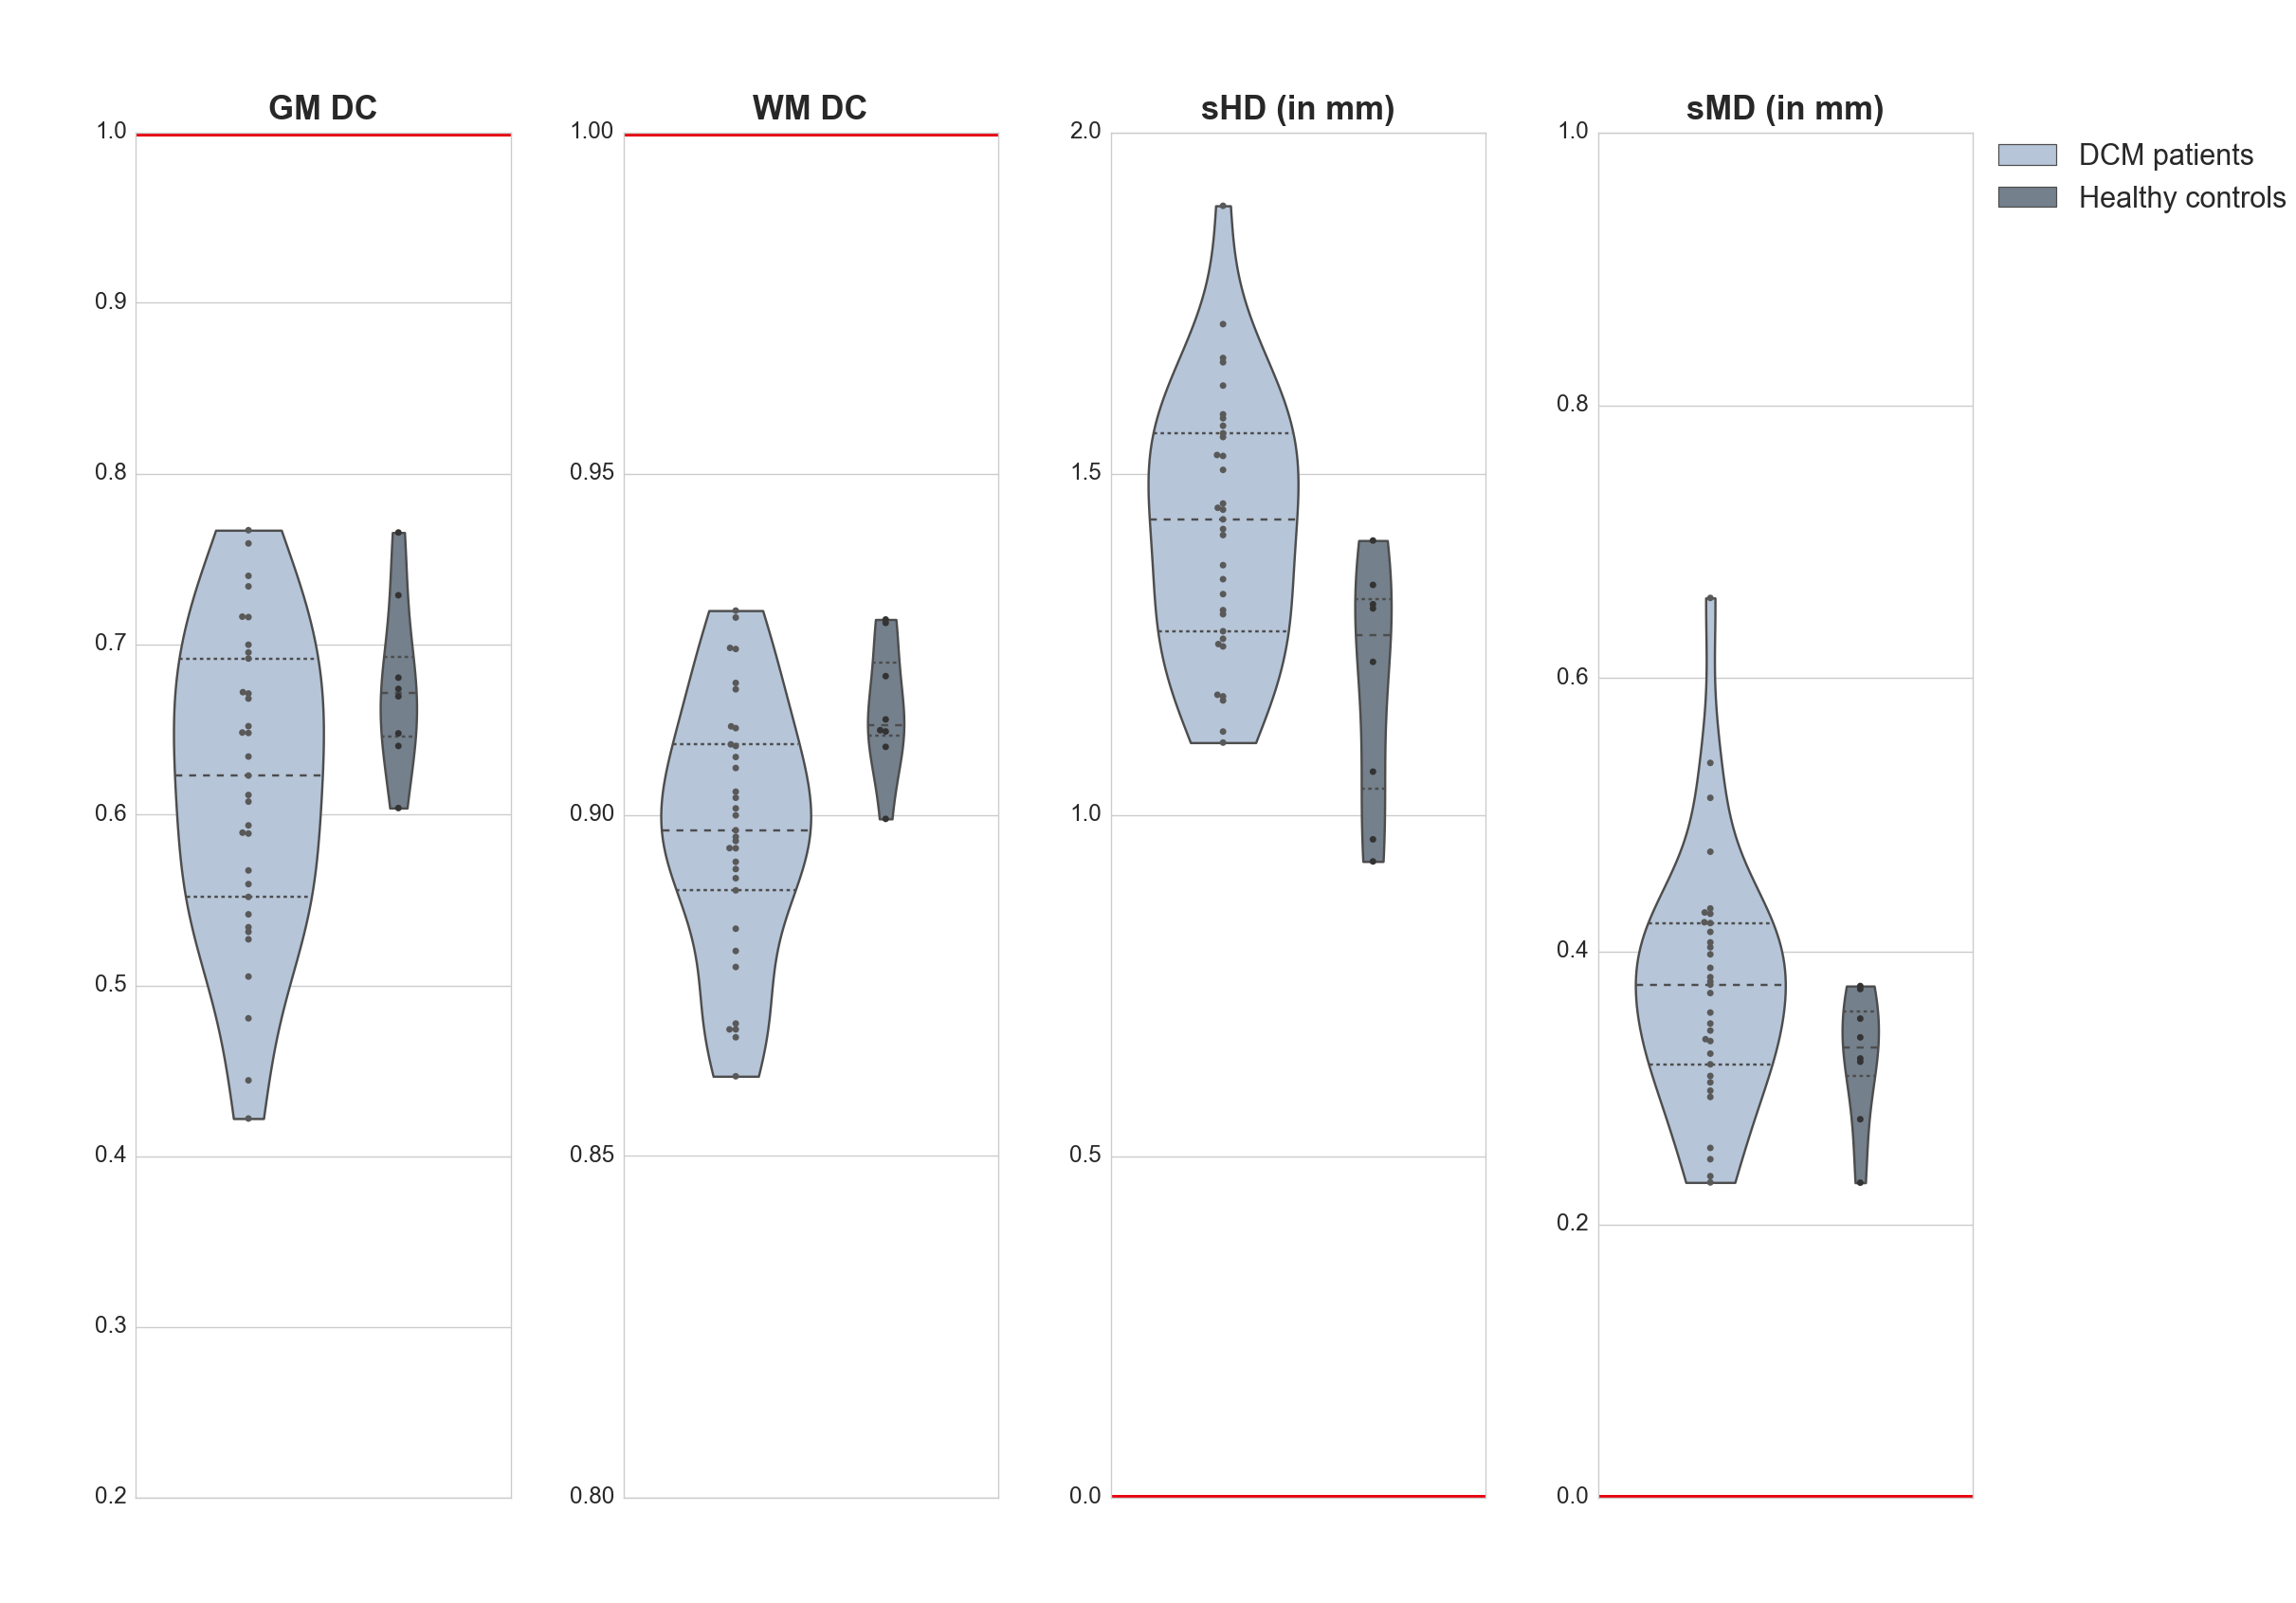
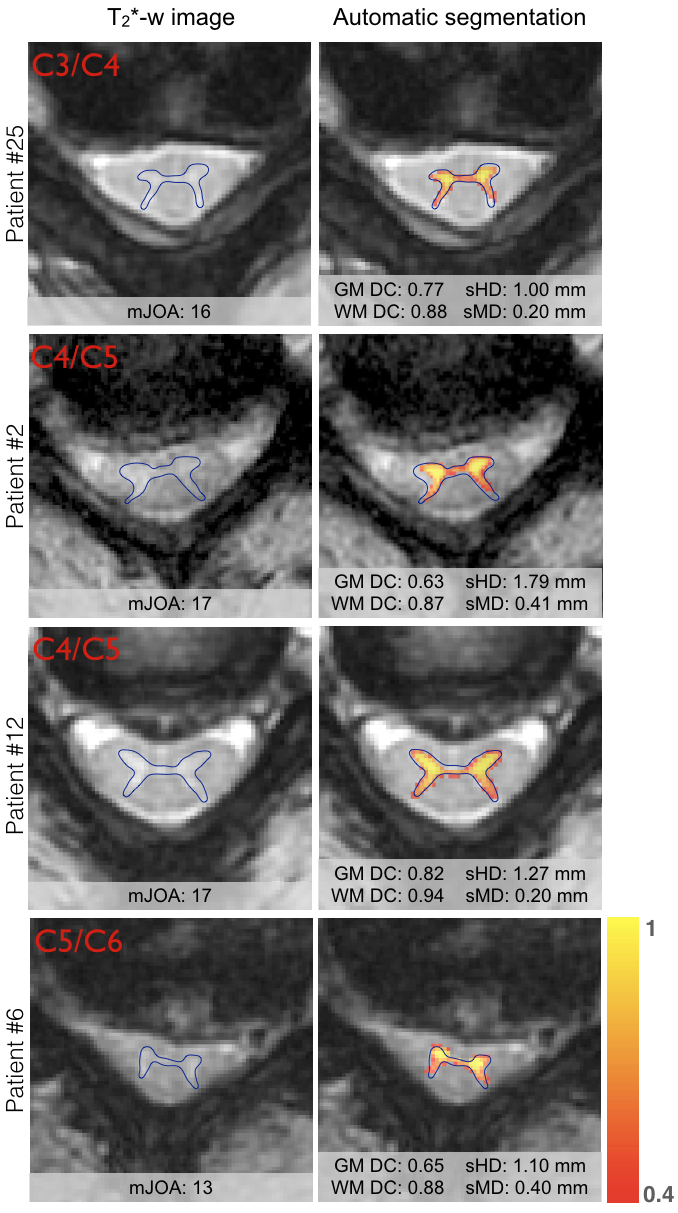
The GM was successfully segmented in HC as well as in DCM patients, as shown in Table 2. The distribution of the computed metrics shown in Figure 2 suggest that the quality of the segmentation in DCM patients was very close to the one in HC. Visual examples of automatic GM segmentation in DCM patients are shown in Figure 3, illustrating the visually good delineation achieved by the proposed method.Discussion
The automatic GM segmentation resulted in satisfactory values of the computed metrics, and visually good delineation of the underlying anatomy. The distributions of the computed metrics were sensibly wider for the DCM patients compared to HC, but these values were overall in the same range. The metric values for DCM patients were overlapping with the values for HC, suggesting that for most of the DCM patients, the quality of the segmentation was as good as for HC. However, the difference in sample size between groups (33 DCM patients vs. 8 HC) hindered any statistical comparisons of the quantitative results. The GM DC for DCM patients had a notably large distribution, reaching rather small values for some patients, yet, the WM DC for DCM was consistently higher, which is explained by the inherent small size of GM. Furthermore, the sMD had notably low values for DCM patients (only three patients had sMD>0.5mm) suggesting that the GM segmentation properly captured the overall shape of the GM. These promising results for automatically segmenting the GM could be of great help to develop a reliable biomarker reflecting the clinical disability of DCM patients2, and to help the prognosis of this pathology.
Finally, the processing pipeline was mostly automatic, necessitating human action only to manually correct SC segmentation for very challenging slices with remarkably low SC/CSF contrast. Thus, this processing pipeline is suitable to large datasets of DCM patients.
Conclusion
Automatic GM segmentation was successfully performed on subjects exhibiting severe SC compression, achieving qualitatively and quantitatively good results. To our knowledge, this study is the first to automatically segment GM on DCM patients, opening the way to large clinical studies in DCM.Acknowledgements
This study was funded by the Canada Research Chair in Quantitative Magnetic Resonance Imaging (JCA), the Canadian Institute of Health Research [CIHR FDN-143263], the Canada Foundation for Innovation [32454], the Fonds de Recherche du Québec - Santé [28826], the Fonds de Recherche du Québec - Nature et Technologies [2015-PR-182754], the Natural Sciences and Engineering Research Council of Canada [435897-2013] and the Quebec BioImaging Network.References
1. Tracy, J. A. & Bartleson, J. D. Cervical spondylotic myelopathy. Neurologist 16, 176–187 (2010).
2. Martin, A. R. et al. Next-generation MRI identifies tract-specific injury and predicts focal neurological deficits in degenerative cervical myelopathy: development and characterization of accurate imaging biomarkers for spinal cord pathologies. 2016 Canadian Spine Society Abstracts - Can. J. Surg. 59, S39–63, 2.25 (2016).
3. Benzel, E. C., Lancon, J., Kesterson, L. & Hadden, T. Cervical laminectomy and dentate ligament section for cervical spondylotic myelopathy. J. Spinal Disord. 4, 286–295 (1991).
4. De Leener, B. et al. SCT: Spinal Cord Toolbox, an open-source software for processing spinal cord MRI data. Neuroimage (2016). doi:10.1016/j.neuroimage.2016.10.009
5. De Leener, B., Kadoury, S. & Cohen-Adad, J. Robust, accurate and fast automatic segmentation of the spinal cord. Neuroimage 98, 528–536 (2014).
6. De Leener, B. et al. Fully-integrated T1, T2, T2*, white and gray matter atlases of the spinal cord. in Proceedings of the 24th Annual Meeting of ISMRM 1129 (2016).
7. Dupont, S. M. et al. Fully-integrated framework for the segmentation and registration of the spinal cord white and gray matter. Neuroimage (2016). doi:10.1016/j.neuroimage.2016.09.026
8. Dice, L. R. Measures of the Amount of Ecologic Association Between Species. Ecology 26, 297–302 (1945).
Figures