0917
Multi-Parametric Cervical Spinal Cord MRI Provides An Accurate Diagnostic Tool for Detecting Clinical Myelopathy1Neurosurgery, University of Toronto, Toronto, ON, Canada, 2Electrical Engineering, École Polytechnique de Montréal, Montréal, QC, Canada, 3Neurosurgery, University of Calgary, Calgary, AB, Canada, 4Medicine, University College Cork, Cork, Ireland, 5Medical Imaging, University of Toronto, Toronto, ON, Canada
Synopsis
ddd
INTRODUCTION
The clinical diagnosis of myelopathy, defined as spinal cord (SC) neurological dysfunction, is sometimes challenging as symptoms (e.g. fine motor dysfunction, numbness, and gait impairment) are highly subjective and often transient in nature. Diagnosis is usually made by an experienced neurologist or neurosurgeon based on clinical examination, but this is also subjective (e.g. hyperreflexia, gait ataxia) and cases with diagnostic uncertainty are relatively common. Anatomical MRI showing cord compression has poor specificity, as this is present in 8-26% of healthy subjects,1-4 while electrophysiology assessments (e.g. SSEPs) have poor sensitivity.5 MRI techniques that provide measures of demyelination, axonal injury, and atrophy may provide enhanced accuracy for cases with diagnostic uncertainty.
We previously reported results of a multi-parametric MRI protocol to assess cervical SC tissue injury, demonstrating significant differences between 56 DCM and 32 healthy subjects in 10 metrics.6,7 The current study employs the same MRI techniques to develop a diagnostic tool, comparing 5 statistical approaches for classification between healthy subjects and those with degenerative cervical myelopathy.
METHODS
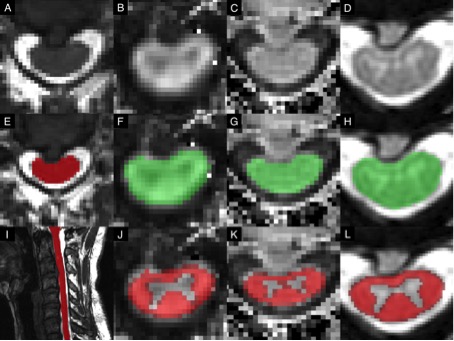
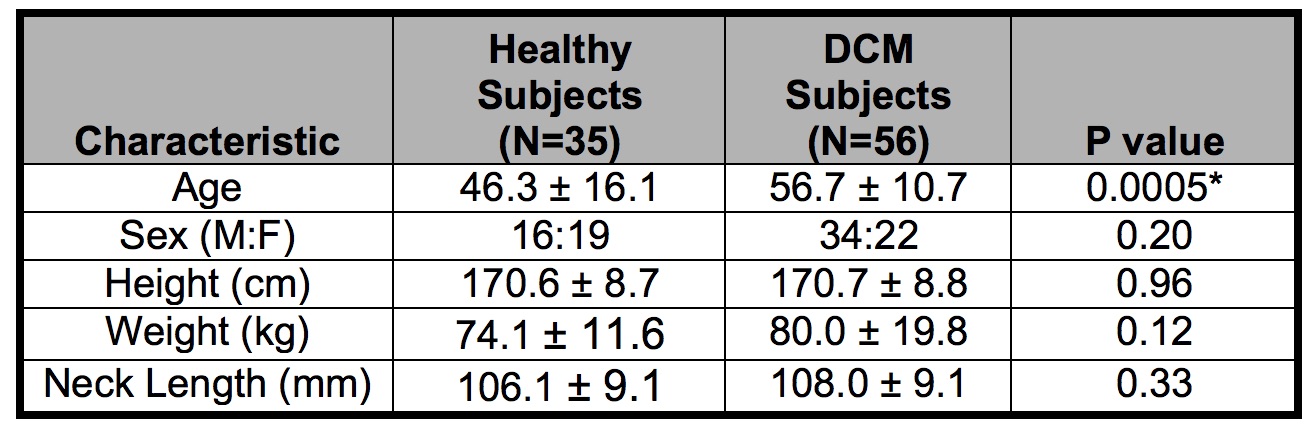
35 healthy subjects and 56 DCM patients were included in the analysis. Demographic data included age, sex, height, weight, and cervical cord length (Table 1). All subjects were examined by an experienced physician (MGF, ARM) to determine the presence/absence of myelopathic symptoms/signs. Subjects underwent 3T MRI (GE) including T2-weighted (T2w) imaging (FIESTA-C, 0.8x0.8x0.8mm3), diffusion tensor imaging (DTI, ssEPI, 1.25x1.25x5mm3), magnetization transfer (MT; SPGR with/without prepulse, 1x1x5mm3), and T2*-weighted (T2*w) imaging (MERGE, 3 echoes, 0.6x0.6x4mm3) covering C1-C7 (Figure 1).8
MRI data were analyzed with the Spinal Cord Toolbox (SCT)8 to calculate SC cross-sectional area (CSA), fractional anisotropy (FA), MT ratio (MTR), and T2*w white to grey matter signal intensity ratio (T2*w WM/GM) at the maximally compressed level (MCL), rostral (C1-C3), and caudal (C6-7) levels and normalized for confounding variables (including age).
Statistical analysis was performed with R version 3.3. Diagnostic models were developed using subject characteristics and MRI data using 1) logistic regression (LR) with backwards stepwise variable selection, 2) linear discriminant analysis (LDA), 3) principle component analysis followed by logistic regression (PCA-LR), 4) k-nearest neighbors (kNN) with various k values (3,5,7), and 5) a support vector machine (SVM) model using a radial basis function kernel and various values for cost=(1,10,100,1000), and gamma=1. Logistic regression models were limited to 4 degrees of freedom due to the limited sample size. Validation was performed using bootstrap (LR, PCA-LR) with 500 iterations or leave-one out cross-validation (LDA, kNN, SVM), based on available R functions for each statistical method, to yield estimates of diagnostic accuracy reported as corrected area under receiver operating characteristic curves (AUC).
RESULTS
All 5 models showed good diagnostic accuracy, with the SVM model showing the highest performance (AUC=95.6%), outperforming LR (AUC=93.6%), PCA-LR (AUC=89.0%), LDA (AUC=87.9%), and kNN (k=5, AUC=84.6%). The SVM model with cost=100 outperformed other SVM models, which showed AUC ranging from 91.2% to 94.3%. The LR model retained CSAMCL (p=0.0007), T2*w WM/GMRostral (p=0.04), CSARostral (p=0.08), and MTRRostral (p=0.39).DISCUSSION
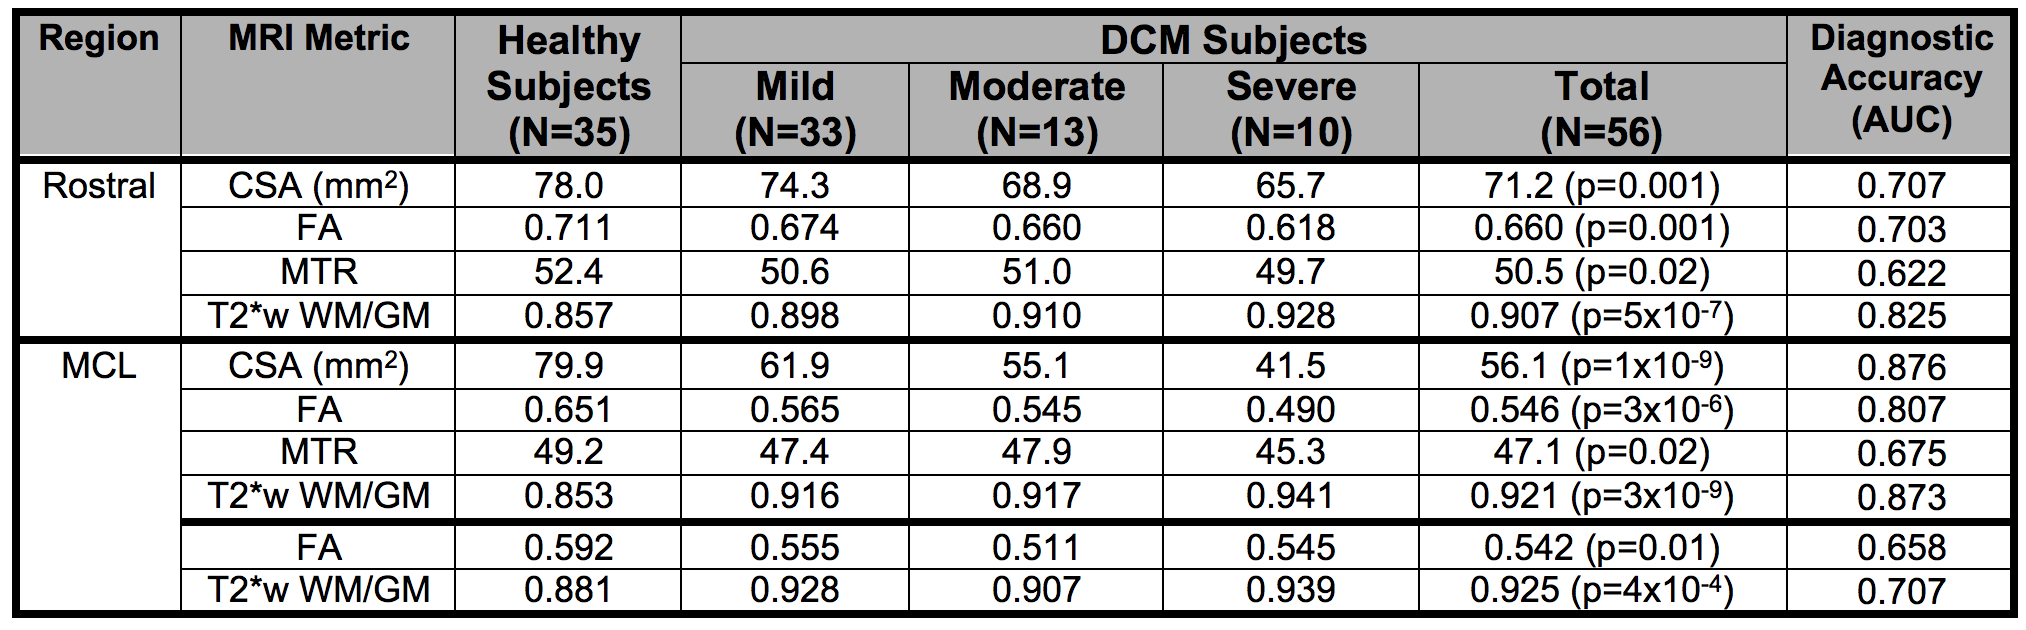
Multi-parametric MRI of the cervical SC shows promise as an accurate diagnostic tool for the detection of myelopathy. Our MRI protocol generates 10 measures of tissue injury, which individually show modest diagnostic accuracy between healthy and DCM subjects (Table 2), with AUC ranging from 62.2% to 87.6%. However, in combination these measures can achieve a level of accuracy that exceeds 95%. The diagnosis of DCM is important because it is a progressive disease (20-62% at 3 years),9 and early detection and treatment can avoid permanent disability, as the spinal cord has extremely limited capacity for regeneration once injured. There is a trend in the surgical community toward early surgical treatment of mild DCM, as this not only halts progression of disease but usually provides partial recovery of function to a near-normal level.10
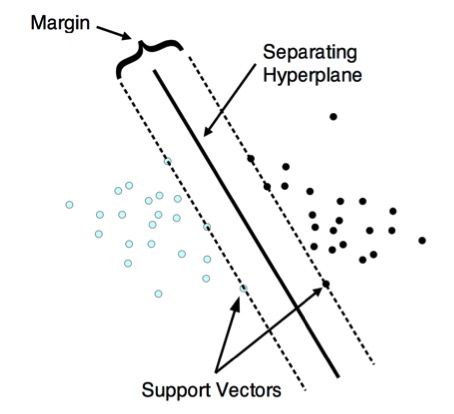
The results showed that supervised machine learning algorithms such as SVM can achieve greater diagnostic accuracy than conventional statistical approaches such as LR or LDA. SVM classification works by finding a hyperplane that optimally separates 2 classes of multivariate data (Figure 2),11 and it is not surprising that this approach yielded superior results given the complexity of the multi-parametric input data.
This study demonstrates that a relatively simple MRI examination, using a standard clinical 3T scanner and product sequences (available on all major MRI vendors) with approximately 30 minutes acquisition time, provides an accurate diagnostic test for DCM. These results warrant further investigation in a large series of cases with diagnostic uncertainty of myelopathy to fully establish the clinical utility of this approach.
Acknowledgements
This research received funding support from Rick Hansen Institute, as part of the Riluzole in Spinal Cord Injury Study (RISCIS), which is also supported by AOSpine North America, AOSpine International SCI Knowledge Forum, and the North American Clinial Trials Network (NACTN) of the Christopher and Dana Reeve Foundation. This research also received support from the Dezwirek Foundation, the Sherman Clinical Research Unit, and the Gerald and Tootsie Halbert Chair in Spinal Cord Research. Dr. Martin received post-doctoral fellowship support from Canadian Institutes of Health Research.References
1. Teresi LM, Lufkin RB, Reicher MA, et al. Asymptomatic degenerative disk disease and spondylosis of the cervical spine: MR imaging. Radiology. 1987;164(1):83-8.
2. Boden SD, McCowin PR, Davis DO, Dina TS, Mark AS, Wiesel S. Abnormal magnetic-resonance scans of the cervical spine in asymptomatic subjects. A prospective investigation. J Bone Joint Surg Am. 1990;72(8):1178-84.
3. Matsumoto M, Fujimura Y, Suzuki N, et al. MRI of cervical intervertebral discs in asymptomatic subjects. J Bone Joint Surg Br. 1998;80(1):19-24.
4. Lee MJ, Cassinelli EH, Riew KD. Prevalence of cervical spine stenosis. Anatomic study in cadavers. J Bone Joint Surg Am. 2007;89(2):376-80.
5. Kerkovsky M, Bednarik J, Dusek L, et al. Magnetic resonance diffusion tensor imaging in patients with cervical spondylotic spinal cord compression: correlations between clinical and electrophysiological findings. Spine (Phila Pa 1976). 2012;37(1):48-56.
6. Martin AR, De Leener B, Cohen-Adad J, Aleksanderek I, Cadotte DW, Fehlings MG. A Clinically Feasible Quantitative MRI Protocol to Assess Tissue Injury in the Cervical Spinal Cord Using DTI, MT, and T2*-Weighted Imaging: Reliability and Variations with Confounding Variables. The Spine Journal Oct 2016;16(10) Suppl S199–S200.
7. Martin AR, De Leener B, Cohen-Adad J, et al. Microstructural MRI Quantifies Tract-Specific Injury and Correlates With Global Disability and Focal Neurological Deficits in Degenerative Cervical Myelopathy. Neurosurgery. 2016 Aug;63 Suppl 1:165.
8. De Leener B, Lévy S, Dupont SM, et al. SCT: Spinal Cord Toolbox, an open-source software for processing spinal cord MRI data. NeuroImage Epub: Oct 5, 2016.
9. Kalsi-Ryan S, Karadimas SK, Fehlings MG. Cervical spondylotic myelopathy: the clinical phenomenon and the current pathobiology of an increasingly prevalent and devastating disorder. Neuroscientist. 2013;19(4):409-21.
10. Fehlings MG, Wilson JR, Kopjar B, et al. Efficacy and safety of surgical decompression in patients with cervical spondylotic myelopathy: results of the AOSpine North America prospective multi-center study. J Bone Joint Surg Am. 2013;95(18):1651-8.
11. Meyer D. Support Vector Machines: The Interface to libsvm in package e1071. Retrieved on 2016-11-09 from: ftp://cran.r-project.org/pub/R/web/packages/e1071/vignettes/svmdoc.pdf
Figures