0916
Statistical combinations of T1, MTR, MTsat and Macromolecular Tissue Volume to improve myelin content estimation in the human spinal cord at 3T1NeuroPoly Lab, Institute of Biomedical Engineering, Polytechnique Montreal, Montreal, QC, Canada, 2Centre de Recherche de l'Institut Universitaire de Gériatrie de Montréal (CRIUGM), Montreal, QC, Canada, 3Psychology Department, Bilkent University, Ankara-06800, Turkey, 4Interdisciplinary program in Neuroscience, Bilkent University, Ankara-06800, Turkey, 5National Magnetic Resonance Research Center (UMRAM), Bilkent University, Ankara-06800, Turkey, 6Department of Stomatology, Faculty of Dentistry, Université de Montréal, Montreal, QC, Canada, 7Montreal Heart Institute, Montreal, QC, Canada, 8Functional Neuroimaging Unit, Centre de Recherche de l'Institut Universitaire de Gériatrie de Montréal (CRIUGM), Montreal, QC, Canada
Synopsis
Several quantitative MRI metrics have been proposed to quantify myelin in the central nervous system but each of them includes confounding factors that impair their sensitivity and specificity. Because these factors are different across metrics, data driven approaches developed for blind source separation problems to extract the common component between recordings of the same sources seem appropriate. This study compares linear and nonlinear methods to combine myelin-sensitive metrics: T1, MTR, MTsat, MTV (1 – PD). The repeatability of the resulting combined metrics as well as their sensitivity to different microstructural features are tested. A higher sensitivity is achieved with linear combinations.
Introduction
Reliable quantitative
indexes of myelin content would help clinicians with diagnosis and monitoring
of white matter (WM) pathologies that impair myelination, such as multiple
sclerosis or myelitis. Several quantitative MRI metrics have been proposed but
their sensitivity and specificity to myelin remain limited under clinical
constraints, partly due to poor repeatability, especially in the spinal cord where
the region of interest is small and where movements and field inhomogeneities
are increased. Provided only 4 images, the variable flip angle method can
produce longitudinal relaxation time (T1), Magnetization Transfer
Ratio (MTR), Magnetization Transfer saturation (MTsat) and
Macromolecular and lipid Tissue Volume (MTV) maps, four metrics that were shown
to correlate with myelin1-6. Inspired by the approach
proposed in the brain7, we study four statistical approaches
developed in the context of blind
source separation problems to
combine these metrics in order to gain sensitivity and specificity to
microstructure. We compare the results in
terms of repeatability along test-retest and sensitivity. Considering several
histological studies reporting a demyelination with aging8-11, we investigate the effect of
age as well as differences between dorsal column (DC) and lateral corticospinal
tract (LCST) based on the assumption deduced from the literature that DC would
be more myelinated10-13.
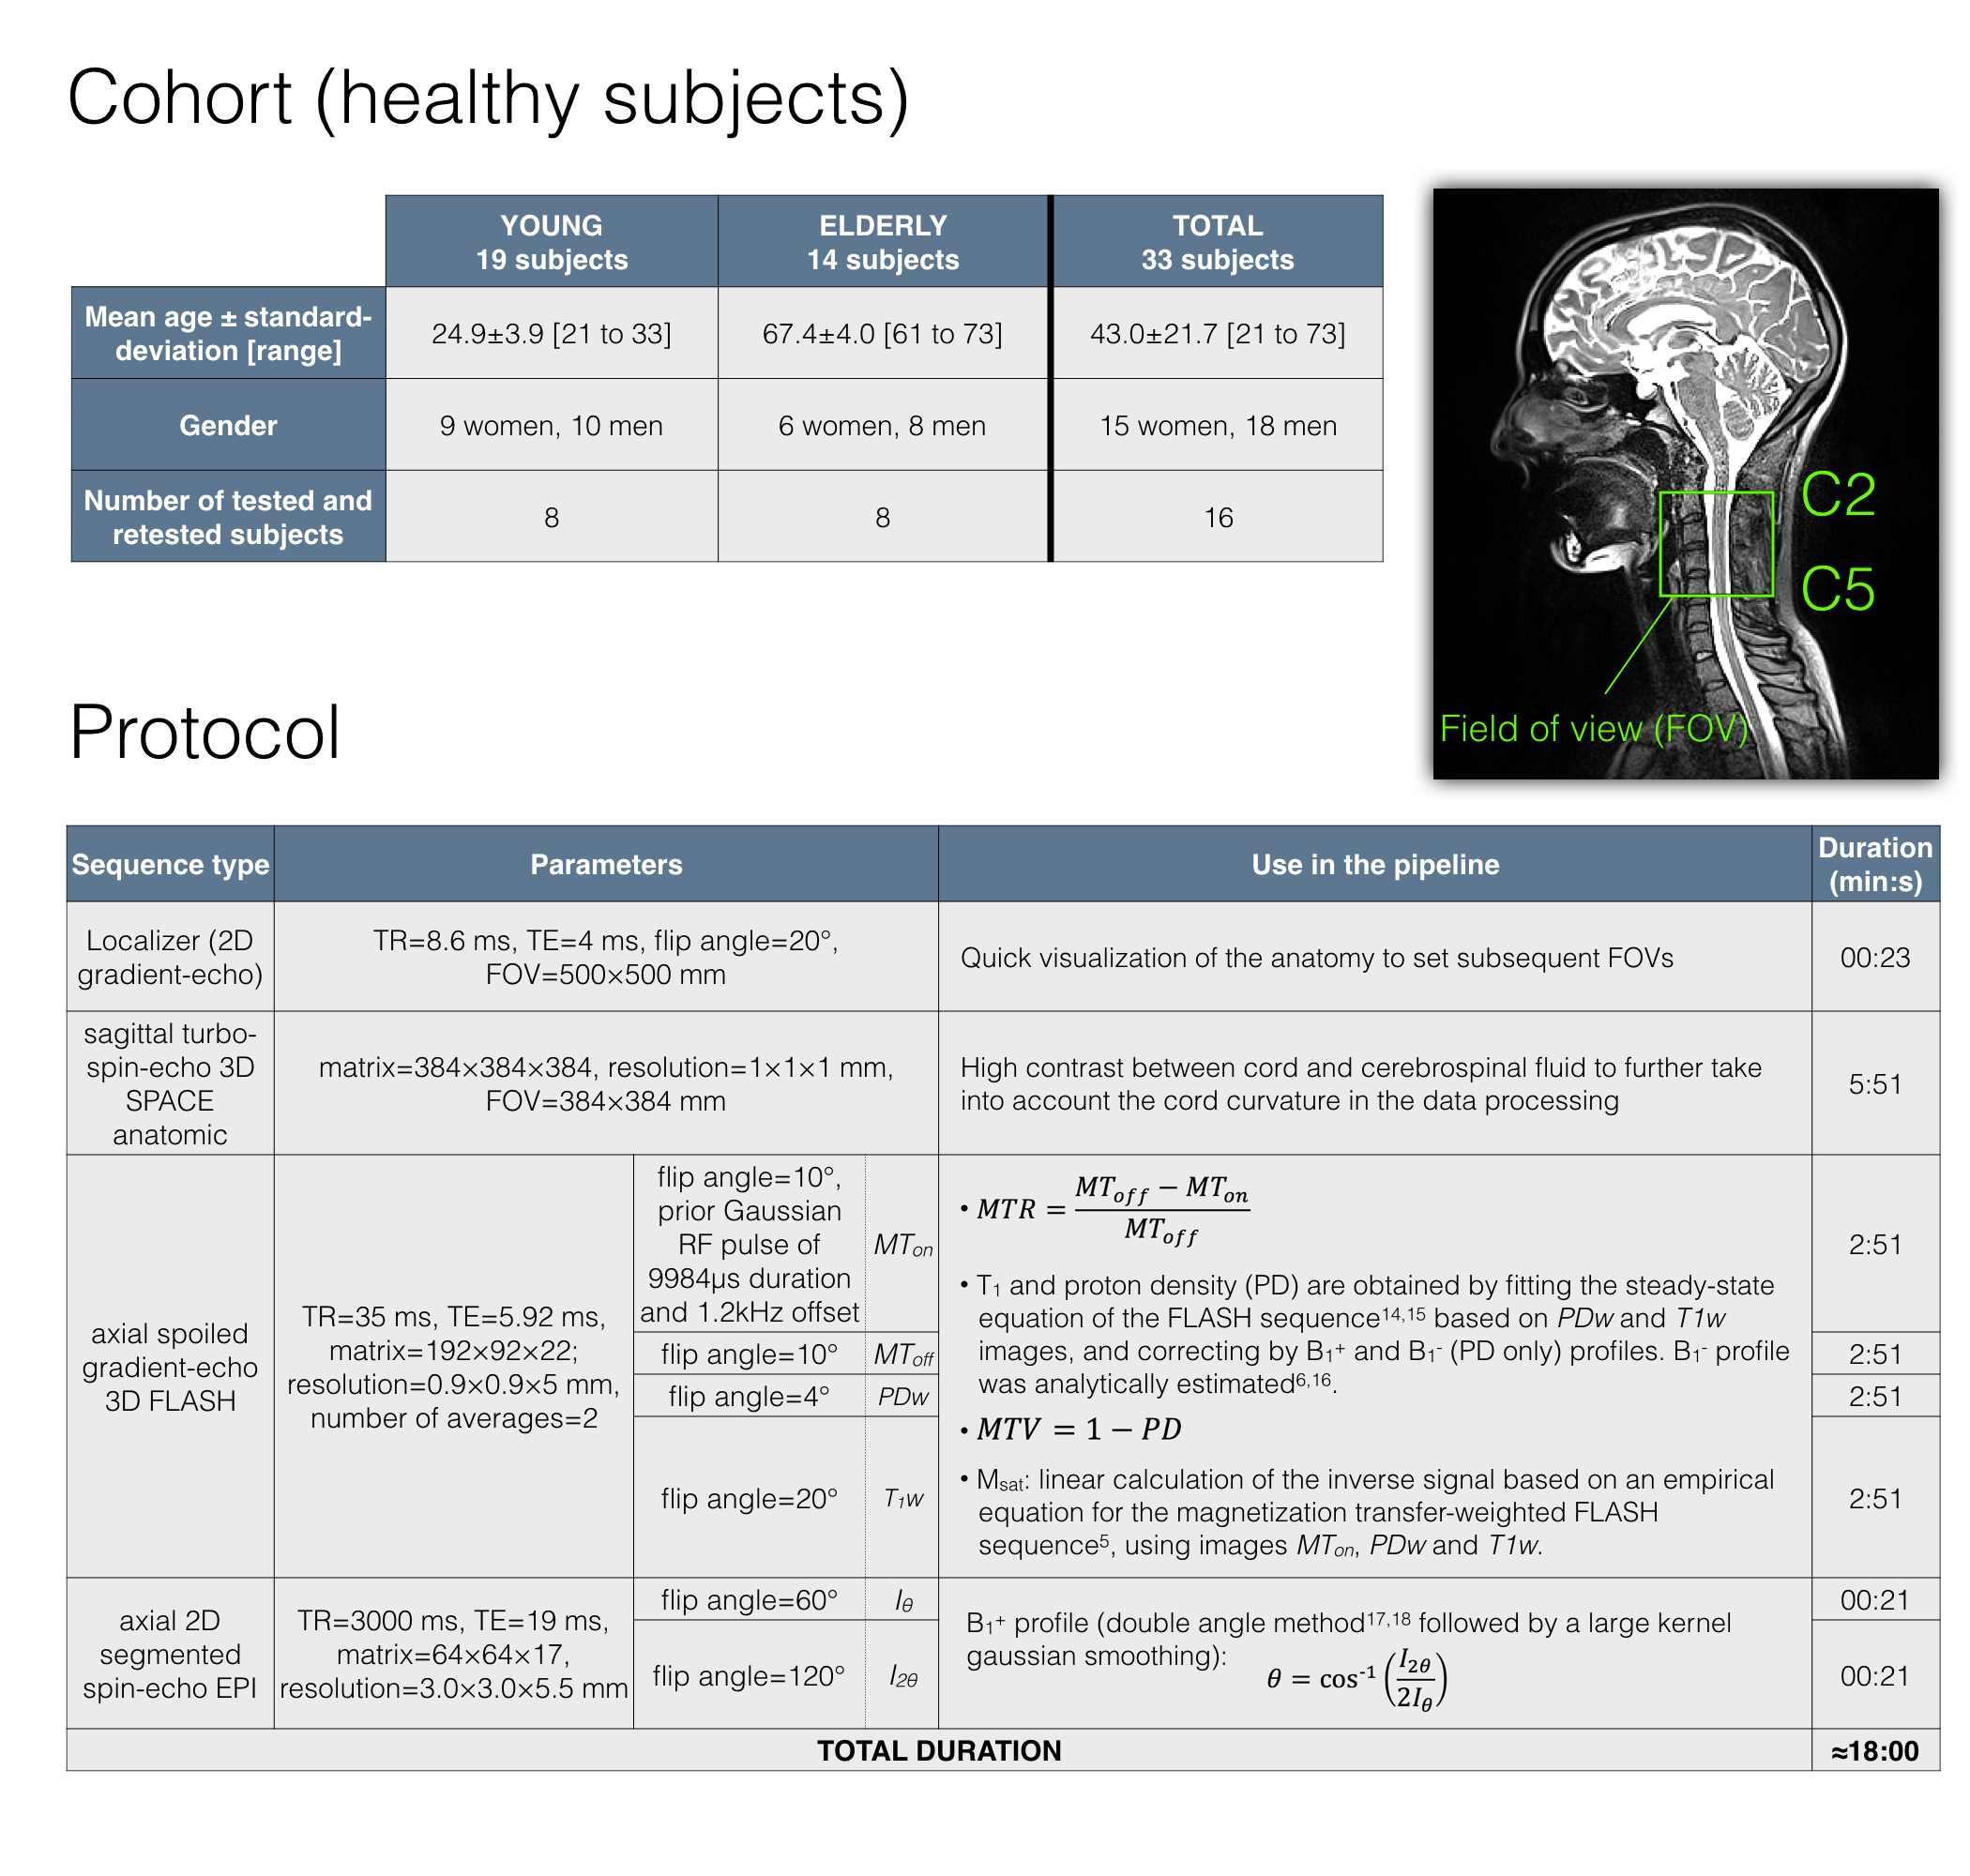
Methods
Data acquisition & processing. The cohort and acquisition protocol are described in Fig.1, along with the methods used to produce original metrics maps5,6,14-18. Among the 33 scanned subjects, 16 underwent the protocol twice to assess repeatability. Using the Spinal Cord Toolbox19, each metric was registered to the MNI-Poly-AMU template20 and its WM atlas21 according to a semi-automatic multi-step process: the anatomic image was used to take into account the cord curvature, while the gray matter segmentation on the MT-weighted image was used to properly register the atlas to the cord internal structure.
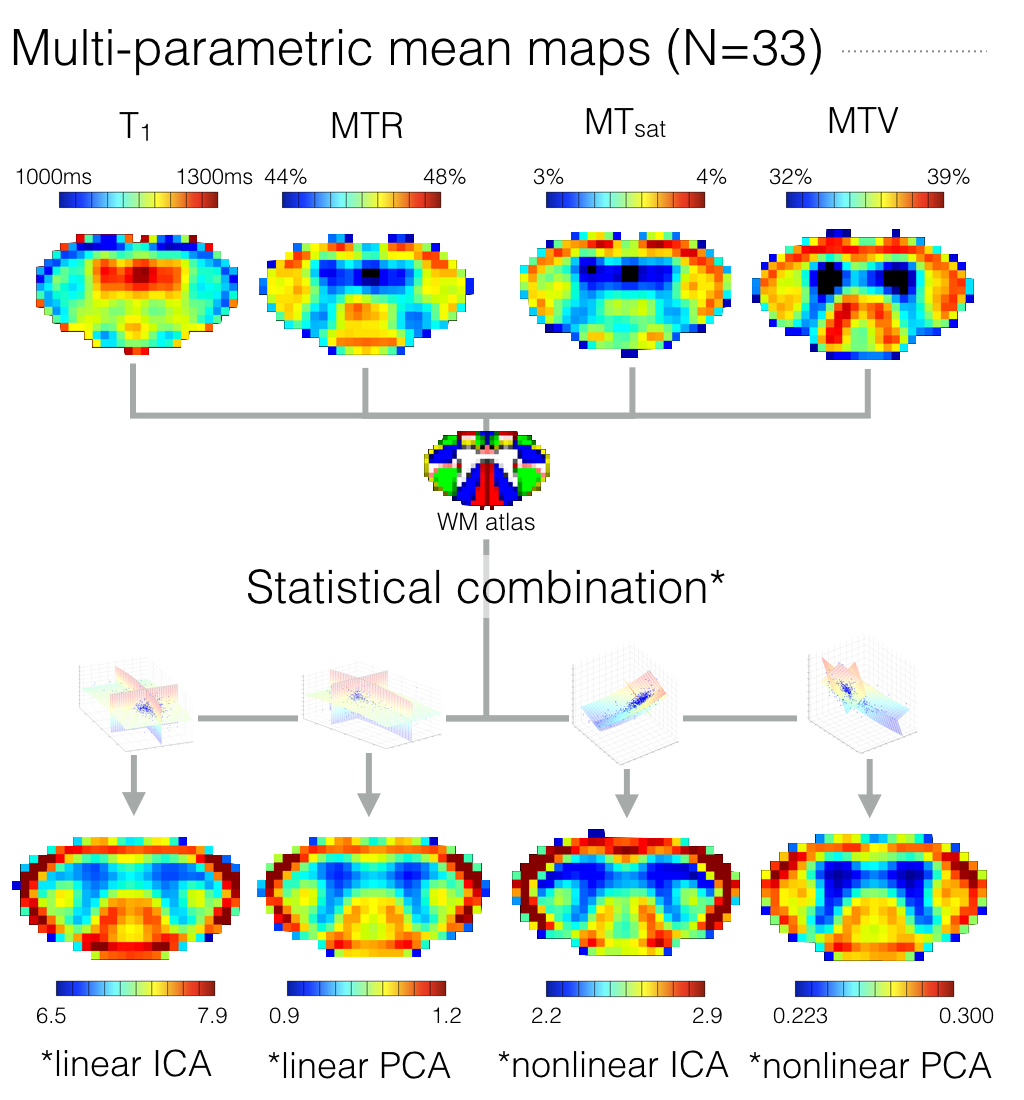
Metric combination. Four methods were compared. For each one, the combining transformation was estimated on all subjects’ metrics value quantified in the main WM tracts by slice, using a Maximum A Posteriori estimator22 to minimize the effects of noise and movements during acquisition, compared to a voxel-wise analysis. This transformation was then applied to each subject individually based on the values quantified within each tract by slice. Finally, the resultant values were reassigned to each tract according to their fractional volumes. These four methods differ in the way the combining transformation was estimated:
- a linear Independent Component Analysis (ICA) based on the FastICA algorithm23,24, which consists in a linear separation of the data into statistically independent components by non-Gaussianity maximization,
- a linear Principal Component Analysis (PCA), which consists in linearly separating the data into orthogonal components by maximizing their variance25,
- a nonlinear ICA based on the MISEP method26, which still maximizes the components independence but also integrates nonlinear mixtures of the components through a neural network,
- a nonlinear PCA minimizing the mean square error to fit a linear set of hyperbolic tangent functions through a neural network27.
Assuming that the common component between these metrics is related to myelin, only the component explaining the most variance in the original space is retained.
Results & Discussion
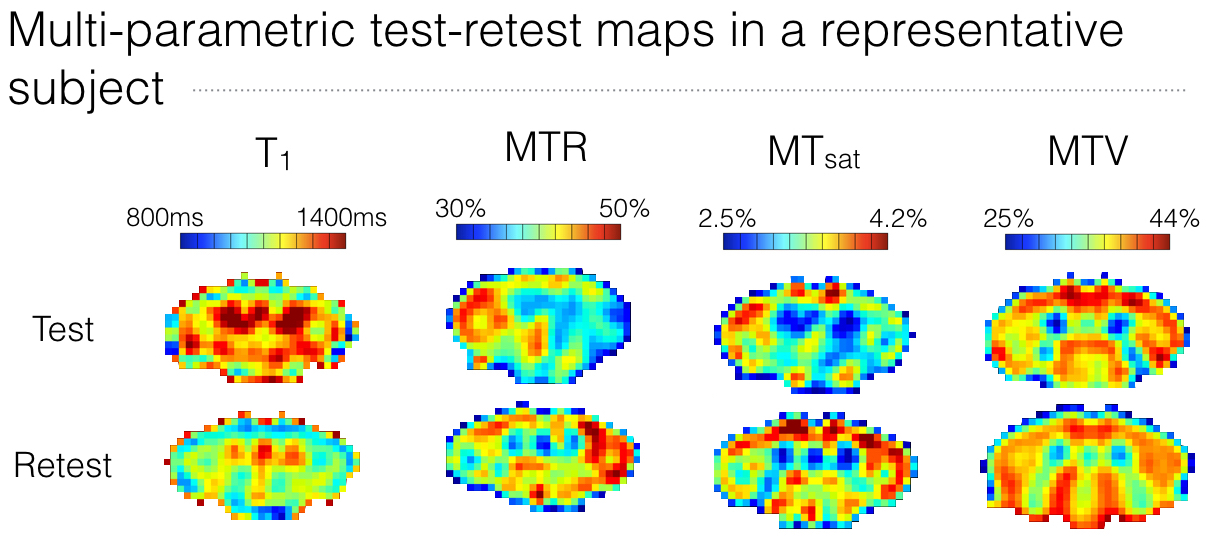
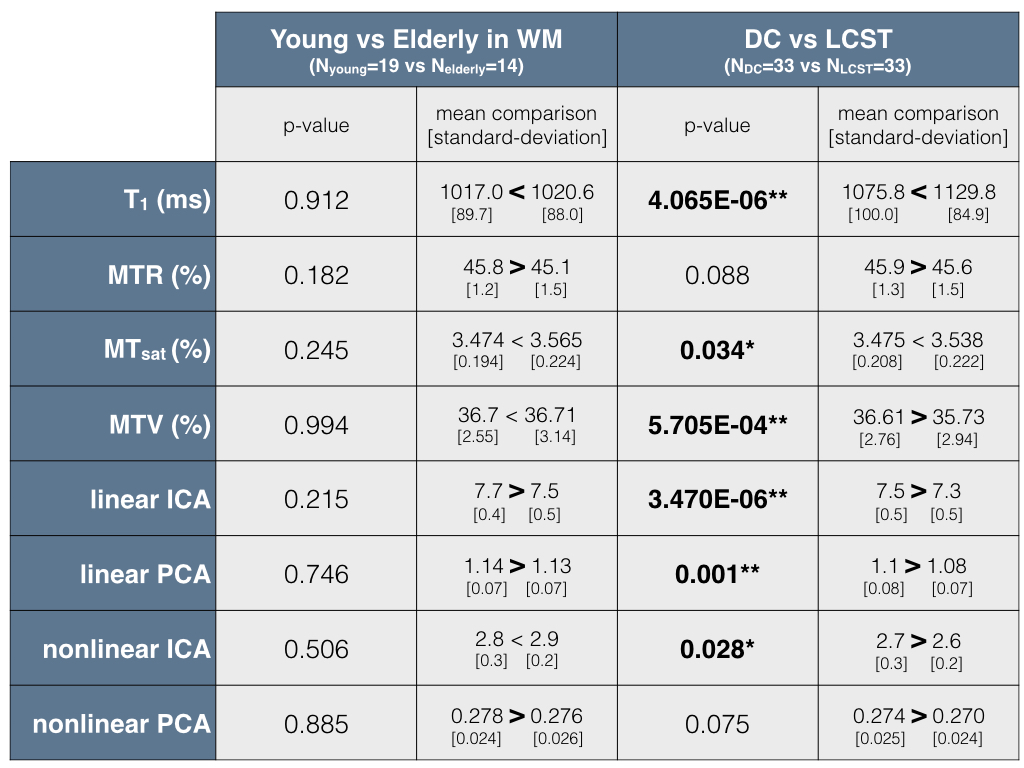
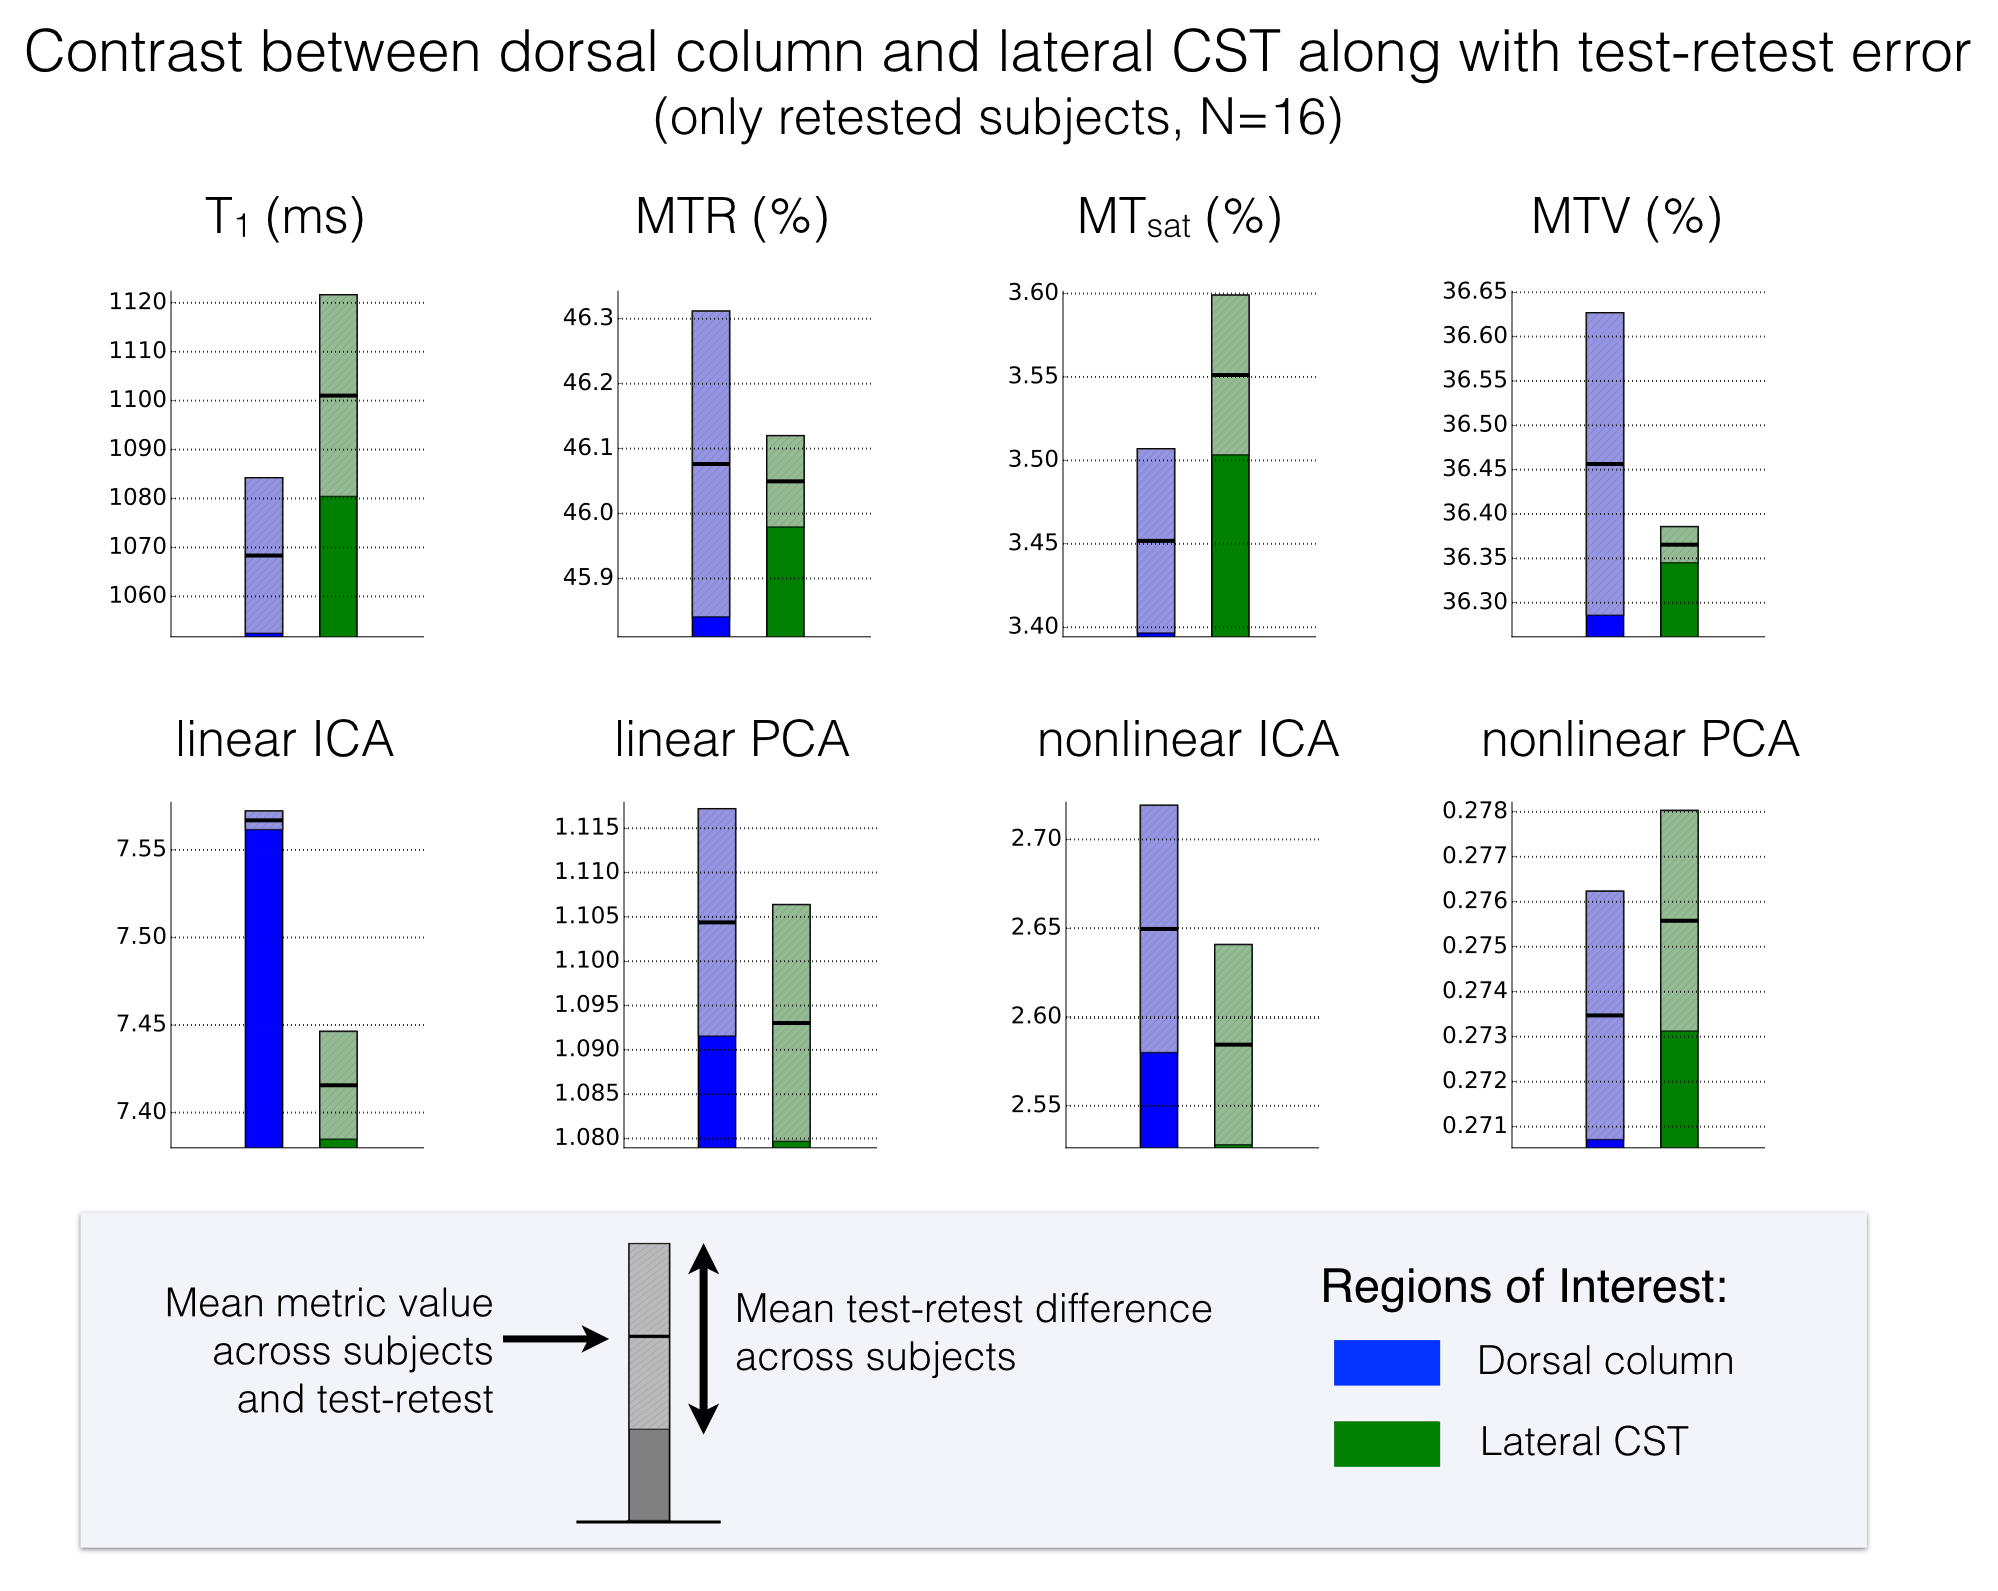
The test-retest repeatability of original metrics is poor (Fig.1), which compromises sensitivity and specificity to microstructural features. However, the average across subjects shows very symmetric maps likely to reflect the “true” cord microstructure (Fig.2), with different trends for different metrics. The metrics combination yields similar maps with all methods – supporting the hypothesis stating that the component explaining the most variance is related to myelin – with higher values in the DC relative to LCST. This observation is further statistically confirmed (Fig.3), suggesting a gain in sensitivity and/or specificity when combining metrics. Note also that all combination methods reveal a high values ring around the cord that cannot be due to partial volume effects with cerebrospinal fluid (would decrease the values). It could be attributed to the pia mater – made up of thick collagenous layers28 affecting original metrics in this way29-31 – or could be artefactual. The demyelination with aging cannot be observed by any metric (Fig.3), even though this has been observed histologically8-11. However, more atypical postures (mainly kyphotic) during acquisition were observed within elderly subjects, likely to compromise the data quality. Finally, linear ICA exhibits the best contrast between DC and LCST given its test-retest variability (Fig.4) while other approaches show low repeatability, questioning their necessity.Conclusion
Statistical data separation approaches to combine MRI metrics show promise for gaining sensitivity and specificity to microstructure. Linear approaches seem sufficient; ICA differentiates tracts despite its test-retest variability. Further work has to be handled to improve repeatability.Acknowledgements
This study was funded by the Canada Research Chair in Quantitative Magnetic Resonance Imaging (JCA), the Canadian Institute of Health Research [CIHR FDN-143263 and CIHR MOP-130341], the Canada Foundation for Innovation [32454], the Fonds de Recherche du Québec - Santé [28826], the Fonds de Recherche du Québec - Nature et Technologies [2015-PR-182754], the Natural Sciences and Engineering Research Council of Canada [435897-2013] and the Quebec BioImaging Network.References
1. Stüber, C. et al. Myelin and iron concentration in the human brain: A quantitative study of MRI contrast. NeuroImage 93, Part 1, 95-106, doi:http://dx.doi.org/10.1016/j.neuroimage.2014.02.026 (2014).
2. Schmierer, K., Scaravilli, F., Altmann, D. R., Barker, G. J. & Miller, D. H. Magnetization transfer ratio and myelin in postmortem multiple sclerosis brain. Annals of Neurology 56, 407-415, doi:10.1002/ana.20202 (2004).
3. Mottershead, J. P. et al. High field MRI correlates of myelin content and axonal density in multiple sclerosis. Journal of Neurology 250, 1293-1301, doi:10.1007/s00415-003-0192-3 (2003).
4. Schmierer, K. et al. Quantitative magnetization transfer imaging in postmortem multiple sclerosis brain. Journal of Magnetic Resonance Imaging 26, 41-51, doi:10.1002/jmri.20984 (2007).
5. Helms, G., Dathe, H., Kallenberg, K. & Dechent, P. High-resolution maps of magnetization transfer with inherent correction for RF inhomogeneity and T1 relaxation obtained from 3D FLASH MRI. Magnetic Resonance in Medicine 60, 1396-1407, doi:10.1002/mrm.21732 (2008).
6. Mezer, A. et al. Quantifying the local tissue volume and composition in individual brains with magnetic resonance imaging. Nat Med 19, 1667-1672, doi:10.1038/nm.3390 http://www.nature.com/nm/journal/v19/n12/abs/nm.3390.html - supplementary-information (2013).
7. Mangeat, G., Govindarajan, S. T., Mainero, C. & Cohen-Adad, J. Multivariate combination of magnetization transfer, T2* and B0 orientation to study the myelo-architecture of the in vivo human cortex. NeuroImage 119, 89-102, doi:http://dx.doi.org/10.1016/j.neuroimage.2015.06.033 (2015).
8. Tang, Y., Nyengaard, J. R., Pakkenberg, B. & Gundersen, H. J. G. Age-Induced White Matter Changes in the Human Brain: A Stereological Investigation. Neurobiology of Aging 18, 609-615, doi:http://dx.doi.org/10.1016/S0197-4580(97)00155-3 (1997).
9. Nakanishi, R. et al. Morphometric Analyses of Axons in the Human Lateral Corticospinal Tract: Cervical/Lumbar Level Comparison and Relation to the Ageing Process. Okajimas Folia Anatomica Japonica 81, 1-4, doi:10.2535/ofaj.81.1 (2004).
10. Ohnishi, A., O'Brien, P. C., Okazaki, H. & Dyck, P. J. Morphometry of myelinated fibers of fasciculus gracilis of man. Journal of the Neurological Sciences 27, 163-172, doi:http://dx.doi.org/10.1016/0022-510X(76)90058-7 (1976).
11. Terao, S.-i., Sobue, G., Hashizume, Y., Shimada, N. & Mitsuma, T. Age-related changes of the myelinated fibers in the human corticospinal tract: a quantitative analysis. Acta Neuropathol 88, 137-142, doi:10.1007/BF00294506 (1994).
12. Brown, L., Jr. Projections and termination of the corticospinal tract in rodents. Experimental Brain Research 13, 432-450, doi:10.1007/BF00234340 (1971).
13. Nieuwenhuys, R., Voogd, J. & van Huijzen, C. Topography of spinal cord, brain stem and cerebellum. The Human Central Nervous System, 177-245 (2008).
14. Ganter, C. Steady state of gradient echo sequences with radiofrequency phase cycling: Analytical solution, contrast enhancement with partial spoiling. Magnetic Resonance in Medicine 55, 98-107, doi:10.1002/mrm.20736 (2006).
15. Heule, R., Ganter, C. & Bieri, O. Variable flip angle T1 mapping in the human brain with reduced t2 sensitivity using fast radiofrequency-spoiled gradient echo imaging. Magnetic Resonance in Medicine, n/a-n/a, doi:10.1002/mrm.25668 (2015).
16. Mezer, A., Rokem, A., Berman, S., Hastie, T. & Wandell, B. A. Evaluating quantitative proton-density-mapping methods. Human Brain Mapping 37, 3623-3635, doi:10.1002/hbm.23264 (2016).
17. Insko, E. & Bolinger, L. in Proceedings of the 11th Annual Meeting of SMRM, Berlin, Germany. 4302.
18. Stollberger, R. & Wach, P. Imaging of the active B1 field in vivo. Magnetic Resonance in Medicine 35, 246-251, doi:10.1002/mrm.1910350217 (1996).
19. De Leener, B. et al. SCT: Spinal Cord Toolbox, an open-source software for processing spinal cord MRI data. NeuroImage, doi:http://dx.doi.org/10.1016/j.neuroimage.2016.10.009 (2016).
20. Fonov, V. S. et al. Framework for integrated MRI average of the spinal cord white and gray matter: The MNI–Poly–AMU template. NeuroImage 102, Part 2, 817-827, doi:http://dx.doi.org/10.1016/j.neuroimage.2014.08.057 (2014).
21. Lévy, S. et al. White matter atlas of the human spinal cord with estimation of partial volume effect. NeuroImage 119, 262-271, doi:http://dx.doi.org/10.1016/j.neuroimage.2015.06.040 (2015).
22. Cohen-Adad, J., Lévy, S. & Avants, B. in ISMRM 23rd Annual Meeting & Exhibition.
23. Hyvarinen, A. Fast and robust fixed-point algorithms for independent component analysis. IEEE Transactions on Neural Networks 10, 626-634, doi:10.1109/72.761722 (1999).
24. Hyvärinen, A. & Oja, E. Independent component analysis: algorithms and applications. Neural Networks 13, 411-430, doi:http://dx.doi.org/10.1016/S0893-6080(00)00026-5 (2000).
25. Jolliffe, I. in Wiley StatsRef: Statistics Reference Online (John Wiley & Sons, Ltd, 2014).
26. Almeida, L. s. B. Linear and nonlinear ICA based on mutual information—the MISEP method. Signal Processing 84, 231-245, doi:http://dx.doi.org/10.1016/j.sigpro.2003.10.008 (2004).
27. Scholz, M., Kaplan, F., Guy, C. L., Kopka, J. & Selbig, J. Non-linear PCA: a missing data approach. Bioinformatics 21, 3887-3895, doi:10.1093/bioinformatics/bti634 (2005).
28. Standring, S. Gray's Anatomy: The Anatomical Basis of Clinical Practice, Expert Consult - 40th Edition. (2008).
29. Menezes, N. M., Gray, M. L., Hartke, J. R. & Burstein, D. T2 and T1ρ MRI in articular cartilage systems. Magnetic Resonance in Medicine 51, 503-509, doi:10.1002/mrm.10710 (2004).
30. Stikov, N. et al. Cross-relaxation imaging of human articular cartilage. Magnetic Resonance in Medicine 66, 725-734, doi:10.1002/mrm.22865 (2011).
31. Kim, D. K., Ceckler, T. L., Hascall, V. C., Calabro, A. & Balaban, R. S. Analysis of water-macromolecule proton magnetization transfer in articular cartilage. Magnetic Resonance in Medicine 29, 211-215, doi:10.1002/mrm.1910290209 (1993).
Figures