0913
Quantitative measurement of myelin in distinct pathways of the spinal cord: Implications for assessing neuropathic pain after spinal cord injury1Physics, University of British Columbia, Vancouver, BC, Canada, 2International Collaboration on Repair Discoveries, Vancouver, BC, Canada, 3Medicine, University of British Columbia, Vancouver, BC, Canada, 4UBC Hospital, University of British Columbia, Vancouver, BC, Canada, 5Kinesiology, University of British Columbia, Vancouver, BC, Canada, 6Radiology, University of British Columbia, Vancouver, BC, Canada, 7Pathology and Laboratory Medicine, University of British Columbia, BC, Canada
Synopsis
Neuropathic pain is common in people with spinal cord injury (SCI). To better understand the type and severity of damage
Introduction
Neuropathic pain is a complex chronic pain that comes from damage to the nervous system and is often reported after spinal cord injury (SCI). However, not all people with SCI have neuropathic pain and why two people with seemingly identical injuries feel pain differently is largely unknown. In the spinal cord, ascending pathways of dorsal columns and spinothalamic tracts convey sensory information to the brain.1 After SCI, sensory impairments specific to these damaged pathways emerge and diffuse spinal cord damage can also lead to below-level neuropathic pain.2 The type and severity of damage in the spinal cord associated with neuropathic pain is poorly understood. A major limitation with assessing the relationship between pain and structural damage is a lack of quantitative magnetic resonance imaging (MRI) techniques that can differentiate central nervous system (CNS) microstructure and characterize damage in distinct spinal cord pathways. In our study, we used myelin water imaging (MWI), a validated MRI method specific to myelin3,4, to examine spinal cord microstructure. Our goal was to measure and compare the myelin content of different pathways in the spinal cord of both healthy and SCI subjects.Method
Subjects: 19 healthy controls (mean age 32 years, range 20-69 years) and 3 subjects with SCI (injury severity according to American Spinal Injury Association (ASIA) guidelines: 2 complete (traumatic, ASIA A) and 1 incomplete (non-traumatic, ASIA D)) with neuropathic pain (mean age 48 years, range 33-65 years) were recruited to the study.
MRI: Subjects were scanned on a 3.0T MRI system (Philips, Best, The Netherlands) with a phased array spine coil. MRI data included cervical cord myelin water imaging (3D gradient and spin echo (GRASE), 32-echo, TE/TR=10/1500ms, 8 axial slices, resolution= 0.6x0.6x5mm3).5 The stack was centered at the level between C2 and C3.
Myelin Water Fraction: Voxel-wise T2 decay curve analysis was performed using non negative least squares with the extended phase graph algorithm to estimate the refocusing flip angle in each voxel as well as correcting the T2 decay curve for stimulated echo artifacts.6 Myelin water fraction (MWF) was defined as the fractional signal with T2 less than 40ms, attributed to signal from the water trapped between myelin bilayers.
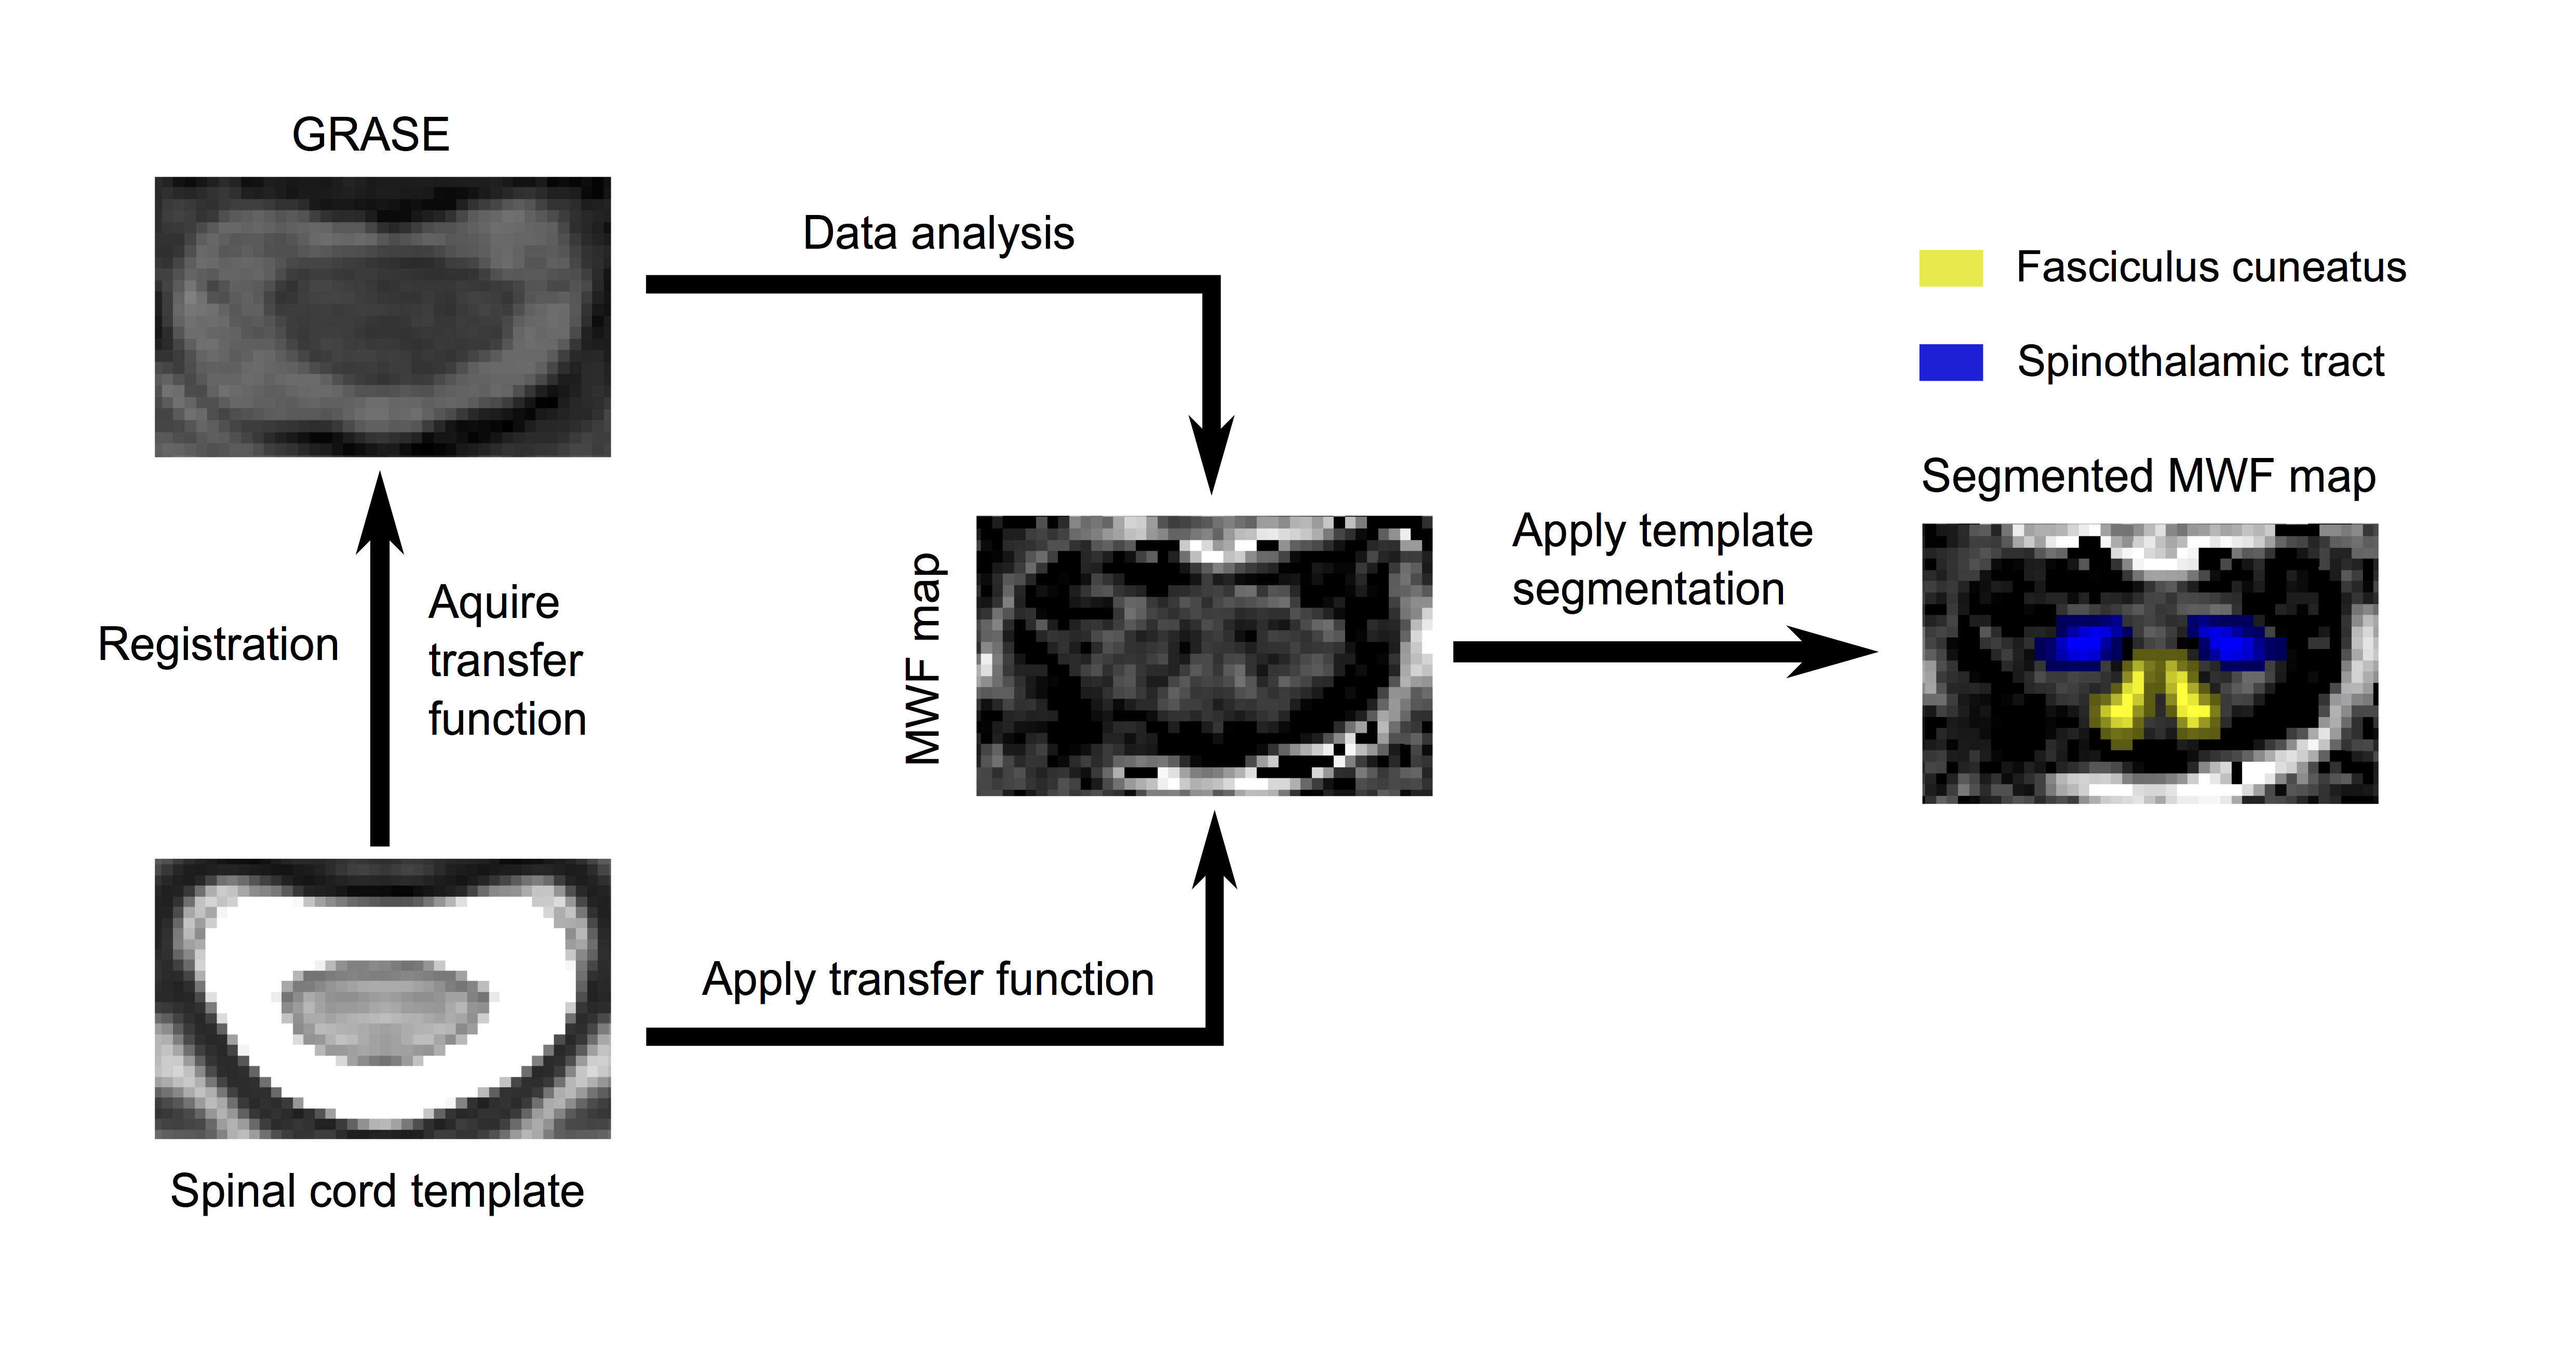
Data analysis: The MNI-POLY-AMU template in the Spinal Cord Toolbox7 was registered to MR images from the GRASE acquisition, to obtain regions of interest (ROIs) including the dorsal columns (fasciculus gracilis and cuneatus), spinothalamic tract, total white matter, total grey matter, and whole cord. After automatic segmentation, ROIs were registered to the MWF map and MWF values were extracted from different ROIs. The analysis workflow is depicted in Figure 1. Statistical analysis used a one-way ANOVA to test differences in all pathways, a paired t-test to examine differences in MWF between different pathways in controls, and an unpaired t-test between control and SCI subjects.
Results
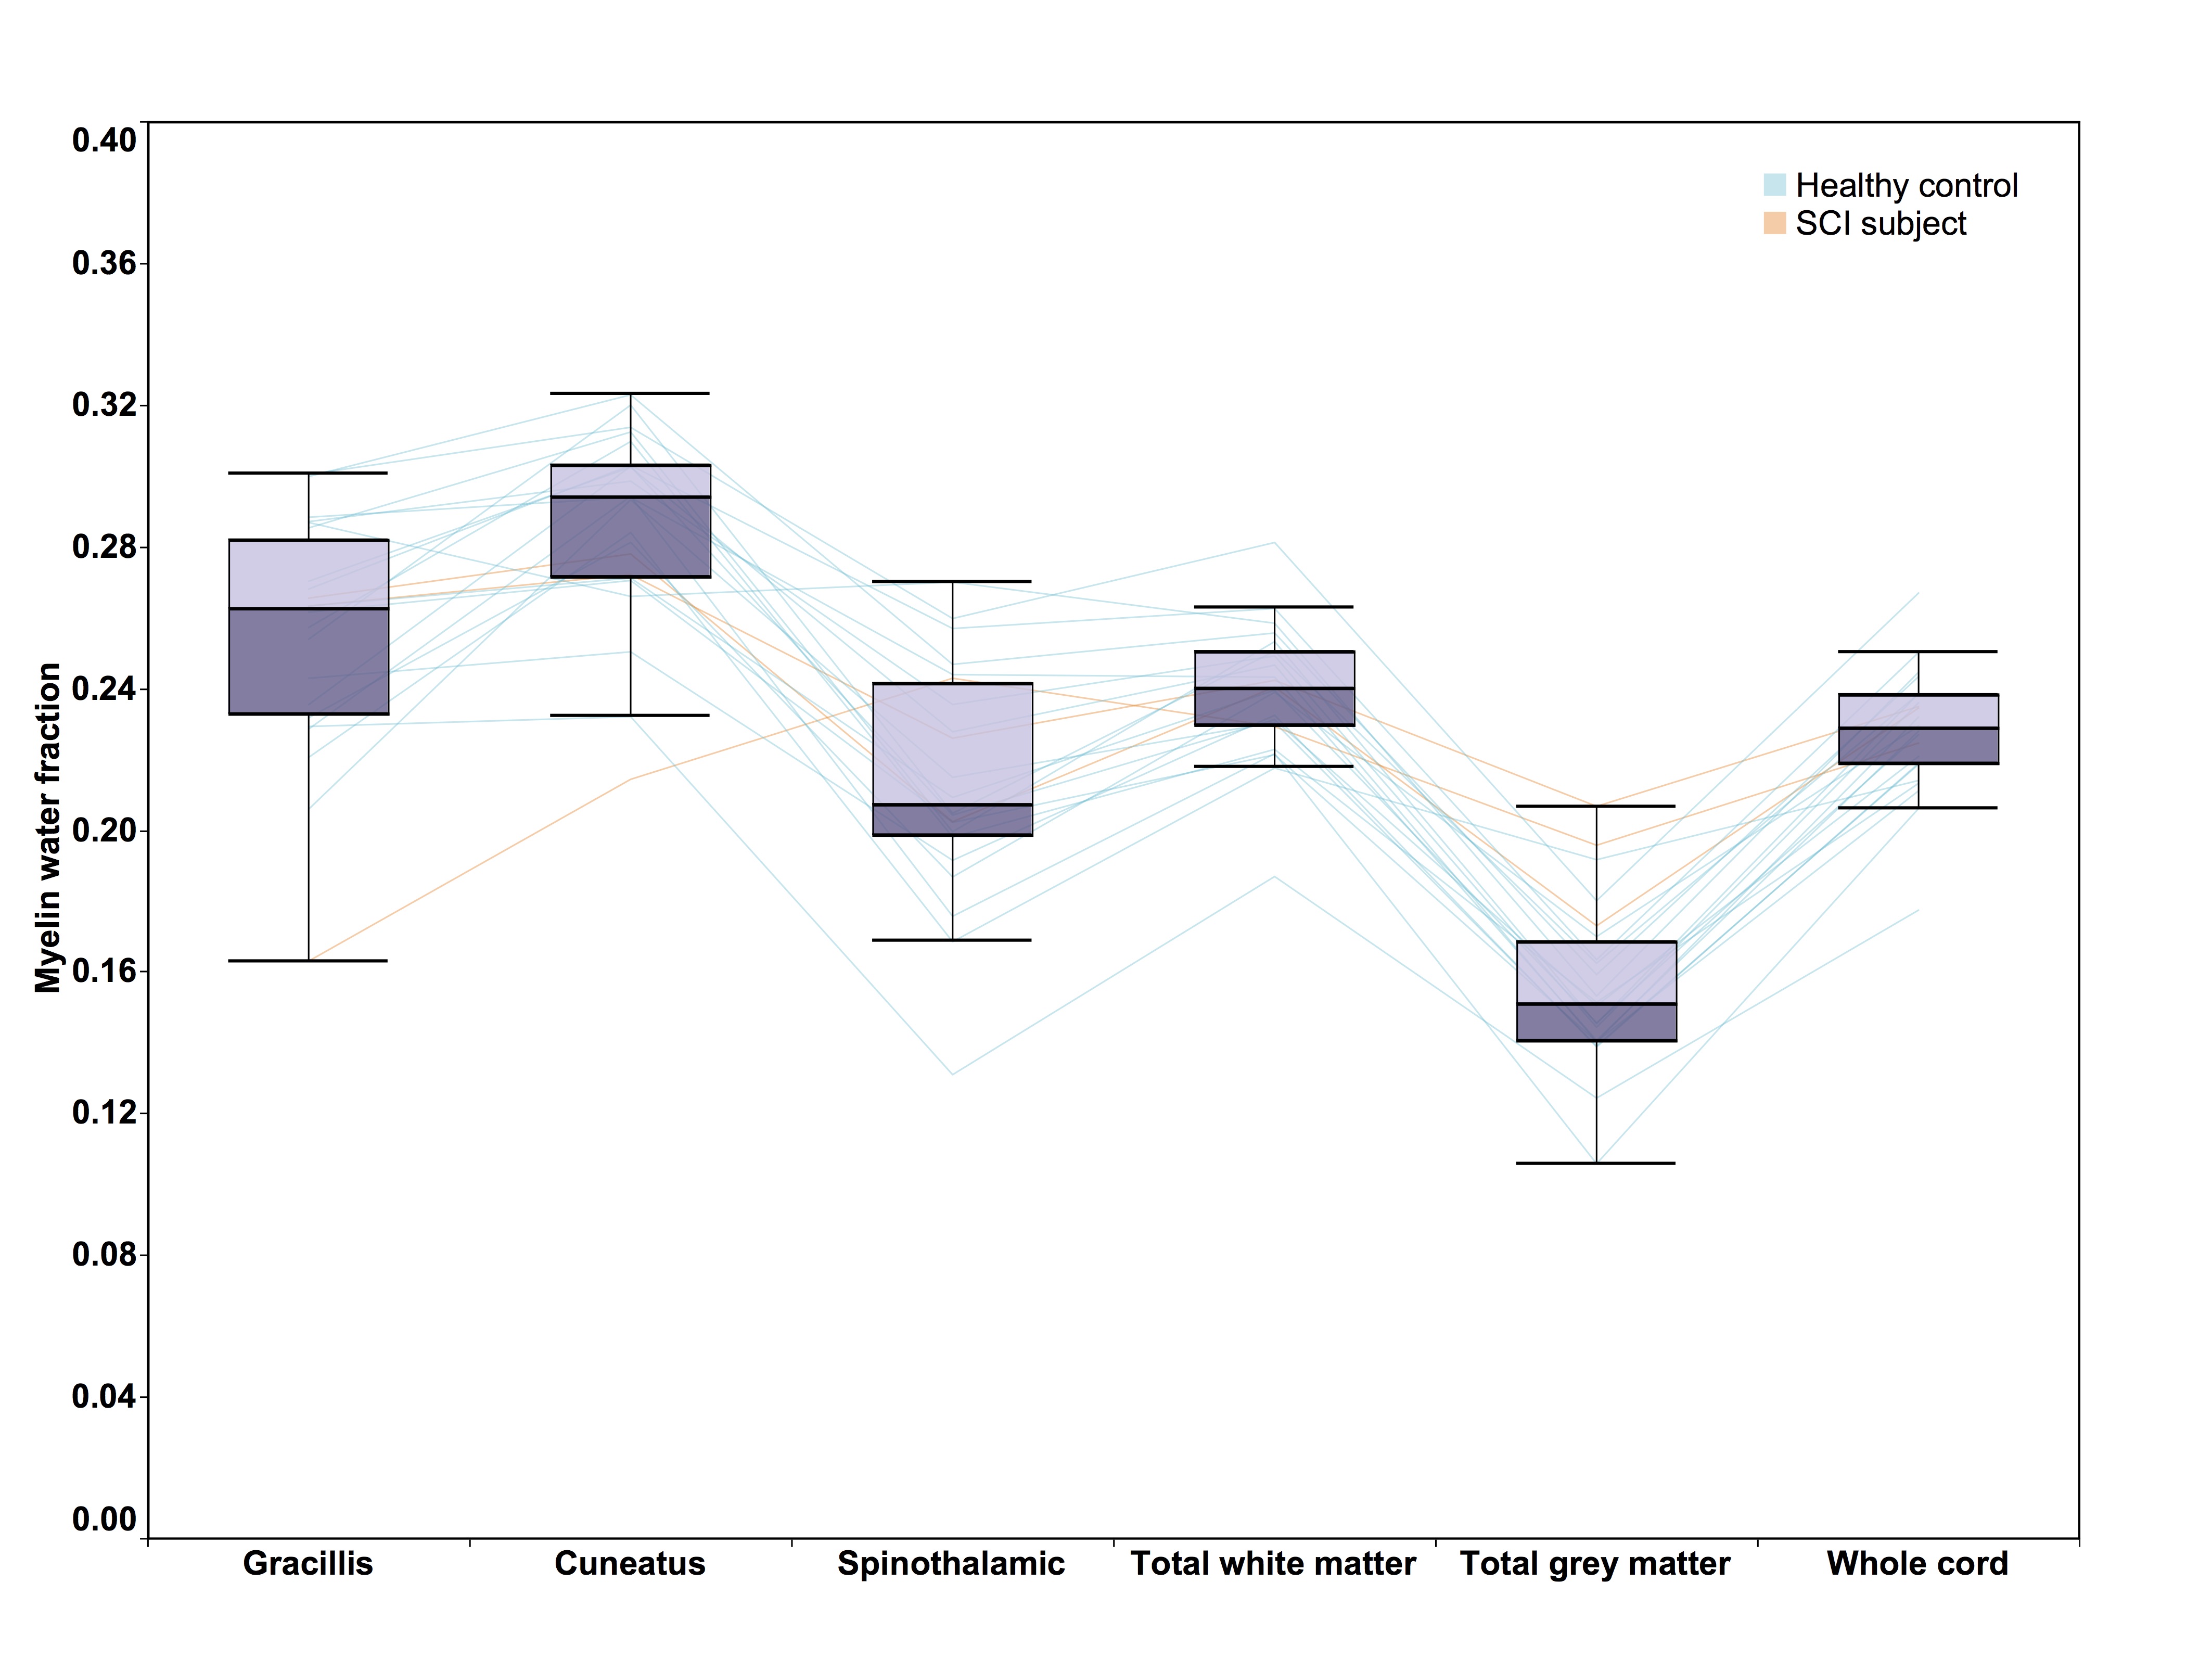
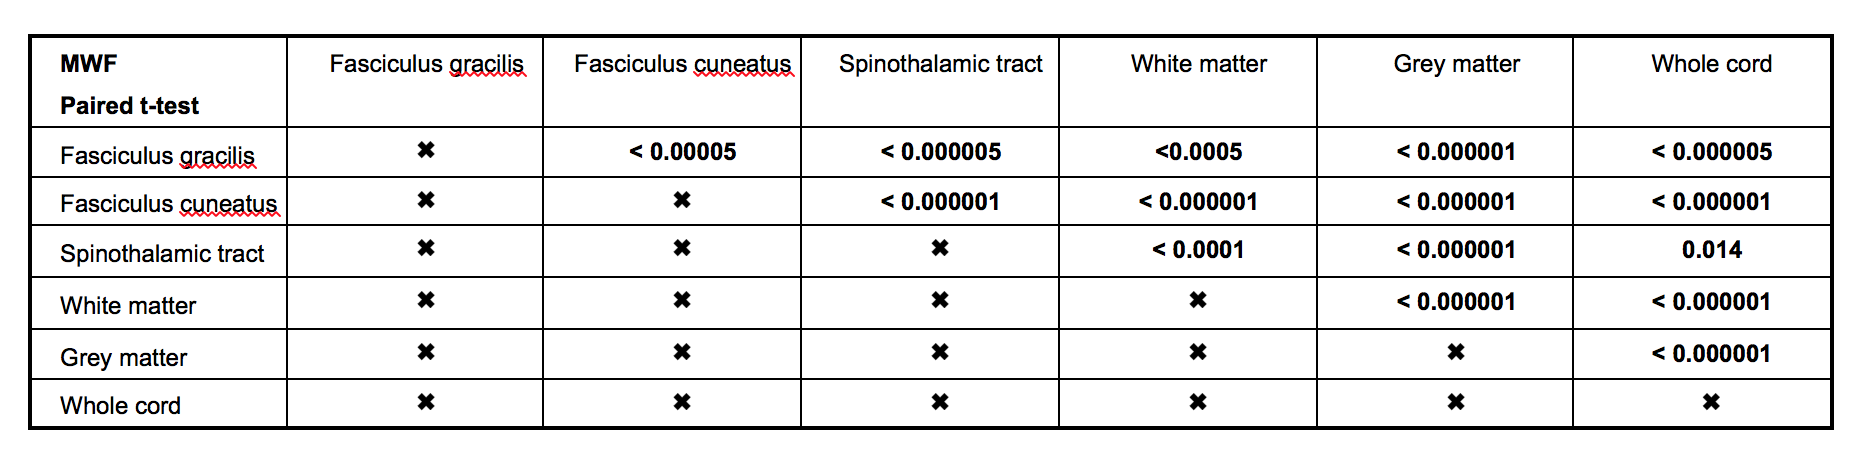
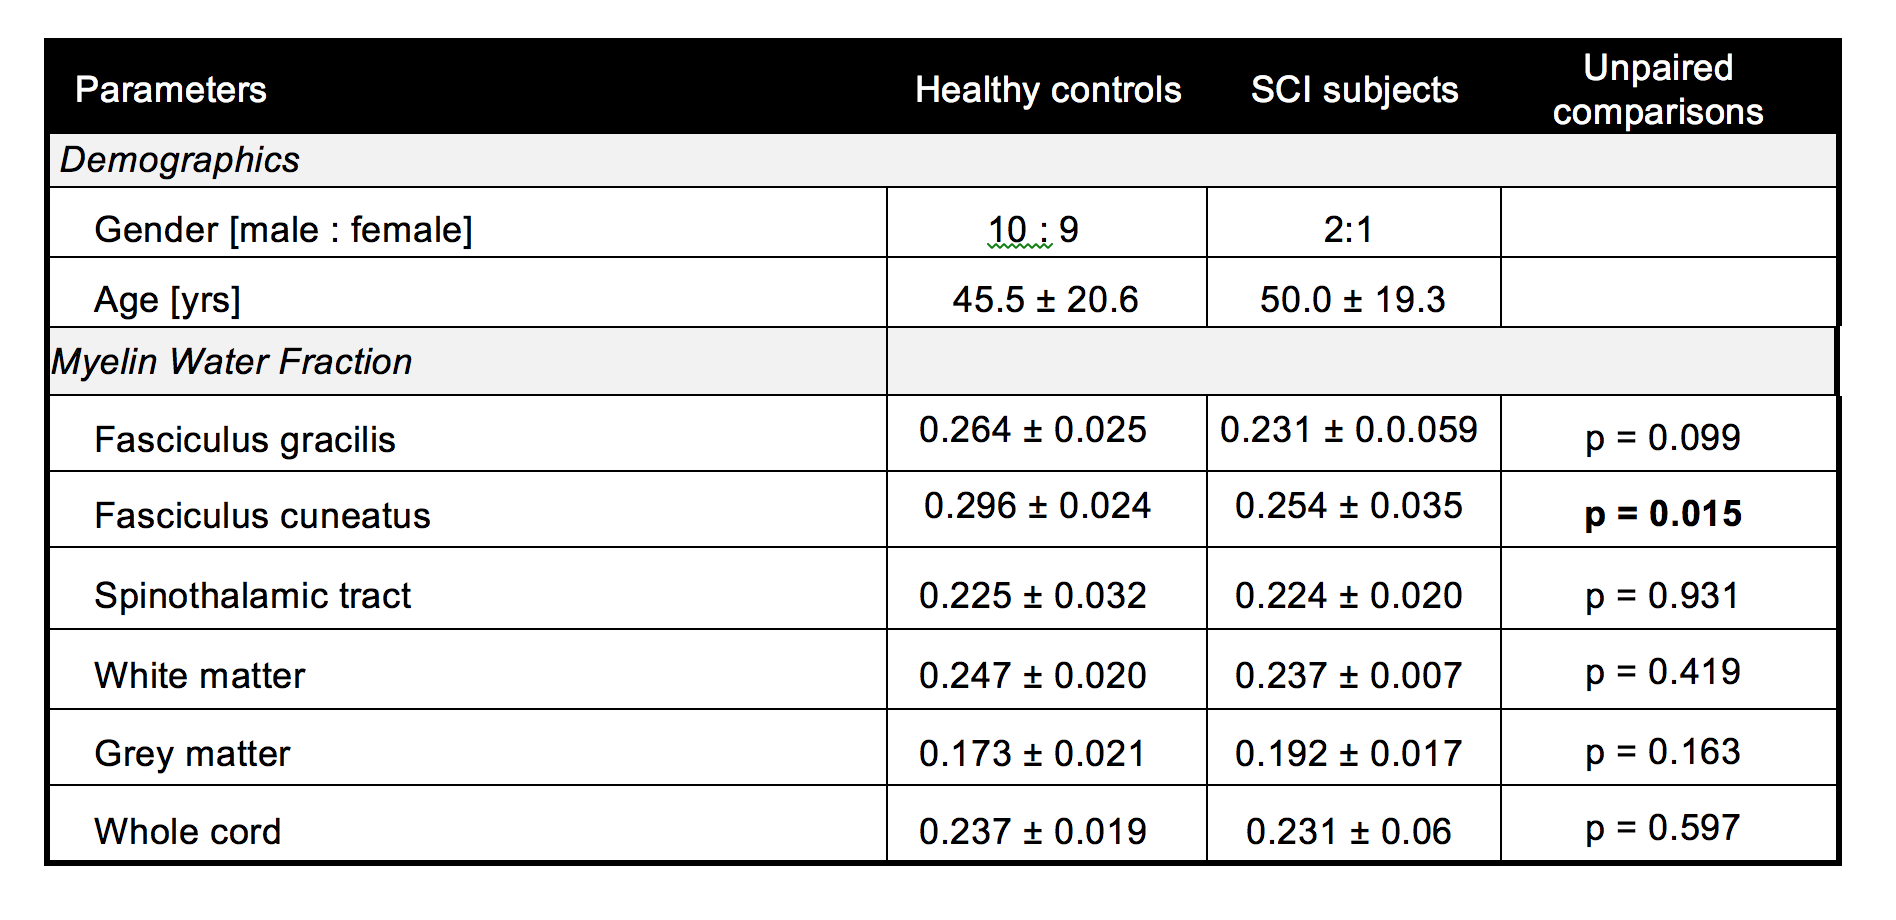
MWF of different pathways from all subjects followed a similar pattern as shown in Figure 2. It was found that different pathways can be differentiated (one-way ANOVA, F=56.415, p<0.000001) using MWF in controls. In particular, MWF of controls was significantly higher (all p<0.000005) in the dorsal columns (mean fasciculus gracilis=0.264±0.026 and fasciculus cuneatus=0.296±0.024) compared to the spinothalamic tract (0.225±0.032). Pairwise comparisons (paired t-test) of MWF values between different pathways in healthy controls are summarized in Table 1. Results of tract specific MWF measures of both control and SCI subjects are summarized in Table 2. SCI subjects showed a significantly reduced MWF in the fasciculus cuneatus relative to controls (0.254±0.035 vs. 0.296±0.024, p=0.015) and a trend for reduced MWF in the fasciculus gracilis (0.231±0.059 vs. 0.264±0.025, p=0.099).Conclusion
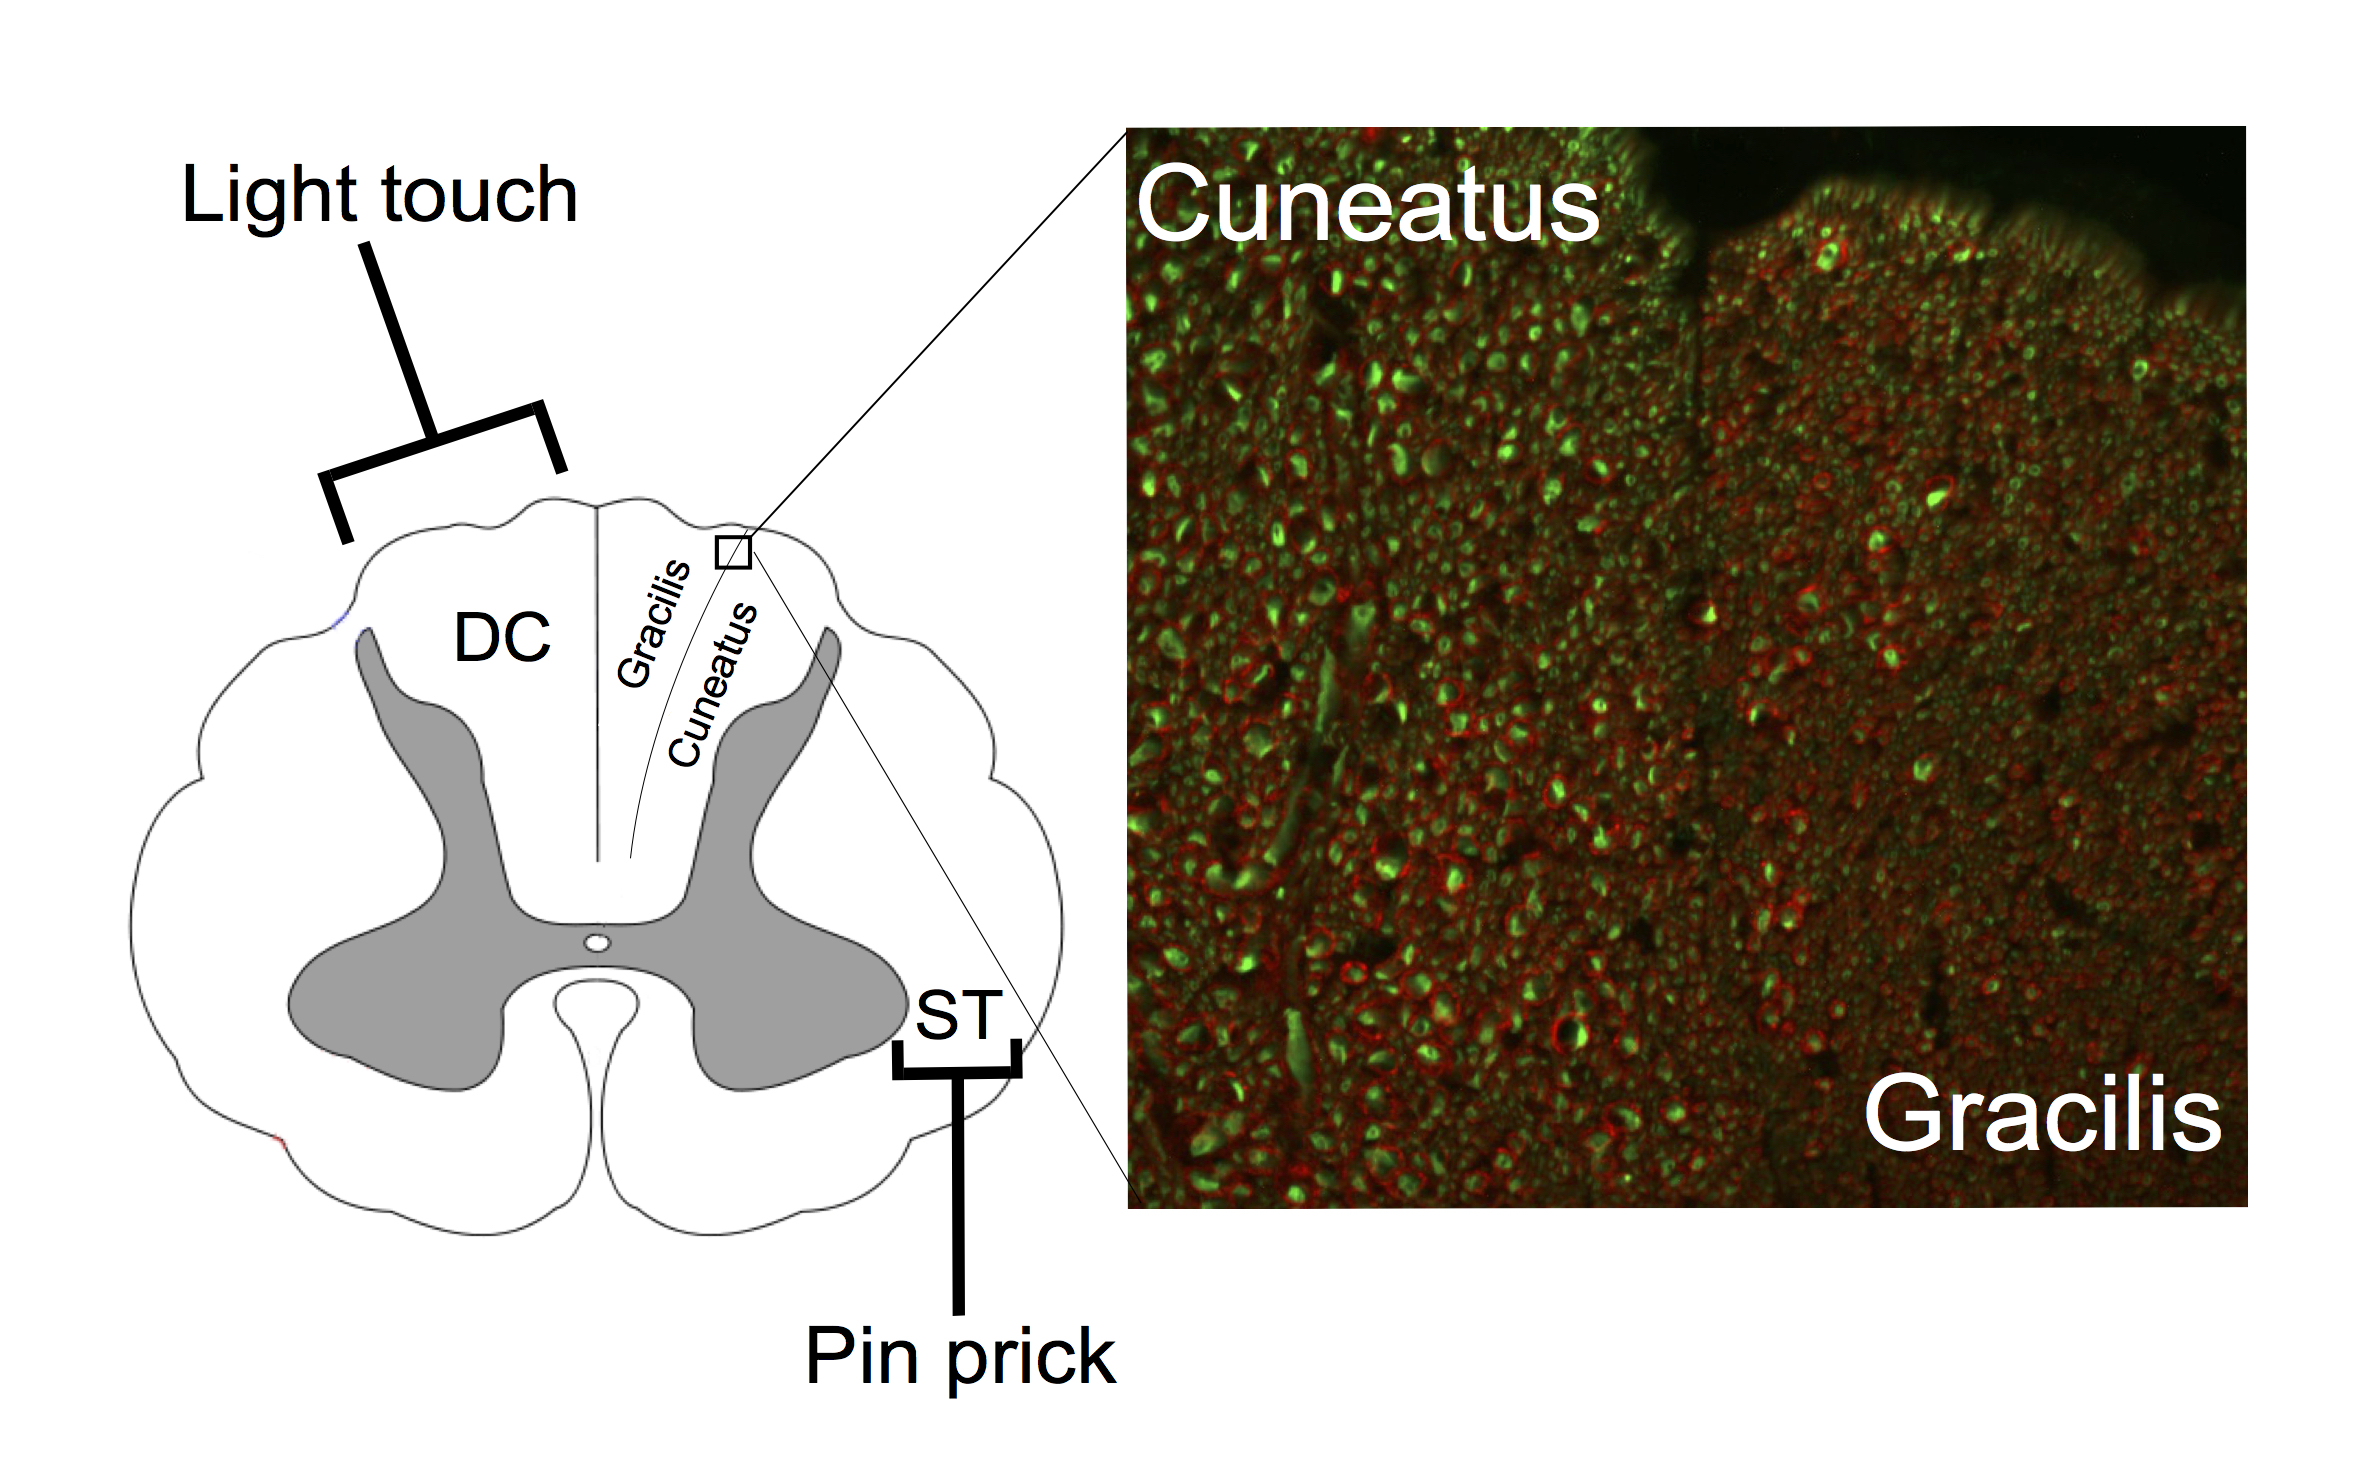
In line with well-known anatomical characteristics, we observed robust differences in MWF in discrete ascending spinal cord pathways, which agrees with histology findings in Figure 3 (unpublished work in rat spinal cord), and other MRI studies8,9 in the brainstem. Our preliminarily SCI data showed a significant 14.2% reduction of myelin water in the cuneatus and trend for a 12.5% reduction in myelin of the gracilis in SCI subjects, both of which transmit sensory information such as touch, pressure, vibration, and proprioception and are compromised in people with SCI. These results provide in vivo validation of MWF to assess subtle differences in myelin content and demonstrate the potential application of automatic spinal cord segmentation. Future studies applied in individuals with SCI can use MWI combined with pathway based analysis to examine the relationship between the patterns of damage in central afferent pathways and neuropathic pain.Acknowledgements
We sincerely thank the study participants and MRI technologists at our centre. Funding support was provided by a seed grant from the International Collaboration On Repair Discoveries.References
1. Hains DE, ed. Neuroanatomy. an atlas of structures, sections and systems 7th ed. New York: Lippincott Williams & Wilkins; 2007.
2. Siddall PJ, Taylor DA, Cousins MJ. Classification of pain following spinal cord injury. Spinal Cord. 1997;35(2):69-75.
3. Laule C, Leung E, Lis DK, et al. Myelin water imaging in multiple sclerosis: Quantitative correlations with histopathology. Mult Scler. 2006;12(6):747-753.
4. Laule C, Kozlowski P, Leung E, Li DK, Mackay AL, Moore GR. Myelin water imaging of multiple sclerosis at 7 T: Correlations with histopathology. Neuroimage. 2008;40(4):1575-1580.
5. Ljungberg E, Vavasour I, Tam R, et al. Rapid myelin water imaging in human cervical spinal cord. Proc. Intl. Soc. Mag. Reson. Med.
6. Prasloski T, Mädler B, Xiang Q, MacKay A, Jones C. Applications of stimulated echo correction to multicomponent T2 analysis. Magnetic Resonance in Medicine. 2012;67(6):1803-1814.
7. De Leener B, Levy S, Dupont SM, et al. SCT: Spinal cord toolbox, an open-source software for processing spinal cord MRI data. Neuroimage. 2016.
8. Hong JH, Son SM, Jang SH. Identification of spinothalamic tract and its related thalamocortical fibers in human brain. Neurosci Lett. 2010;468(2):102-105.
9. Kamali A, Kramer LA, Butler IJ, Hasan KM. Diffusion tensor tractography of the somatosensory system in the human brainstem: Initial findings using high isotropic spatial resolution at 3.0 T. Eur Radiol. 2009;19(6):1480-1488.
Figures