0911
Does T1 Mapping Provide Additional Information in the Context of Hepatic Iron Overload?Aaryani Tipirneni-Sajja1, Eric M. Kercher1, Ralf B. Loeffler1, Ruitian Song1, Matthew D. Robson2, M. Beth McCarville1, Jane S. Hankins3, and Claudia M. Hillenbrand1
1Diagnostic Imaging, St. Jude Children's Research Hospital, Memphis, TN, United States, 2Radcliffe Department of Medicine, University of Oxford, Oxford, United Kingdom, 3Hematology, St. Jude Children's Research Hospital, Memphis, TN, United States
Synopsis
Hepatic iron content (HIC) is linearly correlated with R2*. Currently, there is little data on in vivo human liver iron assessment via longitudinal relaxation T1 (or R1) although an animal study previously suggested linear association, too. This study investigates hepatic T1 quantification in a breathhold by using ShMOLLI. T1 and T2* liver mapping were performed in 124 iron loaded patients. We found linear association between R1 and R2*/HIC values for mild-moderate HIC at 1.5T and 3T. No association between T1 and T2* was found for high HIC, which is most likely due to technical limits of ShMOLLI for short T2*.
Introduction
Assessment of hepatic iron content (HIC) by R2*-MRI has been increasingly used as a non-invasive alternative to liver biopsy. R2* (=1/T2*) is typically measured by quantifying the signal decay of a breath-hold multi-echo gradient echo (mGRE) sequence. R2* and HIC by biopsy are linearly related and R2*-based HIC is calculated using published calibration curves.1-3 However, previous R2*-HIC biopsy studies have shown that their precision is limited for high HIC (>20 mg Fe/g) and might even fail for massive HIC (>25 mg Fe/g) because of the rapid signal decay associated with standard mGRE imaging. In this study, we investigate the impact of hepatic iron overload on T1 (=1/R1) relaxation times and if T1 values may have the potential to increase our confidence in the assessment of HIC in a large patient cohort with transfusional iron overload.Methods
This prospective study was approved by the Institutional Review Board. 124 subjects with a history of ≥ 12 blood transfusions underwent MRI at 1.5T to assess HIC. Of these 124 subjects, 62 also had a 3T exam. All images were acquired axially at the location of the main portal vein in the central part of the liver. Quantitative T1 imaging and mapping was accomplished by using the ShMOLLI sequence (TE/TI/TIincrement=1.05/105/80ms, α=35°, FOV=323-400mm, matrix:384x312, slice-thickness=10 mm) and respective post-processing algorithm.4 For T2* analysis, subjects also underwent multi-echo gradient-echo (mGRE) imaging5 (TR/TE1/ΔTE=200/1.07/0.86ms, 20 echoes, α=35°, FOV= 250–400mm, matrix: 128x104, slice thickness=10 mm). Quantitative T2*/R2* maps were calculated using a nonlinear least-squares fit method in MATLAB.6, 7 Region of interest (ROI) analysis of T1 and T2* quantitative maps were performed offline using a custom-written program in MATLAB.8 Two ROI analysis techniques were used: small ROIs were drawn in a homogeneous area in the right hepatic lobe that approximately matches the area of liver biopsy resections. Hepatic T1 and T2* values were also extracted using whole liver ROI and histogram analysis that excluded signal from hepatic blood vessels.8 R2*-based HIC values were calculated using the R2* values obtained at 1.5T and a previously published calibration curve.3,8 As the presence of fat affects T1 and T2* measurements, all patients were tested for hepatic steatosis10 and were excluded if the fat fraction ≥ 5%.Results & Discussion
Patient demographics were summarized in Table 1. Four patients were excluded due to failed T1 or T2* fits at 1.5T and 8 at 3T. Further, 5 patients were excluded due to the presence of fat at 1.5T and 2 at 3T. Figure 1A compares the T1 results between the small ROI and whole liver ROI techniques. A strong linear correlation was found at 1.5T (slope = 1.03, R2 = 0.95) and at 3T (slope = 0.96, R2 = 0.91) between both ROI techniques. This suggests that T1 times (and thus iron) are homogeneously distributed throughout the liver in our patient cohort. Analysis using the whole liver ROI approach is preferable as it removes the ambiguities associated with the size and placement of ROI compared to the small ROI approach.8 Liver T1 times measured at 3T produced slopes of 1.2 and 1.4 when compared to those obtained at 3T using the whole liver and small ROI analyses, respectively. Figure 2 shows the results of comparing T1 and R1 values with R2*-based HIC. A monotonic decrease in T1 (increase in R1) was seen at both field strengths with increasing HIC. This trend however saturates around T1 = 300 ms for HIC > 15 mg Fe/g (i.e., R2* > 500 s-1). The observed ‘saturation’ of T1 times could be explained by a systematic bias in the ShMOLLI sequence fitting algorithm. This algorithm has not been tested11 for T2* < 2 ms (R2* > 500 s-1) [HC1] which happens to be where our data begins to flatten out. However, there is a moderate linear relationship (R2 = 0.5) between R1 and R2*-based HIC (Fig. 2B) for normal to moderate iron overloaded cases (0 – 15 mg Fe/g) and the slope obtained at 1.5T was close to that reported in literature.Conclusion
T1 relaxation times in the liver can be quantified with ShMOLLI in normal and moderately iron overloaded cases. T1 values are relatively homogeneous throughout the liver. T1 values are associated with T2* values and consequently with HIC. T1 times plateau in highly overloaded cases, which likely is due to the fact that T2* times are too short for ShMOLLI to quantify accurately. Therefore, future work should focus on testing with a fast T1 sequence (e.g., snapshotFLASH) if there is indeed a plateau or a linear association also for severe HIC.Acknowledgements
No acknowledgement found.References
1. Anderson LJ, Holden S, Davis B, et al. Cardiovascular T2-star (T2*) magnetic resonance for the early diagnosis of myocardial iron overload. European heart journal. 2001; 22: 2171-9. 2. Wood JC, Enriquez C, Ghugre N, et al. MRI R2 and R2* mapping accurately estimates hepatic iron concentration in transfusion-dependent thalassemia and sickle cell disease patients. Blood. 2005; 106: 1460-5. 3. Hankins JS, McCarville MB, Loeffler RB, et al. R2* magnetic resonance imaging of the liver in patients with iron overload. Blood. 2009; 113: 4853-5. 4. Piechnik SK, Neubauer S and Robson MD. Shortened Modified Look-Locker Inversion recovery (ShMOLLI) for clinical myocardial T1- mapping at 1.5 and 3 T within a 9 heartbeat breathhold. Journal of Cardiovascular Magnetic Resonance. 2010; 12. 5. Hankins JS, McCarville BM, Loeffler RB, Smeltzer M, Wang WC and Hillenbrand CM. R2* magnetic resonance imaging of the liver in patients with iron overload. Blood. 2009; 113: 4853-5. 6. Gudbjartsson H and Patz S. The Rician distribution of noisy MRI data. Magn Reson Med. 1995; 34: 910-4. 7. Krafft AJ, Loeffler RB, Song R, et al. Does fat suppression via chemically selective saturation affect R2*-MRI for transfusional iron overload assessment? A clinical evaluation at 1.5T and 3T. Magnetic resonance in medicine. 2015. 8. McCarville BM, Hillenbrand CM and Loeffler RB. Comparison of whole liver and small region-of-interest measurements of MRI liver R2* in children with iron overload. Pediatric Radiol. 2010; 40: 1360. 9. Krafft AJ, Taylor BA, Lin H, Loeffler RB and Hillenbrand CM. A Systematic Evaluation of an Auto Regressive Moving Average (ARMA) Model for Fat-water Quantification and Simultaneous T2* Mapping. International Society of Magnetic Resonance in Medicine. Salt Lake City, Utah2013. 10. Banerjee R, Tunnicliffe E, Piechnik SK, Robson MD and Neubauer S. Multiparametric magnetic resonance for the non-invasive diagnosis of liver disease. Journal of Hepatology. 2014; 60: 69-77. 11. Wood JC, Nelson MD, Coates TD and Moats R. Cardiac Iron Determines Cardiac T2*, T2, and T1 in the Gerbil Model of Iron Cardiomyopathy. Circulation. 2005; 112: 535-43.Figures
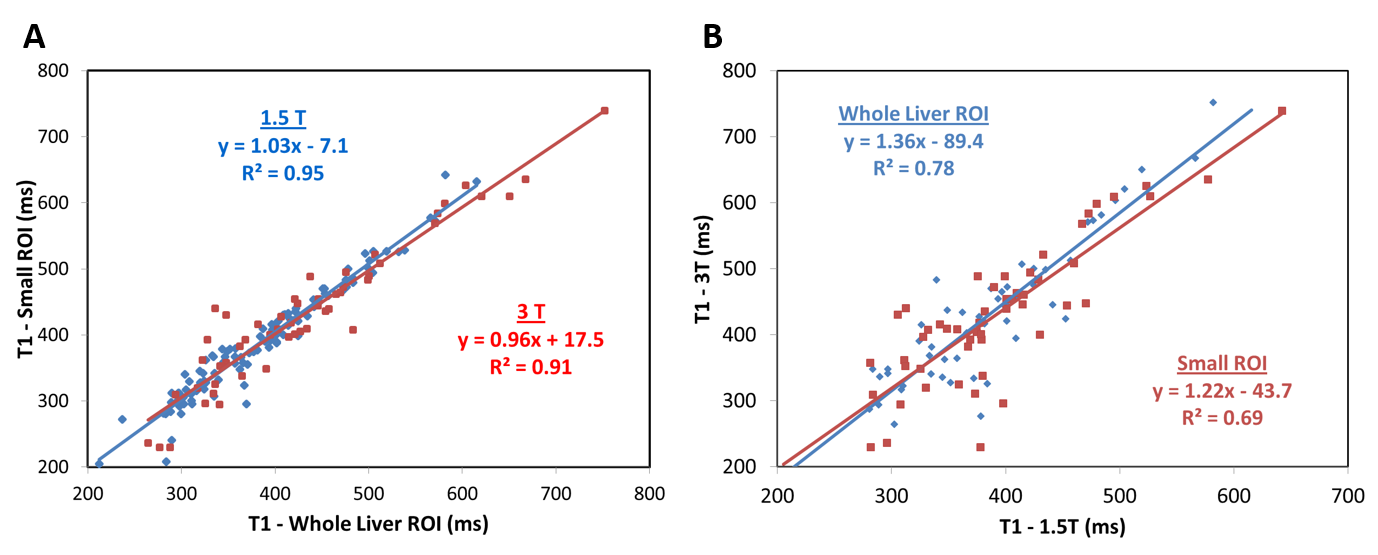
Figure
1:
Comparison between T1 relaxation times determined by whole liver and small ROIs
for 1.5T (blue diamonds) and 3T (red squares) (A), and T1 times measured at
1.5T and 3T for whole liver (blue diamonds) and small ROI (red squares)
analyses (B). T1 times by whole liver and small ROI analyses showed very strong
agreement with slopes close to unity at both field strengths. Liver T1 times at
3T are slightly longer compared to 1.5T as expected.
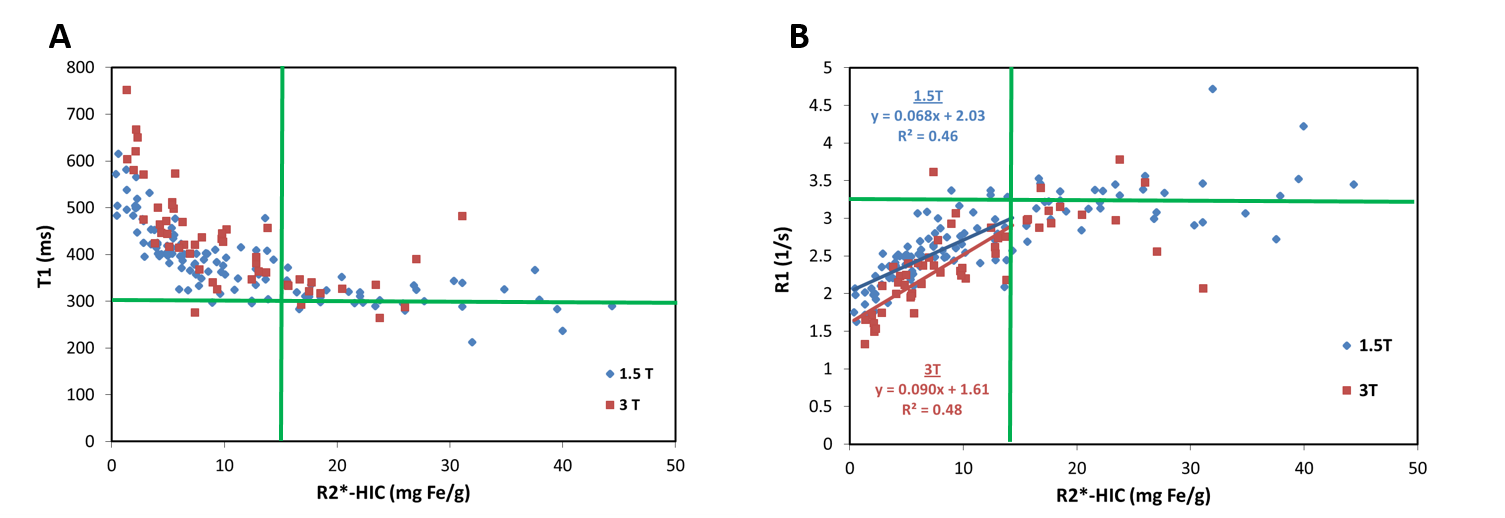
Figure
2:
T1 vs. R2*-based HIC (A), and R1 vs. R2*-based HIC (B) at 1.5T and 3T field
strengths. T1 decreases with an increase in iron overload, however, saturates
around T1 = 300 ms (R1 = 3.3 s-1) for HIC > 15 mg Fe/g. A moderate
correlation was observed between R1 and HIC at 1.5T and 3T in normal to
moderate iron-overloaded cases, i.e. HIC < 15 mg Fe/g.
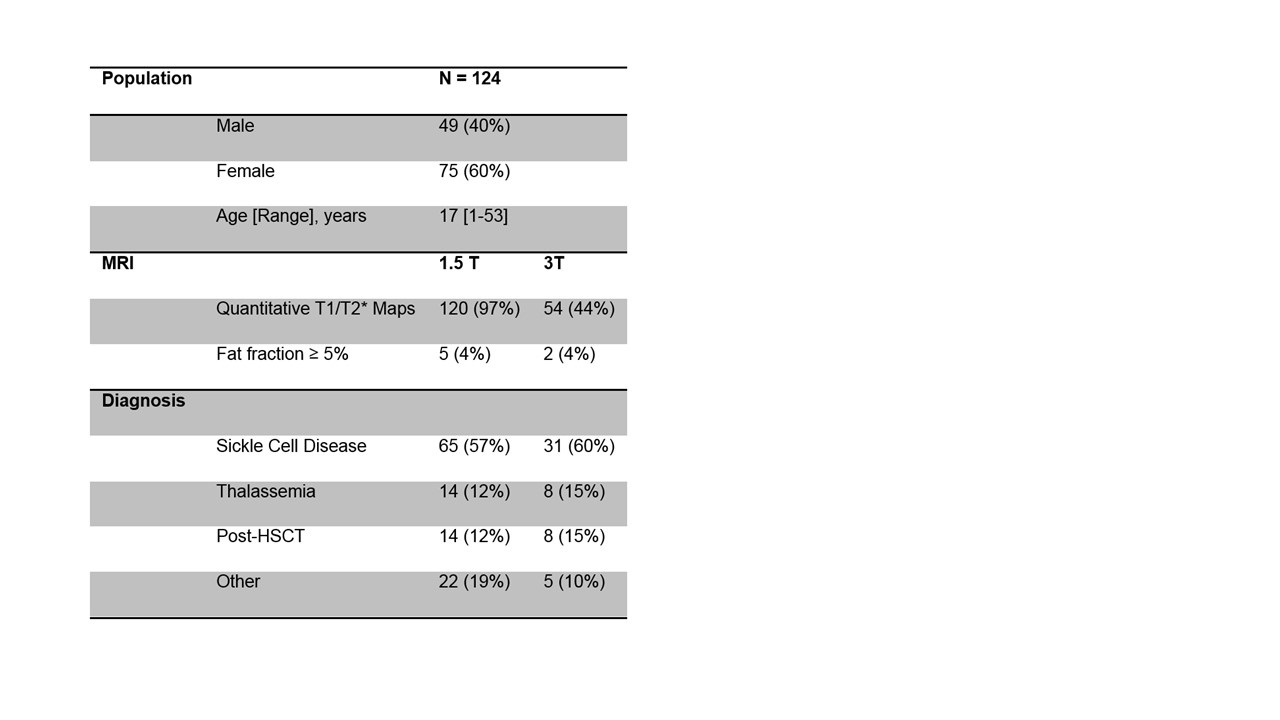
Table1. Patient demographics