0910
Liver function estimation using hepatocyte fraction map at gadoxetic acid enhanced liver MRI in patients with chronic liver diseaseJeong Hee Yoon1, Eunju Kim2, Tomoyuki Okuaki3, and Jeong Min Lee1
1Seoul National University Hospital, Seoul, Korea, Republic of, 2Philips Healthcare Korea, 3Philips Healthcare Japan
Synopsis
Hepatocyte fraction derived from gadoxetic acid enhanced liver MRI may provide quantitative surrogate marker of liver function for ICG R15 in patients with chronic liver disease.
Introduction
Liver function is a key factor that can help predict the clinical outcome in patients with cirrhosis (1, 2). Since cumulative data have shown liver function is heterogeneous over the liver, imaging-based liver function estimation using gadoxetic acid-enhanced MRI would be beneficial for these patients. There have been various attempts to estimate liver function using MRI, and one of them is hepatocyte fraction measurement (3). Thus, the purpose of this study is to determine whether hepatocyte fraction shows significant correlation with indocyanine green retention test (ICG R15) which is commonly used for estimating liver function quantitatively in critical situation.Methods
This prospective ongoing study was approved by our institutional review board, and informed consent was obtained from all patients. From Aug 2016, a total of 33 patients with chronic liver disease (M:F=28:5, mean age 59.8±9.2 years) were enrolled and underwent gadoxetic acid-enhanced liver MRI followed by ICG R15 test. A standard dose of gadoxetic acid (0.025mmol/kg) was intravenously injected. Fat quantification map was obtained using multi-echo Dixon method before contrast media injection. In addition, T1 map of the liver using Look-Locker sequence was obtained before contrast (preT1 map) media injection and 10 minutes (post T1 map) after contrast media injection using following scan parameters: T1-TFE, TR/TE = 7/1.7msec, FA=7º, acceleration factor of 2, shot interval = 5msec. Pre- and post-contrast T1 values (msec), difference of them (ΔT1), hepatocyte fraction and rate of hepatocyte uptake (K) were calculated using dedicated off-line software according to previous study schemes (Fig 1).Results and discussion
There were 87.9% (29/33) patients with chronic liver disease or Child-Pugh A, and 12.1% (4/33) patients were Child-Pugh class B. There were significant differences of ICG R15 (18.7±14.9% vs. 62.6±17.7%, P<0.0001), hepatocyte fraction (66.4±8.5%, 52.7±11.6%, P<0.007), K (21.8±9.5 vs. 8.8±4.0, P=0.01) and post T1 (339.7±82.4 msec vs. 496.3±119.2 msec, P=0.002) between two groups (Fig 2). However, ΔT1 and preT1 did not show significant difference (P=0.27, P=0.31). Hepatocyte fraction and K showed a significant negative correlation with ICG R15 (r=-0.50 [95% CI: -0.72, -0.19], and -0.68[95% CI: -0.83, -0.45]), as well as Child-Pugh scores (r=-0.47 [-0.7, -0.15], -0.48[-0.7, -0.16]). Especially hepatocyte fraction and ICG R15 showed heterogeneous distribution in compensated cirrhosis patients (Child A) (Figs 2, 3). Since identifying high-risk group of hepatic decompensation is clinically important for patient management, it could be clinically valuable information.Conclusion
Hepatocyte fraction and uptake ratio derived from gadoxetic acid enhanced liver MRI showed a significantly negative correlation with ICG R15, which may suggest the potential capability of gadoxetic acid-enhanced MRI as a quantitative marker of liver function.Acknowledgements
Supported by the Basic Science Research Program through the National Research Foundation of Korea funded by the Ministry of Education (2013R1A1A2A10066037).References
1. Sohrabpour AA, Mohamadnejad M, Malekzadeh R. Review article: the reversibility of cirrhosis. Aliment Pharmacol Ther 2012;36(9):824–832
2. Yoon JH, Lee JM, Kim E et al, Quantitative Liver Function Analysis: Volumetric T1 Mapping with Fast Multisection B1 Inhomogeneity Correction in Hepatocyte-specific Contrast-enhanced Liver MR Imaging. Radiology 2016 DOI: 10.1148/radiol.2016152800
3. Okuaki T, Morita K et al, Comparison of the Hepatocyte Fraction and Conventional Image Based Methods for the Estimation of Liver Function. ISMRM 2016 Proceedings
Figures
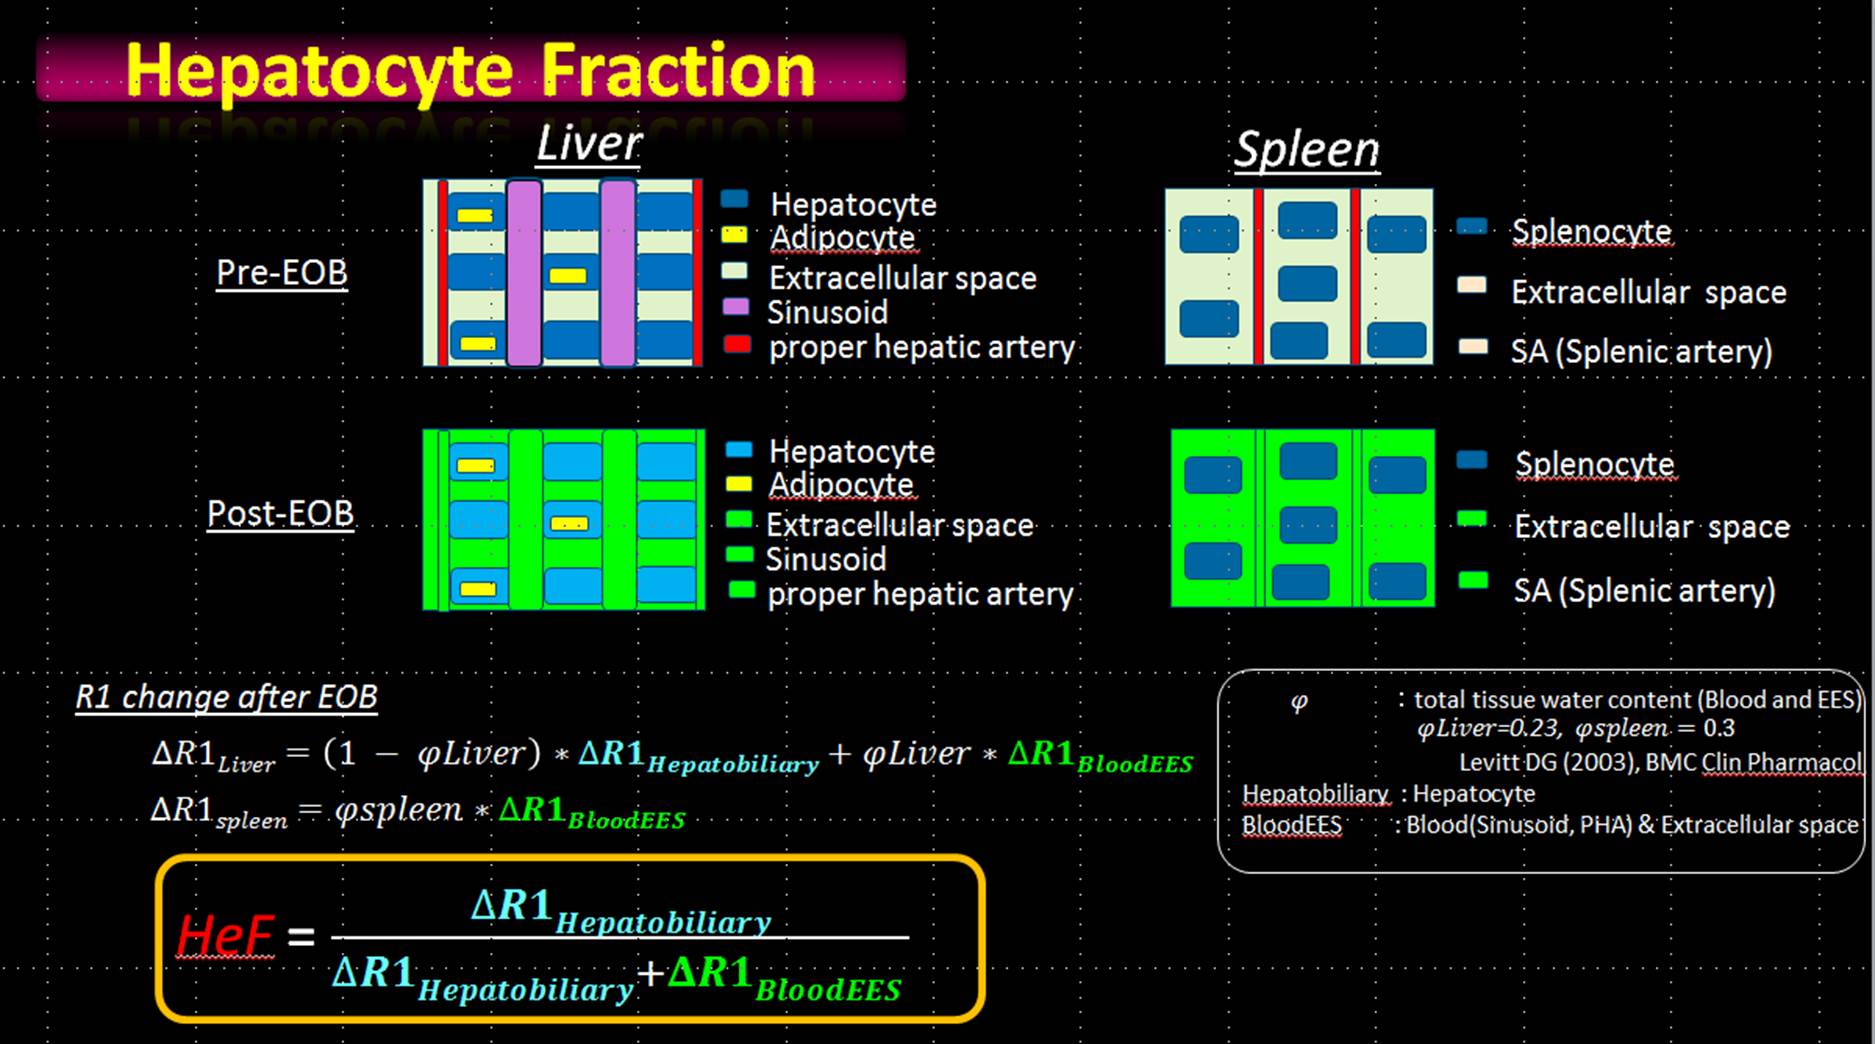
Scheme of hepatocyte fraction calculation. Post contrast T1 map, ΔT1 owed to uptake of gadoxetic acid by hepatocyte as well as contrast media stagnation in the EES. Using splenic T1 and fat map, contribution of EES and effect of fat are corrected.
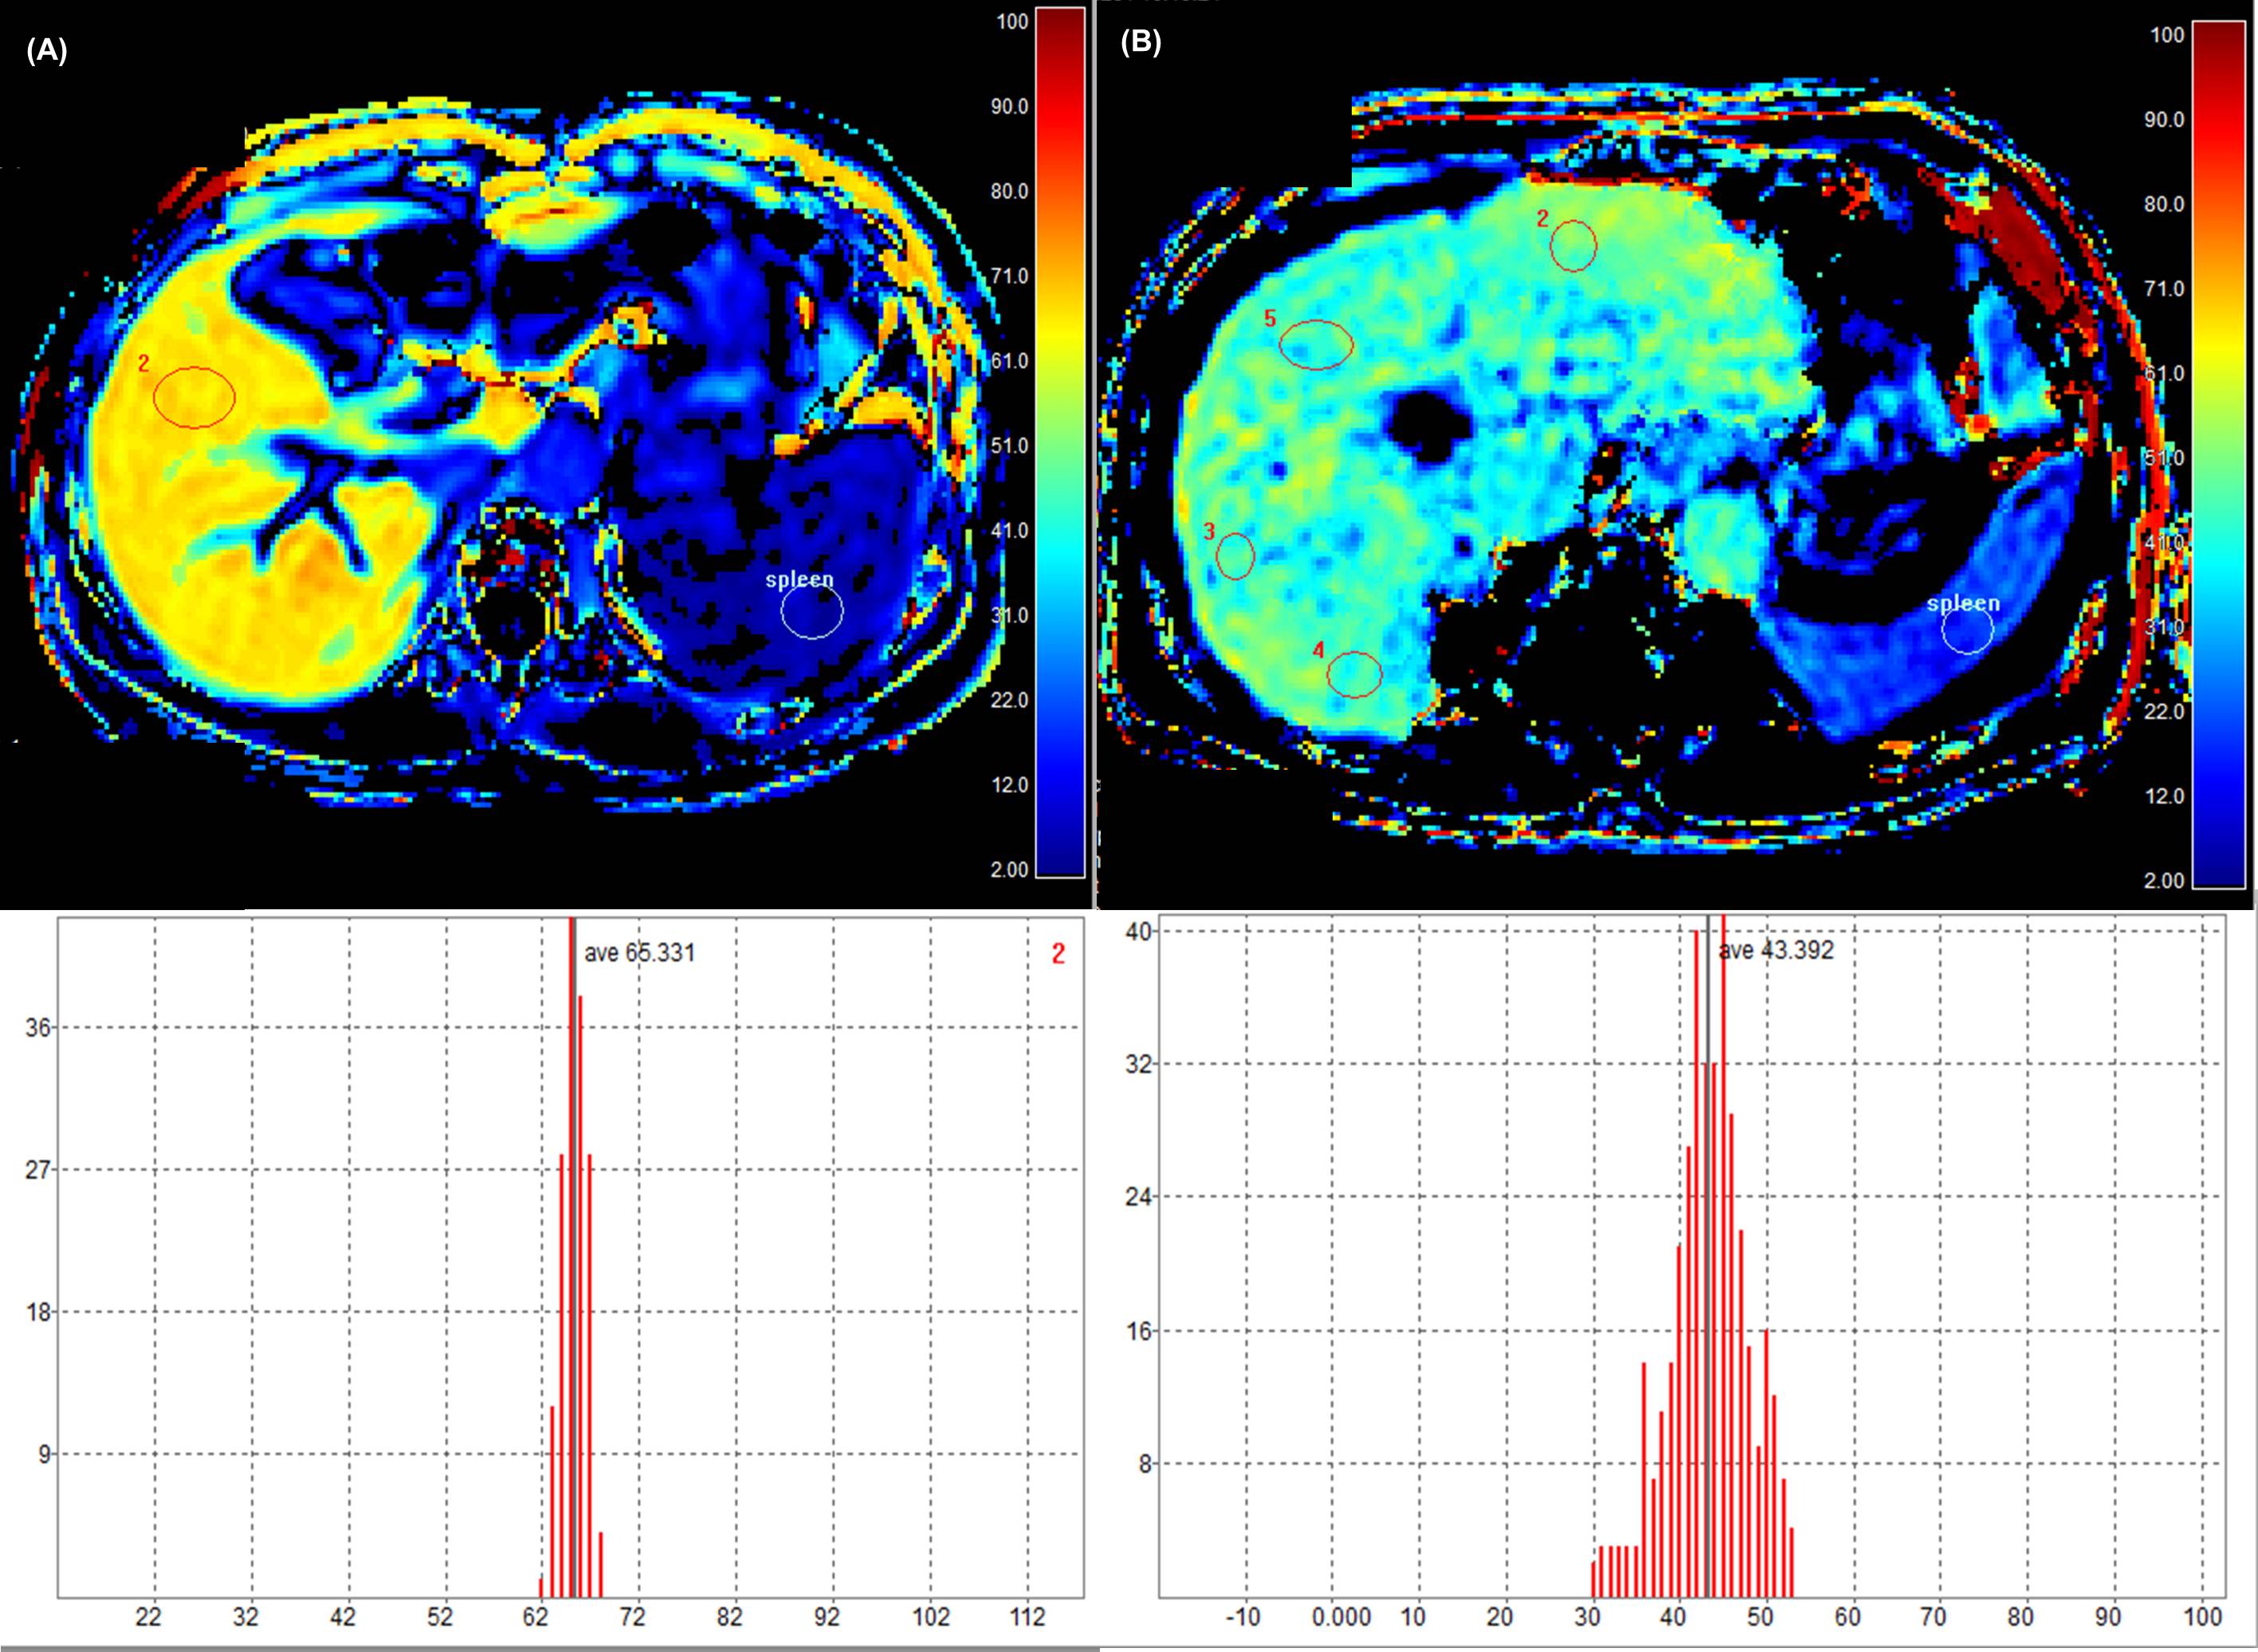
Hepatocyte fraction map of patients with compensated cirrhosis using off-line software. (A) A map of a 66-year-old woman with hepatitis B-cirrhosis, and the hepatocyte fraction was 65.33% (bottom line) and K was 0.45 min-1. (B) A map of a 74-year-old man with hepatitis B showed 42.36% of hepatocyte fraction (bottom line) and 0.36 min-1 of K. ICG R15 values were 4.7% and 39.2%, respectively.
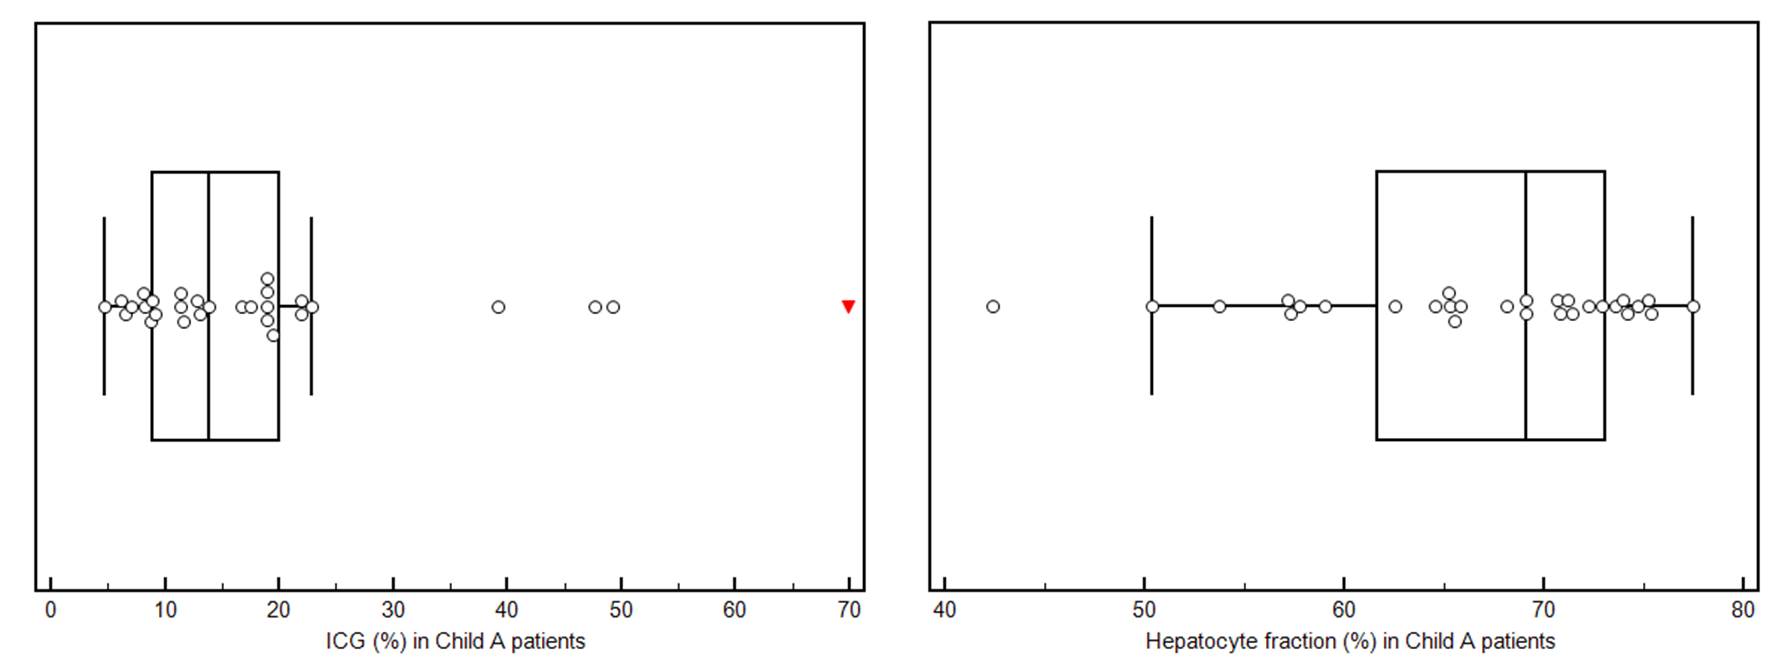
Broad distribution of ICG R15 results (left) and hepatocyte fraction (right) in patients with chronic liver disease or compensated cirrhosis group.