0907
A New MR Elastography Parameter for Diagnosing Hepatic Fibrosis and Inflammation: Shear Attenuation1Radiology, Mayo Clinic, Rochester, MN, United States, 2Gastroenterology and Hepatology, Mayo Clinic, Rochester, MN, United States
Synopsis
Liver attenuation was investigated in comparison to the well-established liver stiffness for detecting hepatic fibrosis in 108 patients with histology-proven chronic liver diseases. Both liver stiffness and attenuation successfully detected varying fibrosis and inflammation with equivalent accuracy. At 40 and 60Hz, both have excellent accuracy for distinguishing clinical significant fibrosis or inflammation from others; moderate accuracy were obtained in distinguishing mild abnormalities from patients without abnormalities. Steatosis extent had no significant effect on liver stiffness and attenuation measurements. Our findings indicate that shear attenuation has equivalent diagnostic performance to that of liver stiffness for detecting liver disease progression.
Purpose
Chronic liver disease and cirrhosis remain a leading cause of mortality in the United States. These trends are expected to increase based on an aging population, the growing epidemic of obesity and nonalcoholic fatty liver disease (NAFLD), and the continued burden of disease from chronic hepatitis C (HCV) infection. For the vast majority of affected patients, the morbidity and mortality from chronic liver disease and cirrhosis are directly related to progressive hepatic fibrosis. Many studies have found that MR elastography assessed liver stiffness is the most accurate biomarker for detecting hepatic fibrosis when compared with many other noninvasive biomarkers. The purpose of our study was to evaluate the diagnostic performance of another MRE-assessed mechanical property – shear attenuation – in detecting abnormalities in the chronic liver diseases (1). Our hypothesis is that liver stiffness and attenuation have equivalent accuracy for detecting hepatic fibrosis and inflammation.Methods
All activities related to human subjects were reviewed and approved by our institutional review board (IRB). All enrolled patients provided written informed consent. Between March 2010 and May 2013, adult patients referred for liver biopsy after clinical evaluation for known or suspected chronic liver disease were considered for enrollment consecutively in our study. Histology was evaluated according to the METAVIR scoring system or Brunt classification when appropriate. Obese patients who were going to have bariatric surgery before MRE examination were also included. Patients fasted for at least 6 hours before they underwent multifrequency 3D MRE (40, 60 and 80Hz)(2) and 2-point Dixon imaging for liver stiffness, shear attenuation and fat fraction calculation. At each frequency, the mean measurements of liver stiffness and attenuation were analyzed with pairwise comparisons (nonparametric Dunn method for joint ranking) at different fibrosis and inflammation extent with subsequent ROC analyses. Spearman’s correlation method was also used to evaluate the relationships between these two mechanical properties and the extent of steatosis. The average liver volume for reliable MRE parameter measuring was also calculated for each frequency. For all statistical analysis, a significance level of less than 0.05 was used.Results
In total, 111 patients participated in our study. This patient population has obesity with the overall mean BMI = 40.3 (38.7, 41.8) kg/m2. 105/110 (95.5%) patients had successful MRE exams. 86/105 had NAFLD/NASH, 15/105 had HCV. The time period between MRE and biopsy was 23.6 (22.0, 25.2) days. As shown in Figures 1 and 2, with an increasing fibrosis stage or inflammation grade, liver stiffness progressively increased, while liver attenuation progressively decreased at each frequency. As shown in Figures 3 and 4, both liver stiffness and attenuation had equivalent diagnostic performance for distinguishing different extent of hepatic fibrosis and inflammation at each frequency. The average liver volume with reliable MRE measurement is 510±174, 306±125 and 273±113 cm3 at 40, 60 and 80Hz respectively. No significant differences were observed in the diagnostic accuracies of stiffness and attenuation among all three different frequencies (p>0.05). However, liver stiffness at lower frequencies of 40 and 60Hz gives a slightly higher accuracy for clinical significant fibrosis (F>1, ROC>0.9) and inflammation (I>1, ROC>0.8) than that of 80Hz. No significant correlations were observed between stiffness/attenuation and fat fraction at all frequencies, neither was dispersion as shown in Figure 5. Frequency dispersion of the liver stiffness was only elevated significantly at end stage of fibrosis (F4) or moderate inflammation (I2).Discussion and Conclusion
In the clinical application of MRE for hepatic fibrosis, we observed that the penetration depth of the propagating shear waves does not reach deeper structures in healthy livers, while substantially increases in the fibrotic liver. This study confirmed our visual observations that the shear attenuation decreases systematically in the liver with increased fibrosis or inflammation. Our results also indicate that shear attenuation has an equivalent diagnostic accuracy as that of shear stiffness of the liver in distinguishing either fibrosis or inflammation. However, shear attenuation cannot further improve the diagnostic ability of MRE with the combination of shear stiffness because they are not independent parameters and both associated with the complex shear modulus with the same physical assumptions. Among three different frequencies, MRE at 40 to 60Hz are preferred in liver MRE examinations over that of 80 Hz with regard to the measurable liver volume (or penetration depth) and overall diagnostic accuracy. Steatosis extent is not a confounding factor for both stiffness and attenuation in detecting liver abnormalities. We conclude that shear attenuation is equivalent to shear stiffness and it provides another reliable quantitative imaging biomarker of liver fibrosis and inflammation in patients with chronic liver diseases.Acknowledgements
This work has been supported by NIH grants EB017197 and EB001981.References
1. Yin M, Venkatesh SK, Mariappan YK, et al. Value of Shear Wave Attenuation as a Tissue Characterization Parameter in MR Elastography of the Liver. International Society for Magnetic Resonance in Medicine. Toronto, Ontario, Canada2008; p. 84.
2. Loomba R, Cui J, Wolfson T, et al. Novel 3D Magnetic Resonance Elastography for the Noninvasive Diagnosis of Advanced Fibrosis in NAFLD: A Prospective Study. Am J Gastroenterol. 2016;111(7):986-94.
Figures
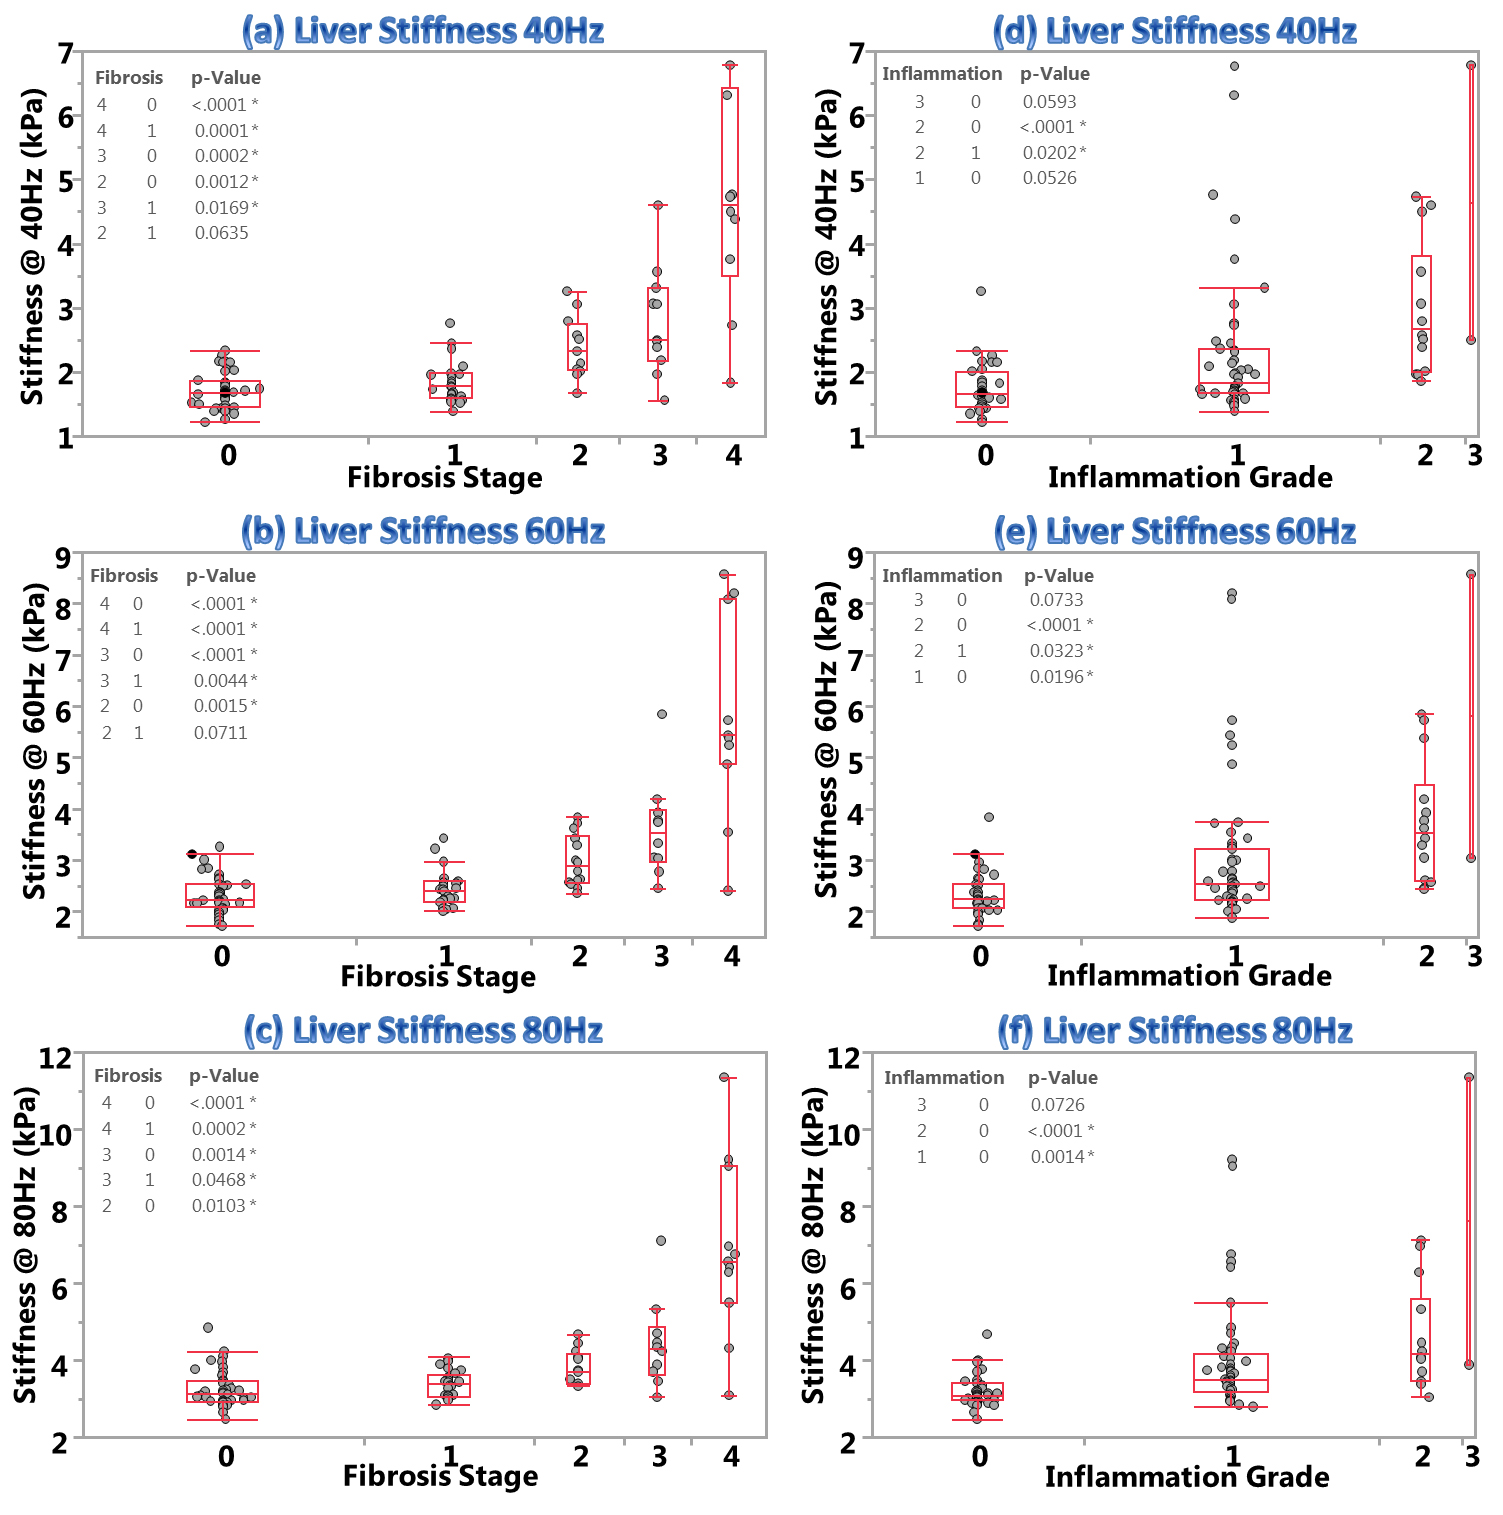
Figure 1 – Shear stiffness of the liver can detect hepatic fibrosis at different stages and inflammation at different grades.
This figure demonstrates that liver stiffness measurements elevate progressively with increased vibrating frequency, fibrosis stage and inflammation grade. Charts (a-c) show significant differences in liver stiffness between F2 and F0, F3 and F0-1, F4 and F0-1 at all frequencies. Charts (d-f) illustrate significant differences in liver stiffness between I2 and I0 for all frequencies, I1 vand I0 at 80Hz only, I2 and I1 at 40-60Hz only.
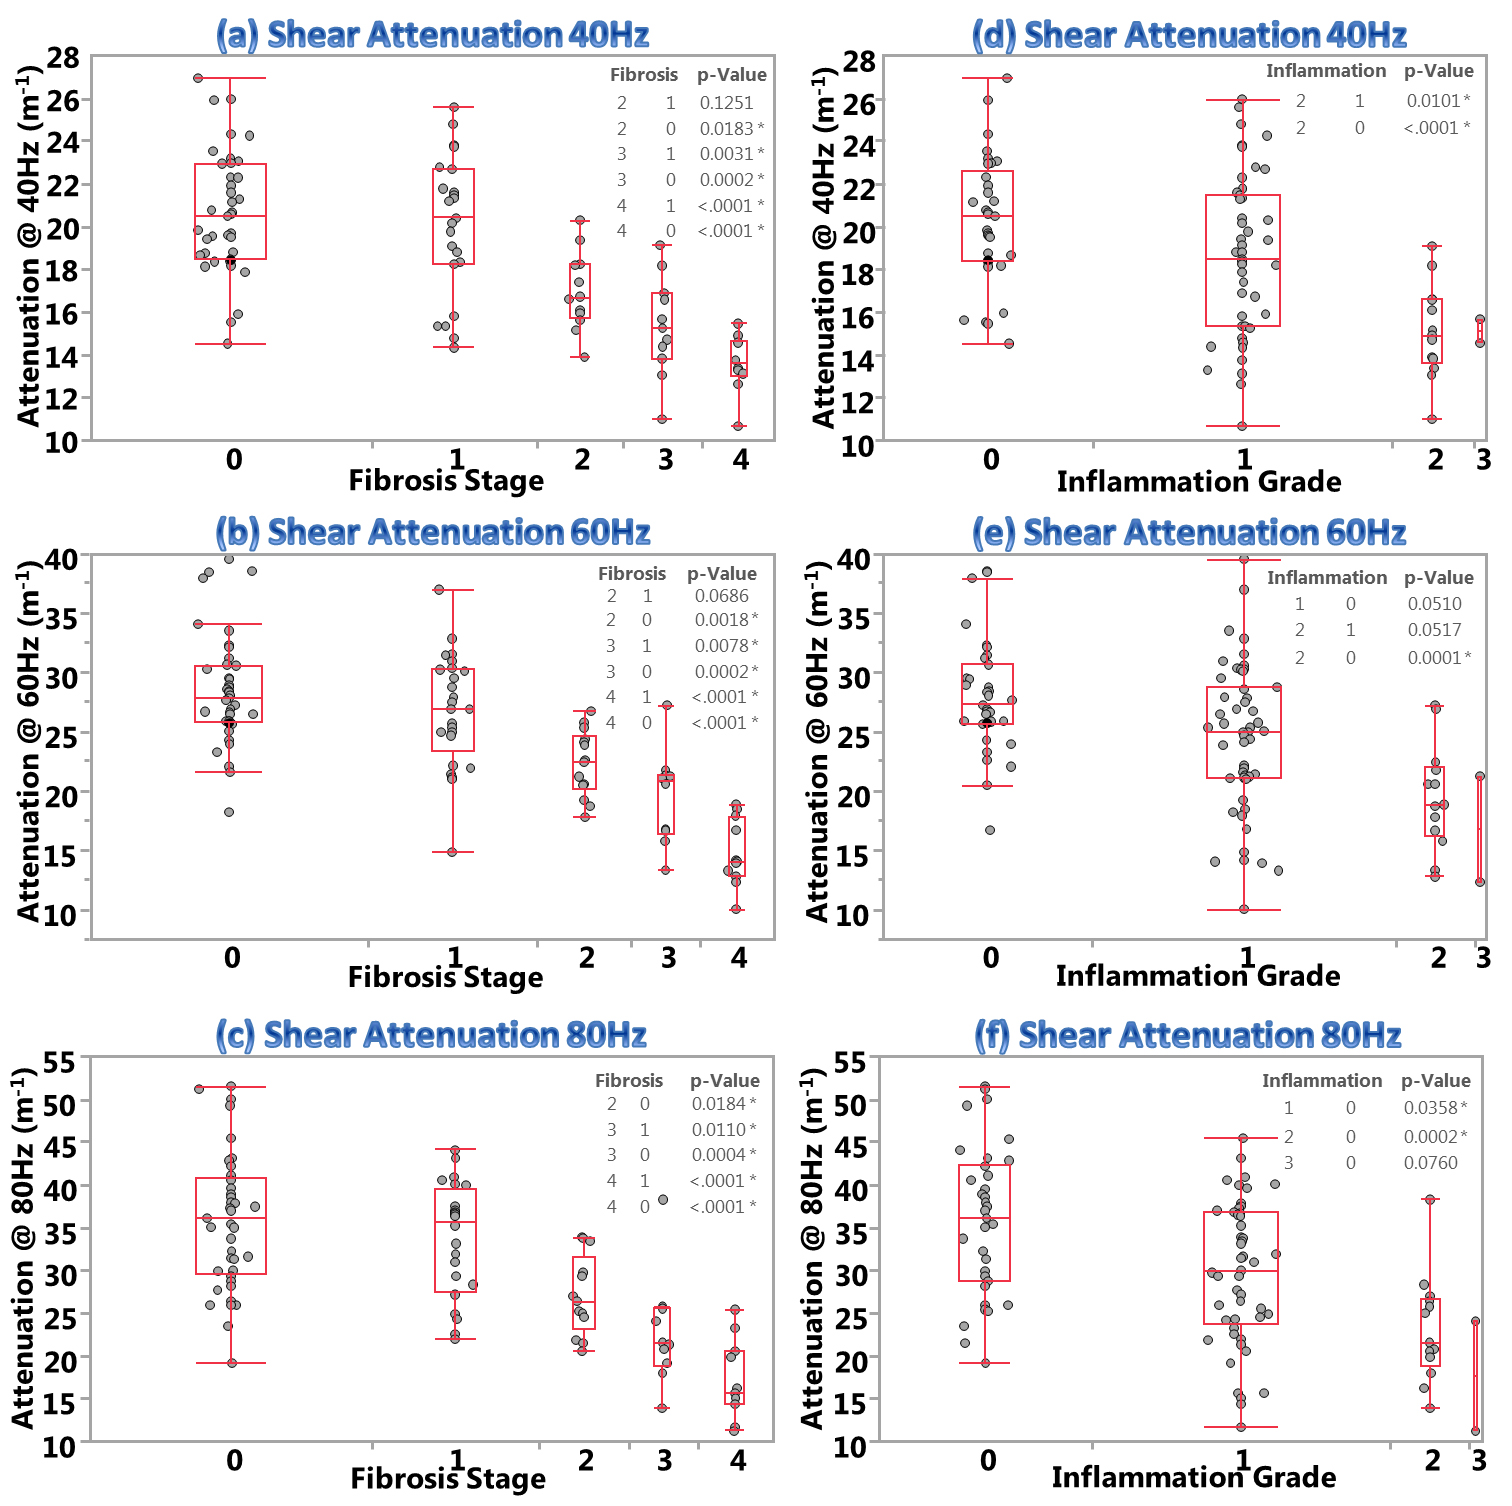
Figure 2 – Shear attenuation of the liver can detect varying extent of hepatic fibrosis and inflammation.
This figure demonstrates that shear attenuation measurements decrease progressively with increased vibrating frequency, fibrosis stage and inflammation grade. Charts (a-c) show significant differences in shear attenuation between F2 and F0, F3 and F0-1, F4 and F0-1 at all frequencies. Charts (d-f) illustrate significant differences in shear attenuation between I2 and I0 for all frequencies, I1 and I0 at 80Hz only, I2 and I1 at 40Hz only.
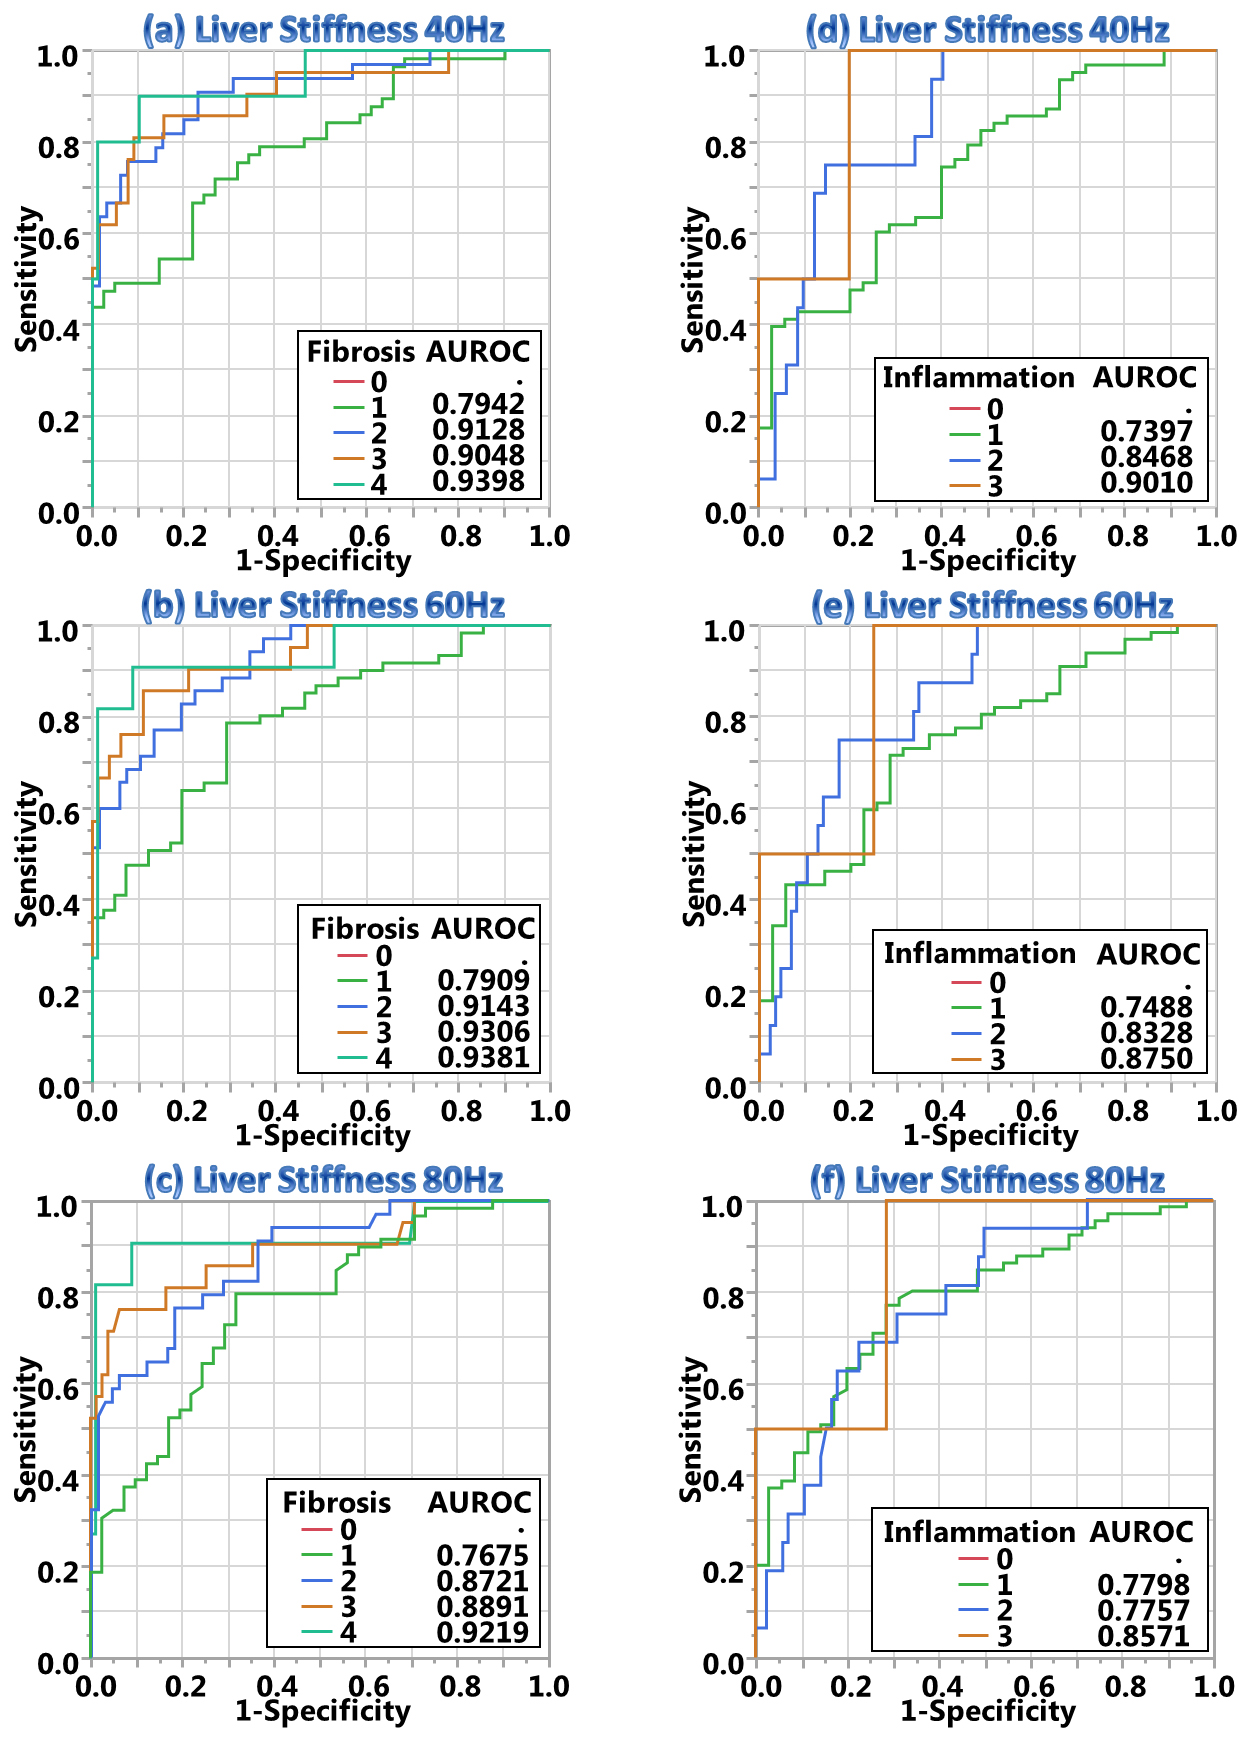
Figure 3 – Diagnostic performance of liver stiffness.
Charts (a-c) demonstrate that liver stiffness has excellent diagnostic accuracy (AUROC>0.9) to distinguish clinical significant fibrosis (F>1) at 40 and 60Hz, moderate accuracy to distinguish mild fibrosis (F≤1, AUROC>0.7) at all frequencies. Charts (d-f) demonstrate that liver stiffness has moderate to good accuracy to distinguish inflammation. No significant differences were observed in AUROC for distinguishing either fibrosis or inflammation between 60Hz and 40Hz except for F3 (p=0.03). However, measurements at 80Hz were less accurate for distinguishing intermediate fibrosis (F2-3, p=0.009) and inflammation (I2, p=0.02) than that of 40 and 60Hz.
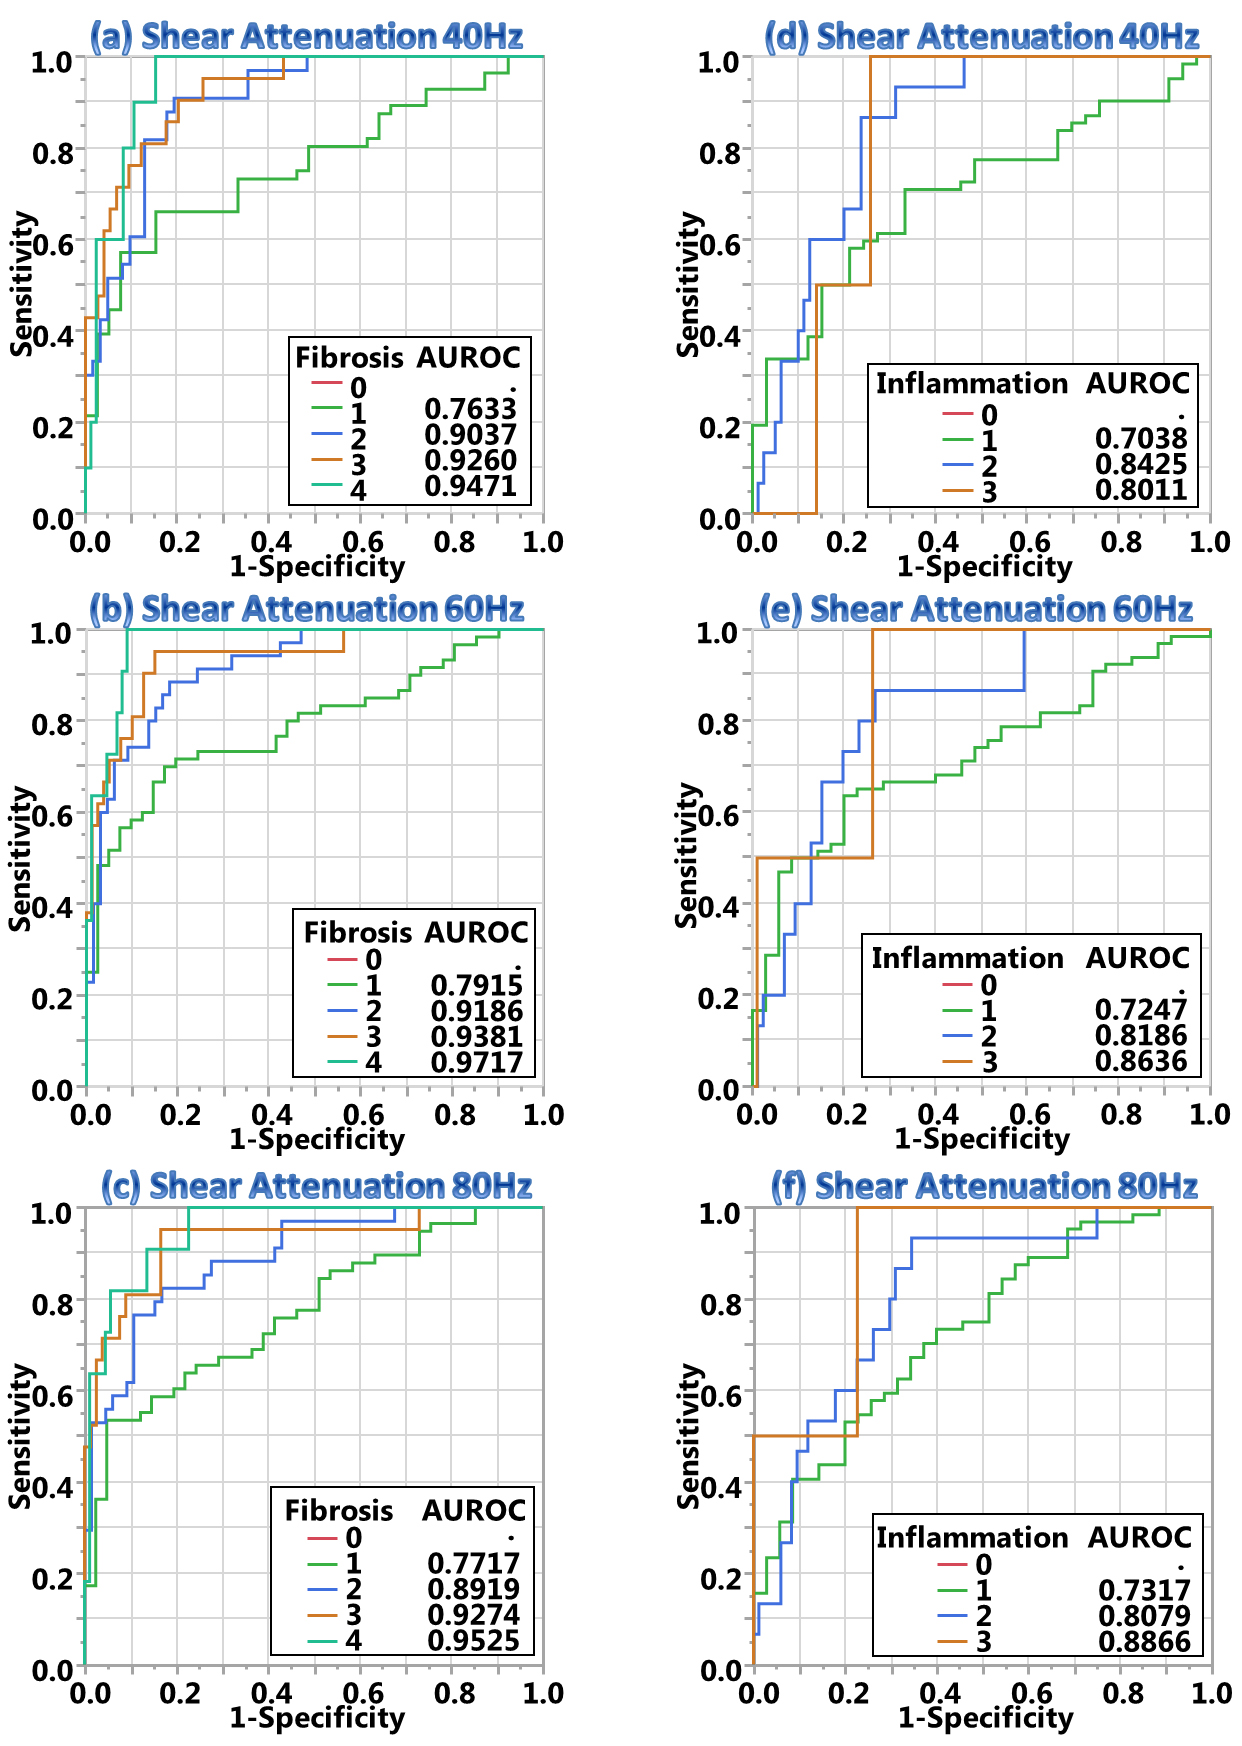
Figure 4 – Diagnostic performance of liver attenuation.
Charts (a-c) demonstrate that liver attenuation has excellent diagnostic accuracy (AUROC>0.9) to distinguish clinical significant fibrosis (F>1) at 40 and 60Hz, moderate accuracy to distinguish mild fibrosis (F≤1, AUROC>0.7) at all frequencies. Charts (d-f) demonstrate that liver attenuation has moderate to good accuracy to distinguish varying inflammation grade (0.7<AUROC<0.9). No significant differences were observed in AUROC values for distinguishing either fibrosis or inflammation among all different frequencies of 40, 60 and 80Hz.
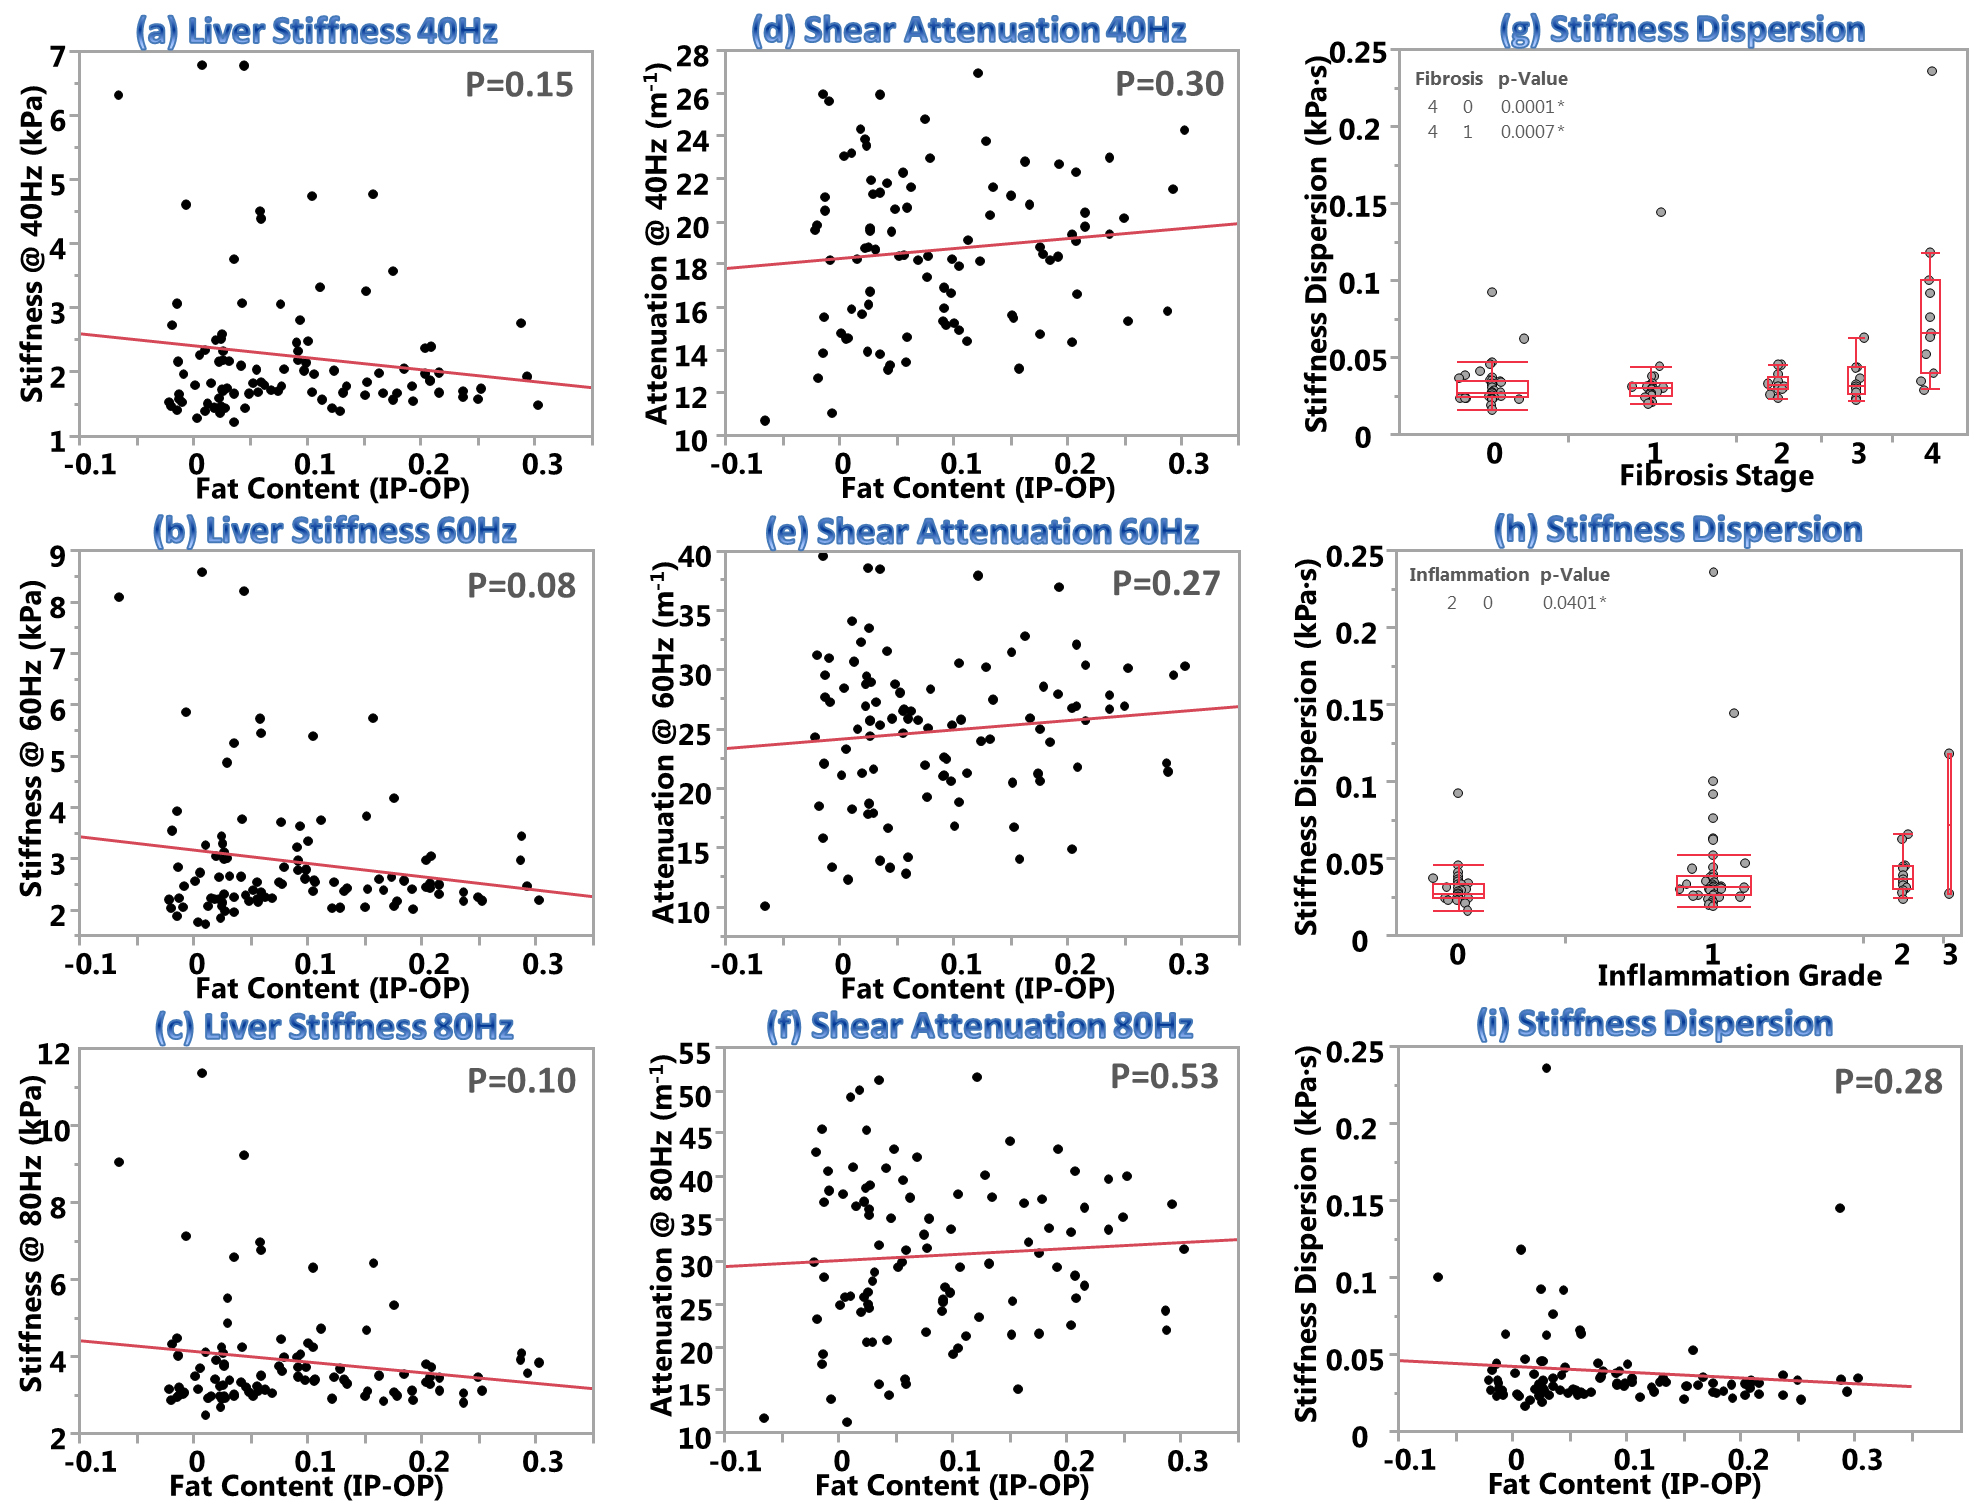
Figure 5 – Effect of fat fraction on liver stiffness and attenuation, and the correlation of stiffness dispersion to fibrosis stage, inflammation grade and fat content, respectively.
Charts (a-f) show no significant correlations were observed between fat fractions and shear stiffness or attenuation measurements of the liver at all frequencies of 40, 60 and 80Hz (p>0.05 for all). Charts (g-h) illustrate that frequency dispersion of liver stiffness can only detect severe fibrosis (F4) or inflammation (I2) and from patients with no to mild diseases (F0-1, I0). Chart (i) demonstrate there is no correlation between dispersion and fat fraction either (p=0.28).