0906
Comparison of Spin-Echo Echoplanar Imaging and Gradient Recalled Echo Magnetic Resonance Elastography Pulse Sequences Among Patients with Hepatic Iron Overload at 3.0 T1Radiology, UCLA, Los Angeles, CA, United States, 2Siemens Healthcare
Synopsis
Most technical failures of GRE-based MR elastography are related to iron overload, especially at 3.0 T. SE-EPI-based MR elastography may be a useful alternative. 3.0 T GRE and SE-EPI MR elastography sequences were compared in 20 patients with iron overload (mean R2* 114 sec-1) in terms of quantitative liver stiffness (LS) and image quality score (IQS), based on wave propagation and confidence mask coverage, as determined by two experienced radiologists. LS measurements were not significantly different between the two sequences. SE-EPI showed a trend toward higher confidence mask coverage and significantly higher IQS for both readers compared to GRE.
Introduction
Gradient
recalled echo (GRE) based magnetic resonance elastography (MRE) is a robust
technique.1 When results are
suboptimal, most of these technical failures are attributable to low MR signal
intensity within the liver, most commonly due to iron overload, which leads to
T2*-mediated signal loss.2 This occurs even more frequently at 3.0 T,
where sensitivity to susceptibility is higher.
This is an important issue, because many patients with chronic liver
disease have iron overload. To reduce
failure rates in the presence of iron, a single-shot spin-echo echoplanar
(SE-EPI) based MRE acquisition can be used in place of the conventional
GRE-based technique.Purpose
To compare 2D GRE and 2D SE-EPI-based MRE sequences in the liver at 3.0 T in terms of quantitative liver stiffness (LS) measurement and image quality among patients with mild to severe iron overload.Methods
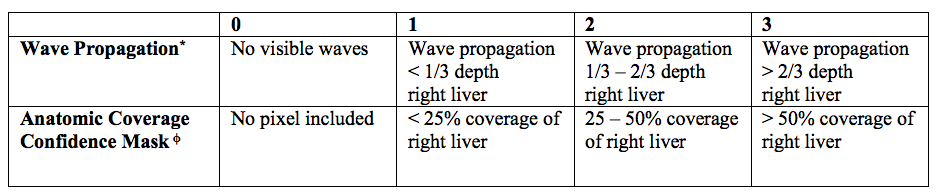
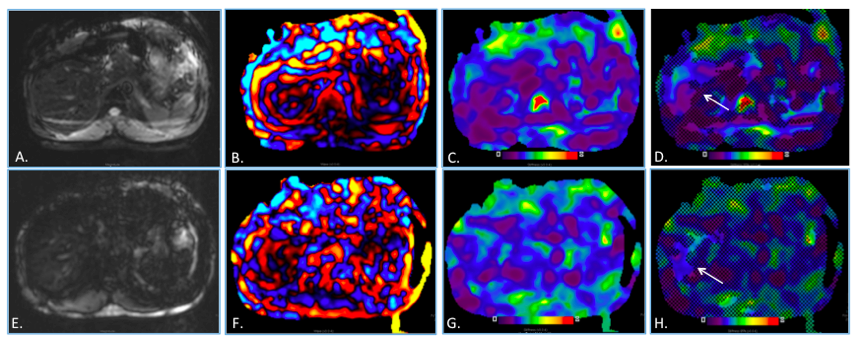
This IRB-approved, HIPAA-compliant prospective study involved 20 subjects (12 men, 8 women, mean age 54 years) with mild to severe iron overload (mean R2* 114 sec-1, range 78 – 265 sec-1), who underwent liver MRI at 3.0 T (MAGNETOM Prisma, Siemens Healthcare, Erlangen, Germany), including MRE with both GRE (TR, 50 msec; TE, 22 msec; slice thickness, 5 mm; gap, 1 mm; matrix 77 x 128; phase partial Fourier; flip angle, 25 degrees; breath hold, 18 sec) and SE-EPI prototype (TR, 1600 msec; TE, 49 msec; slice thickness, 5 mm; gap, 1 mm; matrix, 128 x 128; echo train length, 47; flip angle, 90 degrees; breath hold 18 sec) sequences on the same day. R2* values were calculated using a semi-automated multi-echo Dixon technique (Liver Lab, Siemens). Image quality scores (IQS) were evaluated by two independent observers based on wave propagation and right hepatic lobe coverage on the confidence mask (0-15), based on a previously described technique.3 The scoring system is described in Figure 1. One of the two observers also measured LS on stiffness maps (in kilopascal, kPa) for each sequence. Mean LS, region of interest sizes (based on confidence mask) and IQS were compared using paired nonparametric Wilcoxon test. Inter-reader reliability for IQS was assessed using Cohen’s kappa, and IQS were correlated with R2*, using Spearman correlation coefficient.Results
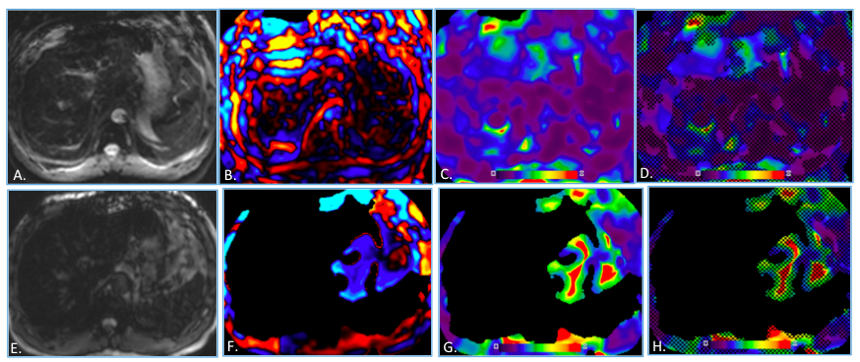
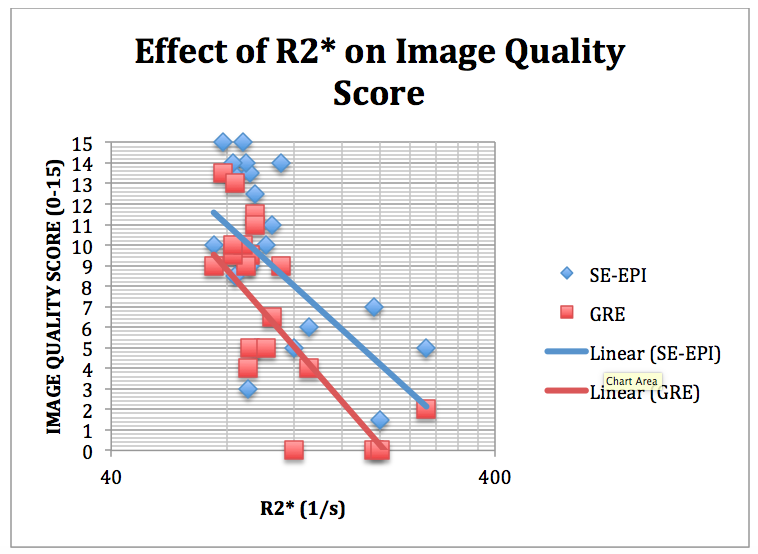
There were two cases of failure with GRE and one with both GRE and SE-EPI. All failures consisted of anatomical mask failure coincident with very low liver signal on the source images, leading to no liver included on the confidence mask. Mean R2* among these three cases was 171 sec-1. LS measurements were not significantly different between the two sequences (2.29 + 0.46 vs 2.18 + 0.52, P = 0.93). There was a trend toward higher region of interest (ROI) size for SE-EPI (median, 12,523 mm2 [IQR 6493-18966] vs 10,487 mm2 [IQR 3252-14402], P = 0.08). IQS were significantly higher for SE-EPI for both readers (9.2 + 4.2 vs 6.9 + 4.2, P < 0.01, Reader 1; 9.8 + 4.5 vs 7.2 + 4.5, P < 0.02, Reader 2). IQS was significantly correlated with R2* for GRE and SE-EPI (r2 = -0.72, P < 0.0004 and r2 = -0.58, P < 0.004, respectively). Inter-reader reliability was good (κ 0.6 – 0.66).Discussion
SE-EPI-based MRE techniques provide a good alternative in cases of iron overload, because the 180 degree refocusing pulse makes them inherently insensitive to T2* effects. This improvement is suggested by the significantly higher IQS with SE-EPI and the trend toward increased coverage on the confidence mask in our cohort.Conclusion
SE-EPI-based MRE may be a better option than conventional GRE for imaging patients with iron overload, especially at 3.0 T.Acknowledgements
No acknowledgement found.References
1. Yin M, Glaser KJ, Talwalkar JA, Chen J, Manduca A, Ehman RL. Hepatic MR elastography: clinical performance in a series of 1377 consecutive examinations. Radiology. 2016;278(1):114-24.
2. Sirlin CB, Reeder SB. Magnetic resonance imaging quantification of liver iron. Magn Reson Imaging Clin N Am 2010;18(3):359-381.
3. Wagner M, Besa C, Bou Ayache J, et al. Magnetic resonance elastography of the liver: qualitative and quantitative comparison of gradient echo and spin echo echoplanar imaging sequences. Invest Radiol 2016;51(9):575-81.
Figures