0896
Identifying cerebral endophenotypes with associated clinical risk factors in preterm neonates1Centre for the Developing Brain, Division of Imaging Sciences and Bioengineering, King's College London, London, United Kingdom, 2Developmental Imaging, Murdoch Children's Research Institute, Melbourne, Australia
Synopsis
In this study, we combine multimodal neuroimaging and multivariate statistical analysis in a large cohort of preterm infants at term-equivalent age. We report a set of orthogonal imaging phenotypes associated with specific antenatal and postnatal factors that correlate with cognitive and motor outcomes at 2 years. We conclude that contemporaneous environmental factors including adverse intrauterine conditions and postnatal clinical management may prefigure the high incidence of neurocognitive impairment in preterm-born individuals via the cumulative expression of distinct diffuse injury patterns.
Introduction
Preterm birth is a leading cause of infant mortality and morbidity worldwide1. Preterm infants are at risk of a range of deficits across several domains including cognition, motor function and behaviour2,3. A comprehensive understanding of specific neuroanatomical patterns associated with the high incidence of neurocognitive impairment and the antecedents and vulnerabilities leading to them in preterm infants is lacking.
In this study, we begin to address this issue by combining multimodal neuroimaging and multivariate statistical analysis in a large cohort of preterm infants at term-equivalent age. We report a set of orthogonal imaging phenotypes associated with specific antenatal and postnatal factors that correlate with cognitive and motor outcomes at 2 years.
Methods
Infants were recruited from the ePrime RCT of MRI and cranial ultrasound (NCT01049594). Written parental consent was obtained for each infant. In total, 449 infants (226 male) with a median gestational age (GA) at birth of 30+1 weeks (range: 23+4 – 32+6 weeks) and a median postmenstrual age (PMA) at scan of 42+4 weeks (37+6 – 55+2 weeks) were included. Thirty-seven (8%) of the infants included for analysis had evidence of focal lesions or cysts (including PVL, HPI) on standard MRI. Clinical information including maternal/familial factors, antenatal factors (including chorioamnionitis and intrauterine growth restriction), and neonatal factors (such as gestational age at birth and respiratory support) was collected as part of the clinical trial.
3 Tesla MRI was performed using an 8-channel phased array head coil. T1-weighted MRI (TR/TE: 17/4.6ms; flip angle: 13°; slice thickness: 0.8mm; field-of-view: 210mm; matrix: 256×256), T2-weighted FSE (TR/TE: 14730/160ms; flip angle 90°; field-of-view: 220mm; matrix: 256×256; slice thickness: 2mm with 1mm overlap) and single-shot EPI diffusion imaging (32 directions; b-value: 750s/mm2; TR/TE: 8000/49ms; slice thickness: 2mm; field-of-view: 224mm; matrix: 128×128 mm; SENSE factor of 2) were acquired.
For each subject, we derived maps of brain tissue volume, T2 signal intensity, white matter fractional anisotropy (FA) and grey matter mean diffusivity (MD). Using FSL’s linked ICA (FLICA)4,5, a data-driven, unsupervised approach for multimodal image analysis, we decomposed the full imaging dataset into a set of 96 spatially independent components, each represented by one spatial map per imaging modality and linked via a single shared subject course, or component weight.
In order to explore the multivariate relationship between clinical and imaging variables, we entered the component weights derived from linked ICA alongside the set of clinical and environmental variables into canonical correlation analysis (CCA). Statistical significance of successive canonical correlations was assessed with a permutation test.
Results
CCA revealed five paired relationships between clinical and imaging data (all p < 0.05, 10000 permutations).
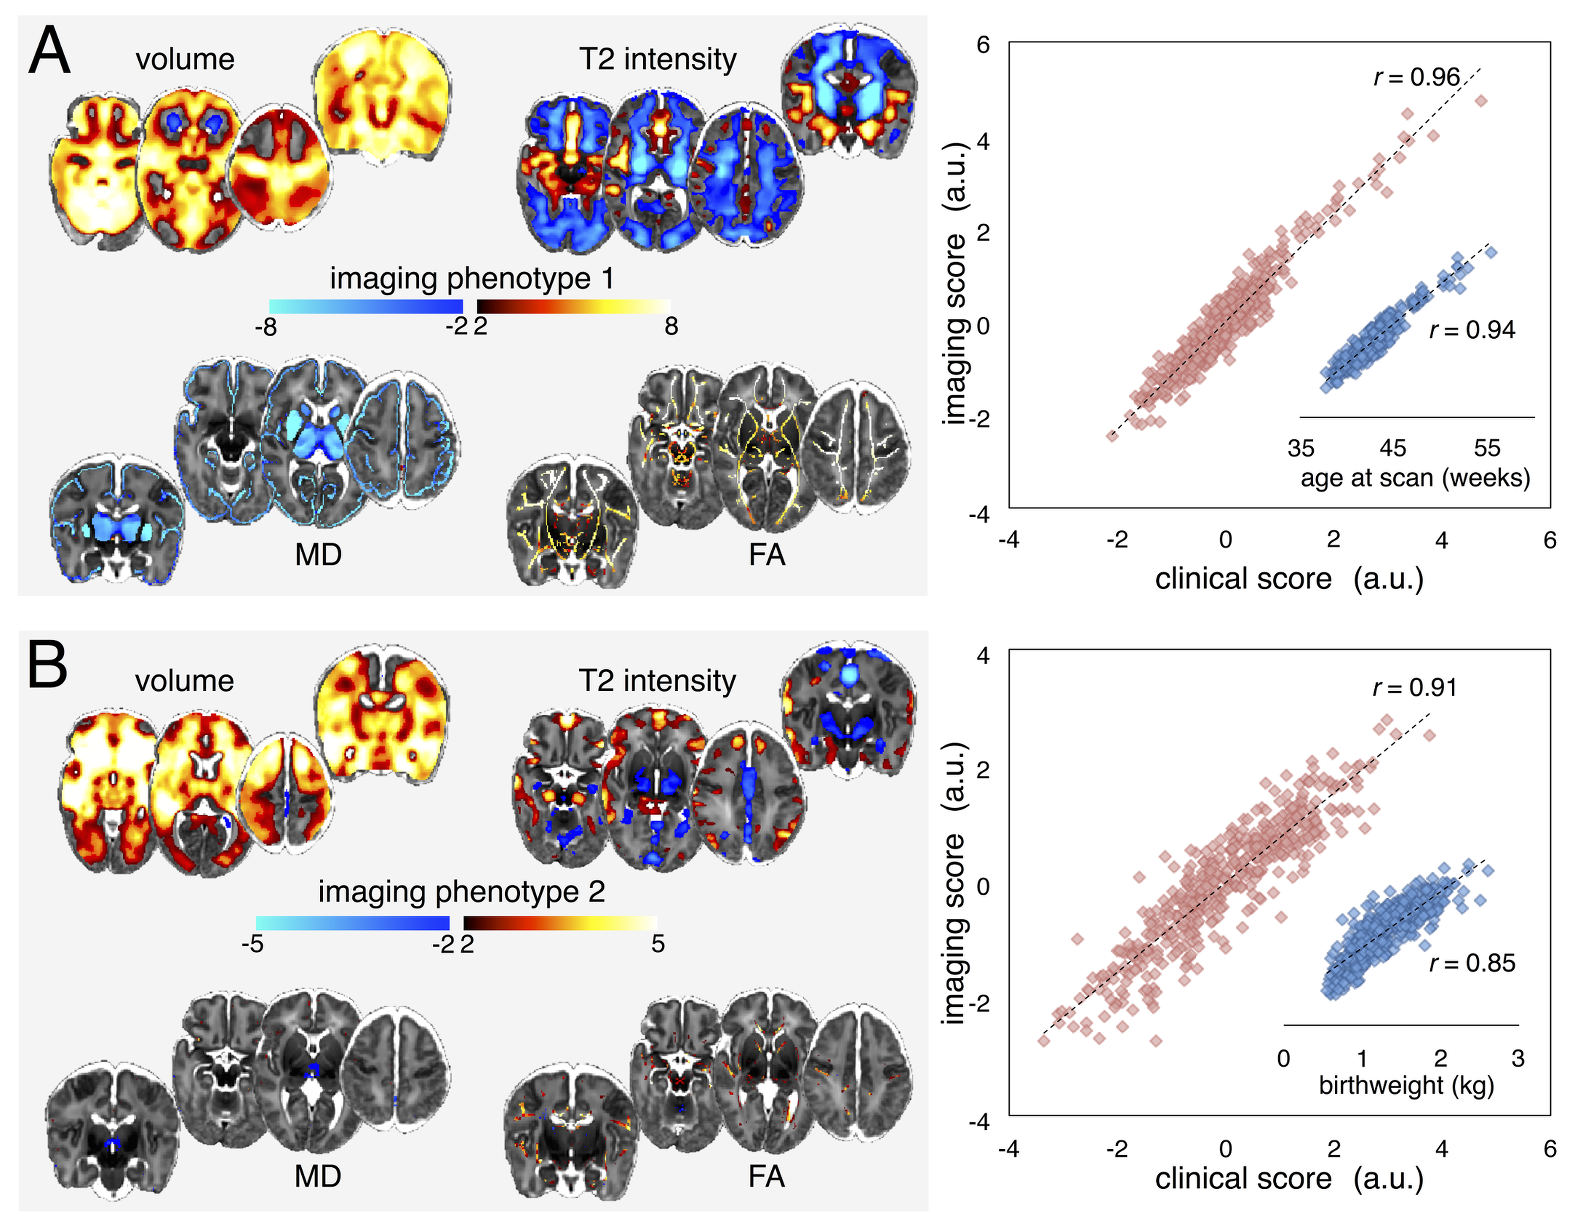
The first two clinical-image pairings linked increased grey matter volume, white matter FA and decreased grey matter diffusivity with age at scan (Fig 1A), and increased fronto-temporal volume and anisotropy in central white matter, and decreased T2 signal in the basal ganglia with increasing maturity/weight at birth (Fig 1B).
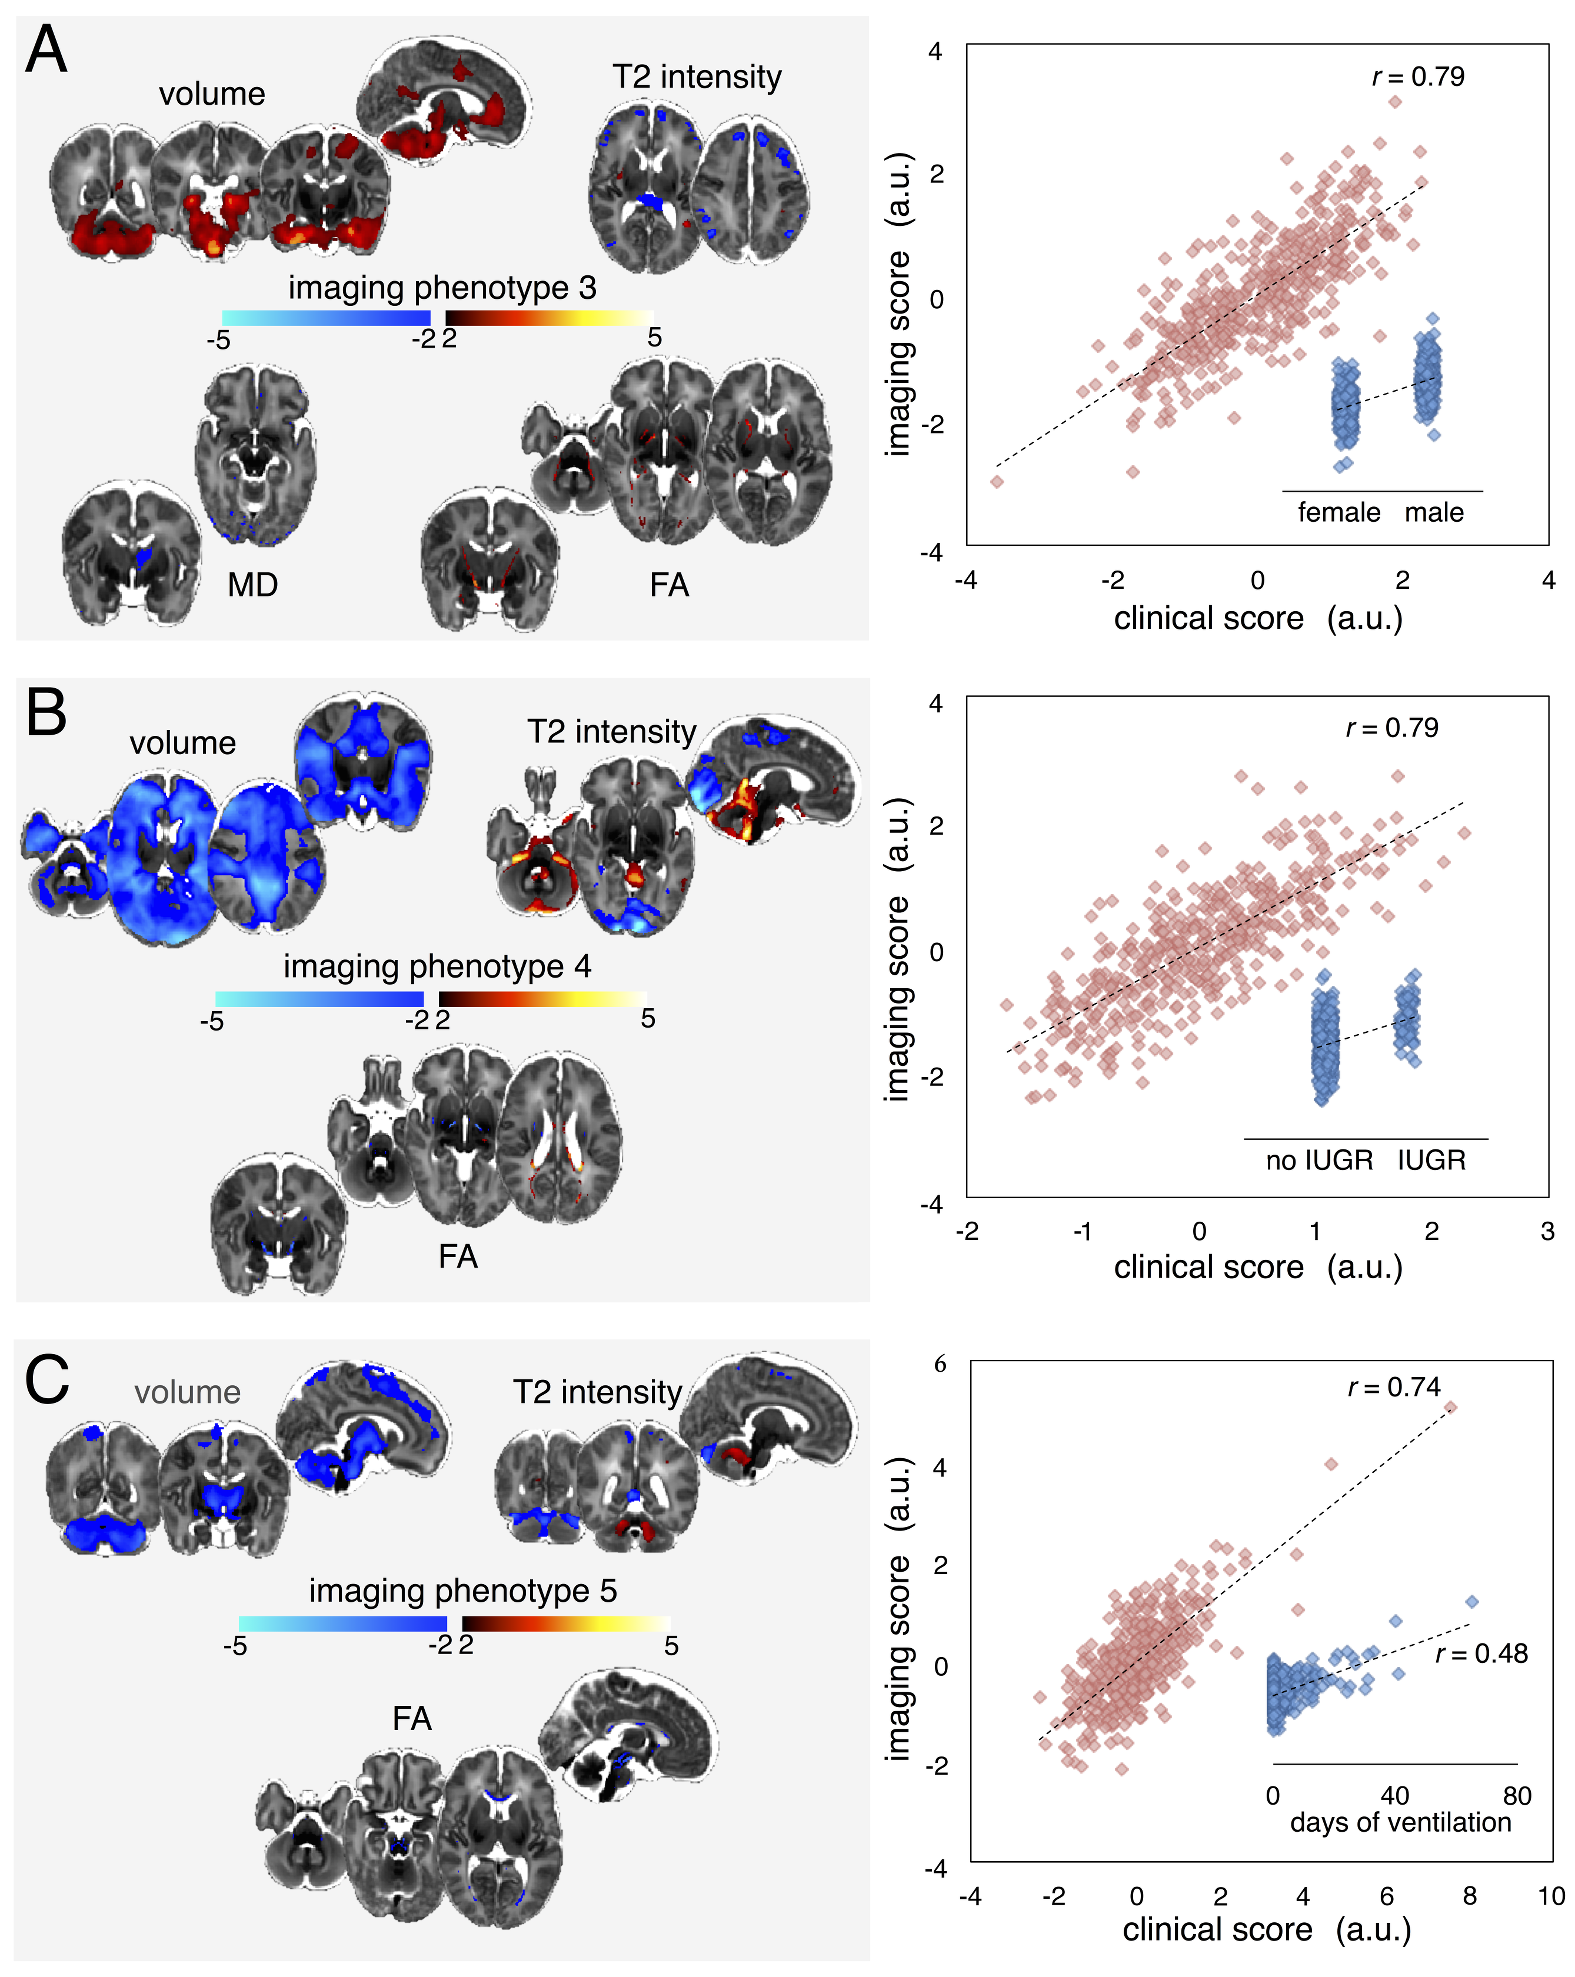
The third pair (Fig 2A), revealed a sexually dimorphic developmental pattern. Male sex was associated with increased brain tissue volume and anisotropy in the internal capsule with localised decreases in T2 signal intensity. When additionally correcting for intracranial volume (ICV), male sex was associated with only an increase in T2 signal in primary visual cortex.
The fourth imaging phenotype (Fig 2B) was associated with intrauterine complications including IUGR and maternal hypertension. These factors were associated with a global decrease in brain volume, alongside increased CSF surrounding the brainstem and cerebellum.
The final clinical-image pairing revealed a relationship between markers of postnatal sickness (mechanical ventilation, parenteral nutrition) and an imaging phenotype comprising reduced cerebellar, brain stem and basal ganglia volume, reduced FA in the brain stem and corpus callosum, and increased T2 signal intensity in the cerebellum. This imaging phenotype was robust to the inclusion of ICV in the CCA model.
Neurodevelopmental follow-up assessments were completed in 425 infants (96%) at 2 years. Cognitive outcome (Bayley-III) was associated with imaging phenotype 2 (F=10.5, p<0.001), and motor outcome with phenotypes 2 and 5 (F=18.8, 7.9; p<0.001, p<0.005).
Conclusions
Using a data-driven, machine learning approach, we identified a set of statistically independent patterns of brain development each associated with specific clinical risk factors. We demonstrate the presence of separable patterns of diffuse injury associated with prematurity, antenatal complications and postnatal illness within the same population. We conclude that contemporaneous environmental factors including adverse intrauterine conditions and postnatal clinical management may prefigure separable developmental trajectories via the cumulative expression of distinct imaging phenotypes in preterm-born individuals.Acknowledgements
This work was supported by the Medical Research Council (UK), the NIHR comprehensive BRC award to Guy's & St Thomas' NHS Foundation Trust in partnership with King's College London and King’s College Hospital NHS Foundation Trust. This work summarises independent research funded by the National Institute for Health Research (NIHR) under its Programme Grants for Applied Research Programme (Grant Reference Number RP-PG-0707-10154). The views expressed are those of the authors and not necessarily those of the NHS, the NIHR or the Department of Health.References
1. Blencowe, H. et al. National, regional, and worldwide estimates of preterm birth rates in the year 2010 with time trends since 1990 for selected countries: a systematic analysis and implications. The Lancet 379, 2162–2172 (2012).
2. Delobel-Ayoub, M. et al. Behavioral problems and cognitive performance at 5 years of age after very preterm birth: the EPIPAGE Study. Pediatrics 123, 1485–1492 (2009).
3. Marlow, N., Wolke, D., Bracewell, M. A., Samara, M. & EPICure Study Group. Neurologic and developmental disability at six years of age after extremely preterm birth. N. Engl. J. Med. 352, 9–19 (2005).
4. Groves, A. R., Beckmann, C. F., Smith, S. M. & Woolrich, M. W. Linked independent component analysis for multimodal data fusion. NeuroImage 54, 2198–2217 (2011).
5. Groves, A. R. et al. Benefits of multi-modal fusion analysis on a large-scale dataset: life-span patterns of inter-subject variability in cortical morphometry and white matter microstructure. NeuroImage 63, 365–380 (2012).
Figures