0890
In-Vivo Regional detection of Gly in Human Brain: Implications in Glioma Patients at 3T1Advanced Imaging Research Center, UT Southwestern Medical Center, Dallas, TX, United States
Synopsis
Glycine, an inhibitory-neurotransmitter and a co-agonist of N-Methyl-D-aspartate, has been implicated in rapid cancer cell-proliferation and is elevated in high-grade gliomas than low-grade. Gly concentrations range from 0.5-1.0 M in normal brain and exhibits regional-variation. Given such a low in-vivo concentration of Gly, potential overlap from mI and regional-variation, here we have developed a novel Gly-optimized single-voxel-localized triple-refocusing scheme for precise co-detection of Gly and mI in Gray-matter (GM)-rich Medial-Occipital (MO) and White-matter (WM) rich Left-Parietal (LP) healthy-brain region, and further extended to measure glycine level in glioma patients.
Introduction
Glycine, an inhibitory-neurotransmitter and a co-agonist of N-Methyl-D-aspartate, has been implicated in rapid cancer cell-proliferation1,2 and is elevated in high-grade gliomas than low-grade3. Abnormal levels of Gly have been observed in neuropsychiatric-disorders4. Prior 1H Magnetic Resonance Spectroscopy (MRS) measurement of Gly have reported concentrations ranging from 0.5-1.0 M in normal brain and, variable level of Gly across brain regions5,6,7. Since Gly exhibits regional-variation, alteration of Gly level in diseased condition must be compared to the matched-healthy-brain level. The Gly-singlet from two uncoupled-protons at 3.55 ppm is obscured by 4 J-coupled resonances of myo-inositol (mI) at 3.61 and 3.52 ppm. Given such a low in-vivo concentration of Gly, potential overlap from mI and regional-variation, here we have developed a novel Gly-optimized single-voxel-localized triple-refocusing scheme for precise co-detection of Gly and mI in Gray-matter (GM)-rich Medial-Occipital (MO) and White-matter (WM) rich Left-Parietal (LP) healthy-brain region, and further extended to measure glycine level in glioma patients.Methods
Volume-localized density-matrix simulations were performed to find the triple-refocusing sequence parameters for co-detection of Gly and mI. In-vivo 1H MR Experiments were carried out in 6 healthy subjects (3 female and 3 male, ages 20-30 years) on a whole-body 3T scanner (Philips Medical Systems). MR spectra were obtained from the medial occipital GM-dominant and left parietal WM-dominant regions (voxel-size 2.3´2.3´2.3 and 3.5´2.3´1.5 cm3, respectively). Clinical applications were performed in glioma patients. MRS acquisition parameters included TR=2s, sweep width = 2.5 kHz, sampling-points = 1024, and signal-averages = 128 with vendor-supplied water-suppression scheme. Unsuppressed water was obtained with short-TE (14 ms) STEAM and TR=2s. GM, WM, and CSF compositions within the voxel were estimated from the T1-weighted-images using Statistical-Parametric-mapping software. Spectral-fitting was performed with LCModel-software using numerically-calculated basis-spectra of 22 metabolites. Metabolite concentrations were calculated by setting the mean total-Creatine estimate of the medial occipital brain at 8 mM.Results and Discussions
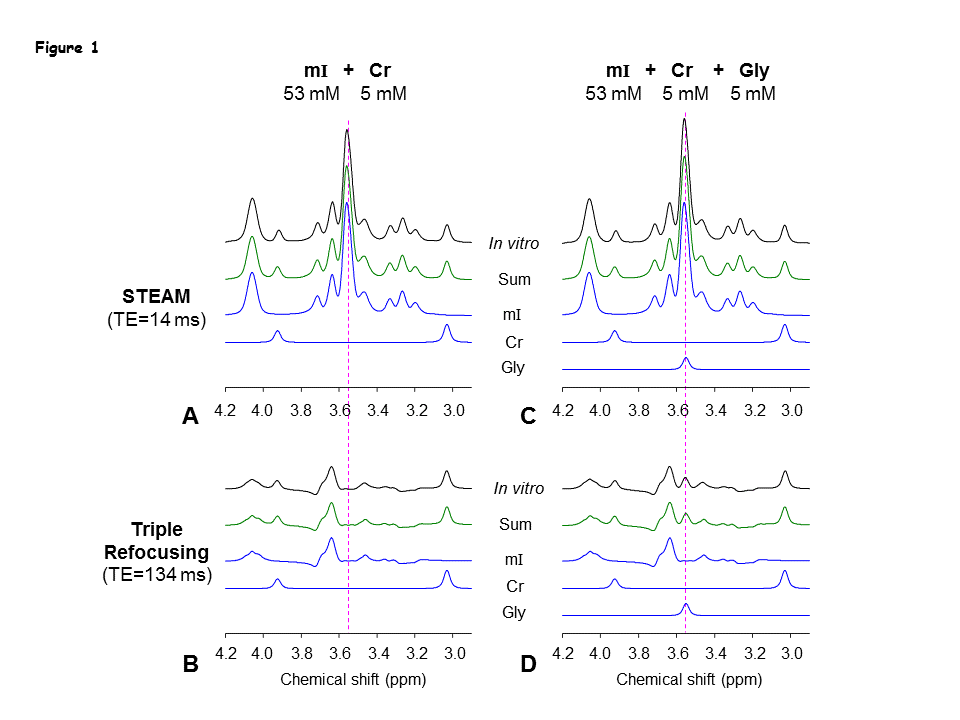
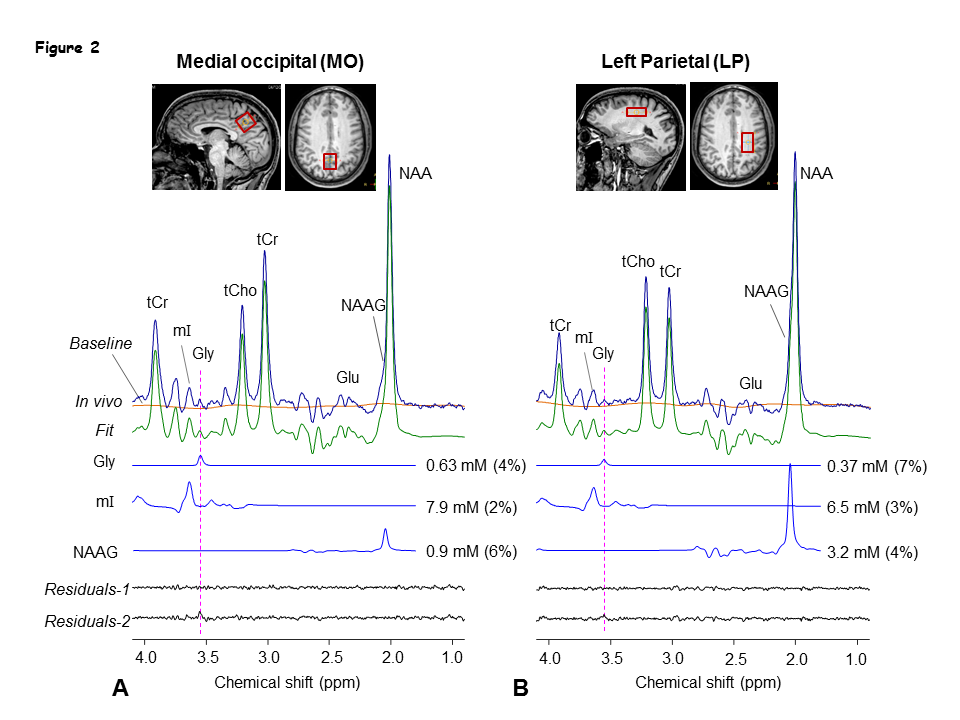
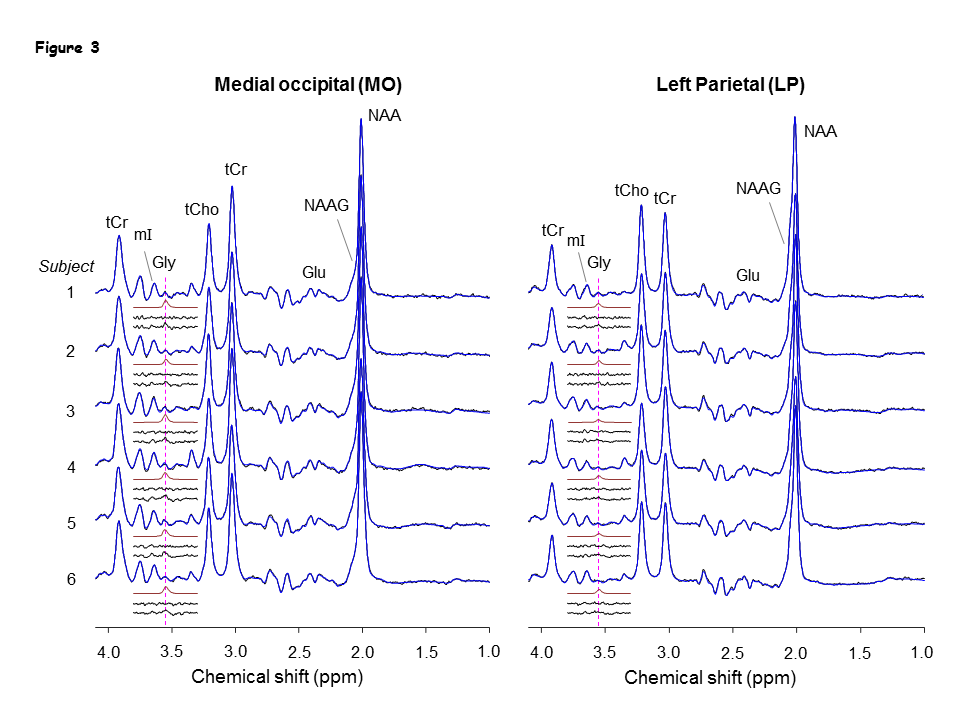
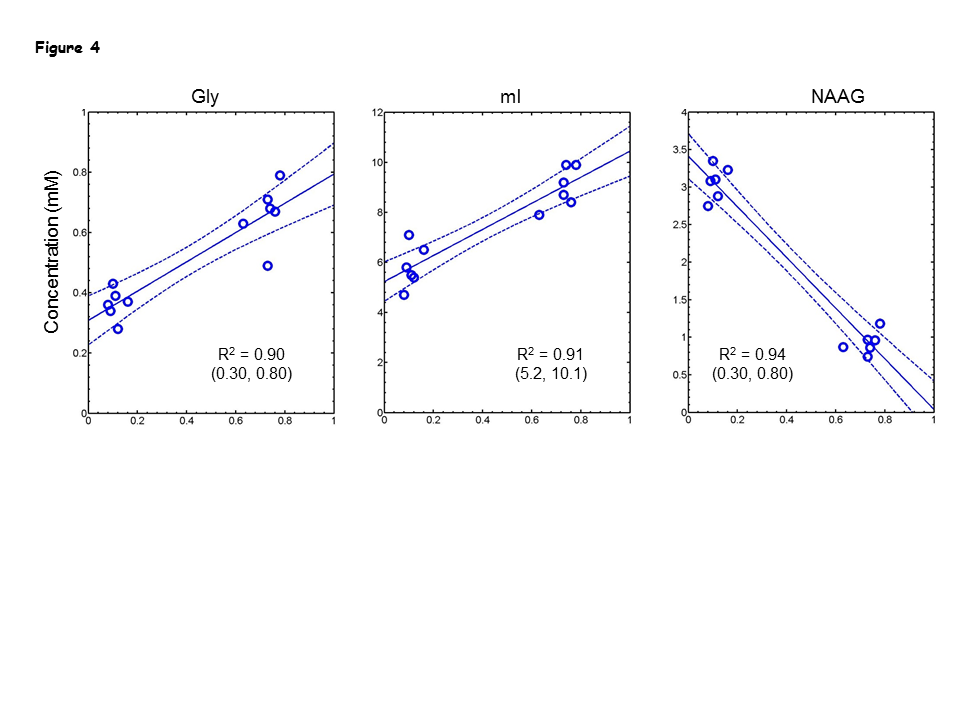
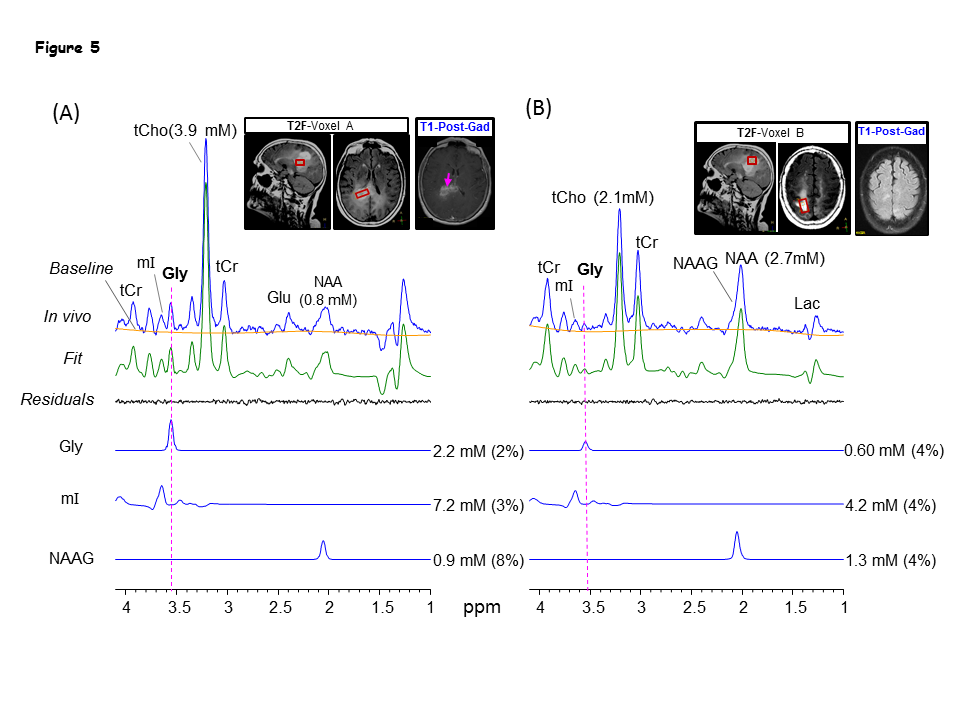
Numerical simulations showed that mI signal at ~3.55 ppm was small when TE1 = 32-50 ms, TE2<32 ms, and TE3 = 66-80 ms. Using criteria of small amplitude and variation of mI signal between 3.5-3.6 ppm, a triple-refocusing scheme for Gly detection was finalized as NS180 duration of 23 ms and TE = 134ms (TE1, TE2, TE3) = (36, 28, 70) ms. In-vitro validation of the optimized parameters showed that the large signal of mI 3.5ppm was suppressed to null and the spectral-region between 3.5-3.6ppm was nearly flat (Fig1 B and C) similar to that observed in calculated spectra. An in-vivo spectra from the MO region with GM content of 73% and LP brain-region with GM=10% of a healthy volunteer shows ~2-fold higher Gly concentration in the GM-dominant MO voxel compared to LP region (Fig.2). A larger residual at 3.5ppm (Residuals-2) was observed when the in-vivo data was fitted to a basis set without-Gly thus confirms the 3.55ppm signal to be from Gly. In-vivo spectra from all the healthy subjects normalized to GM+WM water (Fig.3) clearly shows high Gly and mI in GM-rich MO-region than WM-rich LP region while N-Acetyl-Aspartyl-Glutamic-acid (NAAG) was significantly (p<0.001) higher in WM-rich LP region compared to MO region. The fractional contents of GM, WM, and CSF were estimated to be 0.60±0.04, 0.22±0.04, and 0.18±0.03 for MO, and 0.11±0.03, 0.88±0.03, and 0.01±0.01 for LP, respectively. Linear regression of the Gly, mI and NAAG estimates with respect to fractional-GM content (Fig.4), i.e., fGM = GM/(GM+WM), gave pure GM vs WM concentrations of Gly (0.80 vs 0.30 mM), mI (8.6±0.6 vs. 5.3±0.8 mM ), NAAG(1.1 vs. 2.9 mM) respectively. MRS data from enhancing region (Fig.5A) of a Primary-GBM patient with an estimated GM-content of ~55% shows ~3-fold and ~8 fold high Gly (2.16 mM) compared to a pure-GM and pure-WM healthy brain glycine estimate. Interestingly while another tumor-region in the same patient which was not enhancing in the post-Gad-image (Fig.5B), shows ~3 fold lesser Gly than the enhancing region. However, Gly level (0.60 mM) in the non-enhancing tumor region estimated to be WM-dominant (fWM =82%) showed 50% higher Gly compared to pure-WM healthy-brain.Conclusion
Complete suppression of the mI-signal between 3.5-3.6 ppm was achieved using optimized triple refocusing sequence at 3T, permitting precise detection of the Gly 3.55-ppm signal as reflected by relatively small CRLBs. Although glycine is lower in WM-dominant region than GM-rich region, but was successfully estimated using optimized sequence. Clinical application of the optimized sequence in tumor subjects and estimation of Gly compared to matched healthy-brain-region together with estimate of GM and WM-content may precisely provide Gly-associated metabolic heterogeneity in tumors and may act as an indicator for malignancy.Acknowledgements
This study was supported by National Cancer Institute of the National Institutes of Health under Award Number R01CA184584 and by a Cancer Prevention Research Institute of Texas grant RP130427.References
1. Jain et al. Metabolite profiling identifies a key role for glycine in rapid cancer cell proliferation. Science 2012;336:1040-1044.
2. Tomita et al. Cancer Systems biology, metabolomics, and cancer metabolism. Science 2012;336:990-991.
3. Davies et al. Non-invasive detection of glycine as a biomarker of malignancy in childhood brain tumors using in-vivo 1H MRS at 1.5 tesla confirmed by ex-vivo high-resolution magic-angle spinning NMR. NMR Biomed 2010;23:80-87.
4. Eulenburg et al. Glycine transporters:essential regulators of neurotransmission. Trends Biochem Sci 2005;30:325-333.
5. Choi et al. Measurement of Glycine in the Human Brain in Vivo by 1H-MRS at 3T: Application in Brain Tumors. Magn Res Med.2012;66:609-618.
6. Ganji et al. In vivo 1H MRSI of Glycine in Brain Tumors at 3T. Magn Res Med.2016;75:52-62
7. Prescot et al. In vivo detetction of brain glyciene with echo-time-averages 1H Magnetic Resonance Spectroscopy at 4.0T. Magn Res. Med.2006;55:681-686.
Figures