0889
Polyunsaturated fatty acid (PUFA) is associated with tumour grading – An ex vivo study on whole breast tumours using multiple quantum coherence (MQC) MRS1Aberdeen Biomedical Imaging Centre, University of Aberdeen, Aberdeen, United Kingdom, 2Pathology Department, Aberdeen Royal Infirmary, Aberdeen, United Kingdom, 3School of Medicine, University of Aberdeen, Aberdeen, United Kingdom, 4Breast Unit, Aberdeen Royal Infirmary, Aberdeen, United Kingdom, 5Strathclyde Institute of Pharmacy and Biological Sciences, Glasgow, United Kingdom
Synopsis
Eicosanoids are derivatives of three different PUFA, vital in membrane formation and anti-inflammatory control. The presence of eicosanoids in adipose tissue and fibroblasts governs the release of signalling agents in breast, stimulating the invasion of breast cancer cells. Lipid composition has emerged as a potential predictor of breast cancer. However, current research focuses on the tumour initiation, while the understanding of lipid function in tumour progression remains sparse. We therefore hypothesise that there is a difference in PUFA concentration between grade II and III breast cancer. We applied MQC MRS for accurate PUFA measurement on freshly excised whole breast tumours.
Introduction:
Lipid composition has a significant role in human health, and has recently emerged as a potential predictor of breast cancer. BRCA1 and BRCA2 genetic mutation carriers (those at a high risk of developing breast cancer) present abnormal lipid and metabolite regulation in breast, suggesting aberrant lipid composition as a potential early predictor of breast cancer1. Eicosanoids derived from PUFA in breast tissue produce signalling agents, such as prostaglandins, which have strong impact on breast cancer development2. However, current research focuses on the role of lipids on tumour initiation, while the understanding of lipid function in tumour progression remains sparse. We therefore hypothesise that there is a difference in PUFA concentration between grade II and III breast cancer. To probe this hypothesis, we applied MQC MRS for accurate PUFA measurement on freshly excised whole breast tumour, while avoiding partial sampling in biopsy studies.Methods:
Twenty-four female patients (12 grade II and 12 grade III), aged between 39 - 78 years with invasive ductal carcinoma undergoing surgical intervention, were enrolled in the study. The patients have not received any hormonal therapy or chemotherapy. Upon the tumour excision, the fresh specimen was immediately transported to imaging facility as an acute study. Once the scan was completed, the specimen was transported to pathology for formalin treatment. The study was approved by NHS Research Ethics Service, and written informed consent was obtained prior to the MRS study.MRS Acquisition
Spectra were collected on a 3T whole body MRI scanner (Achieva TX, Philips Healthcare, Best, Netherlands) using body coil for transmission and a 32-channel head coil as the receiver. Scan protocol contained high resolution T1 weighted anatomical images, choline with unsuppressed water reference and PUFA spectrum. Tumour was identified on the anatomical images by an experienced radiographer, while MRS voxel was positioned snug fit to the tumour boundary. The choline spectrum was collected using PRESS sequence with CHESS water suppression, TR/TE of 1.5s/135ms and 128 averages. A corresponding water unsuppressed spectrum was collected using 16 averages. PUFA spectrum was acquired using MQC PRESS sequence with TR/TE 1.25s/130ms, spectral editing frequency at 2.8ppm, MQC encoding gradients of 50 and 100ms mT/m and 256 averages3.Data Processing
The tumour volume and surface area were quantified by manually tracing the tumour outline on anatomical images. MRS processing was performed in the jMRUI software using AMARES algorithm. The water (4.7ppm) and methyl lipid (1.3ppm) were quantified from unsuppressed spectrum to support internal referencing. Choline (3.2ppm) amplitude was obtained from choline spectrum, with choline concentration subsequently derived through internal water referencing4. PUFA amplitude (5.3ppm) was quantified from MQC spectrum, and its partition in total lipids, PUFA/lipid, was computed as the ratio between PUFA amplitude and total lipid amplitude.Statistical Analysis
Statistical analysis was performed using the STATA software package (StataCorp, College Station, Texas, USA). T-test was performed on the sample characteristics to identify potential bias between the groups. To examine the prognostic value of PUFA and choline, t-test was also performed on choline concentration and PUFA/lipid between the groups. Correlation analysis was performed to examine the relationships between PUFA/lipid and choline, between PUFA/lipid and voxel size, tumour volume and surface area. Significant findings were defined as p values smaller than 0.05.Results
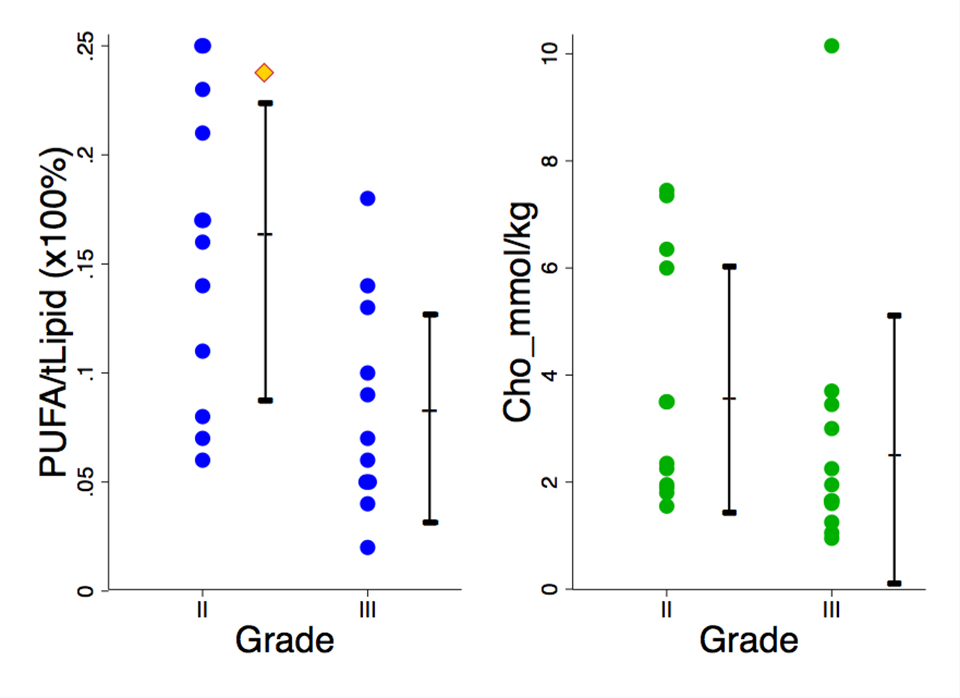
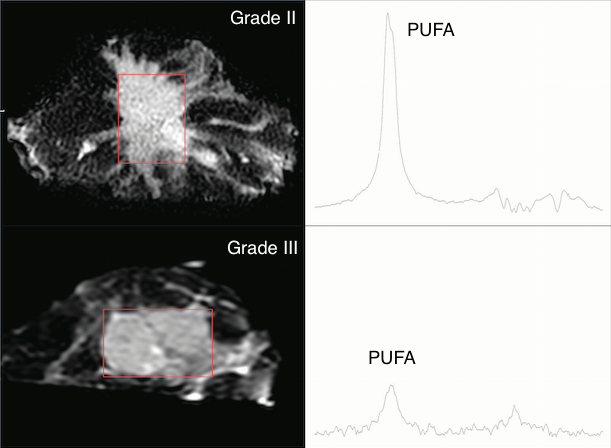
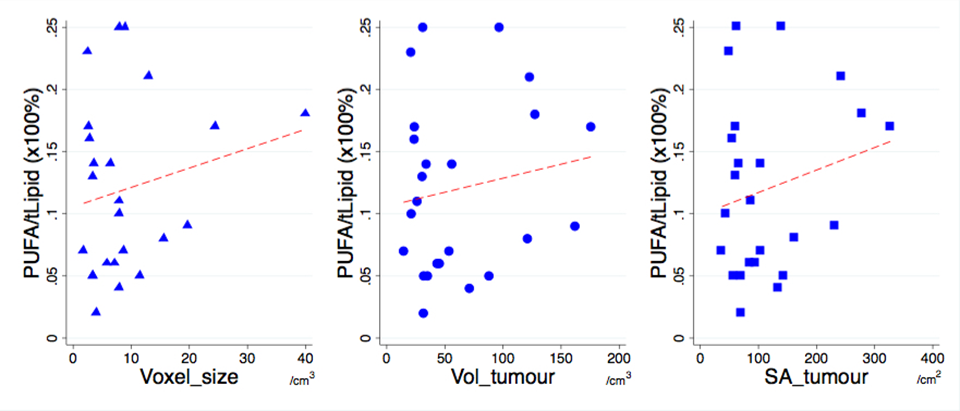
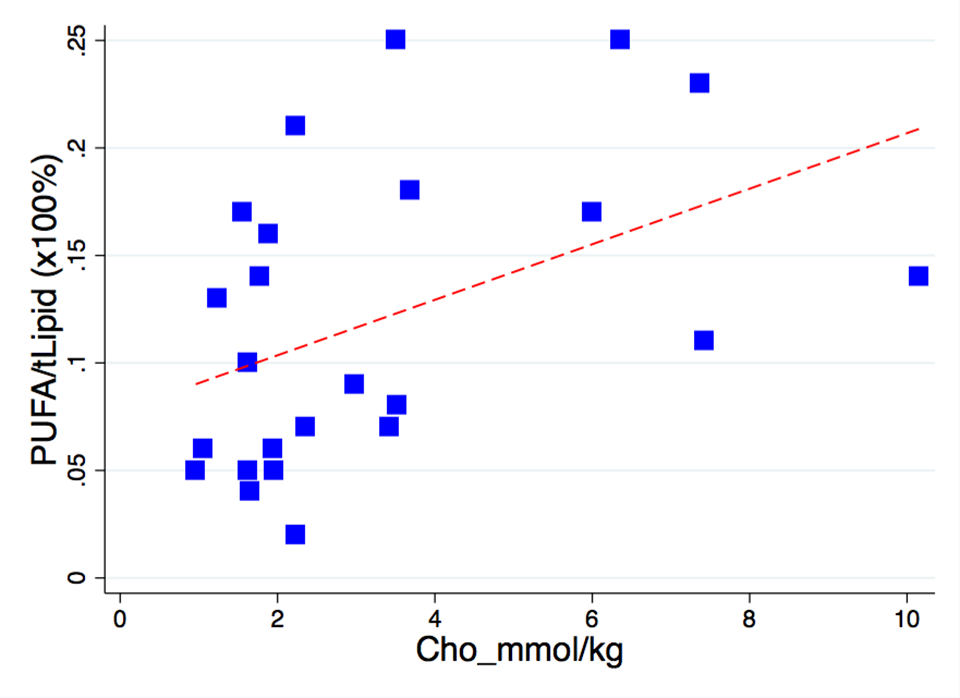
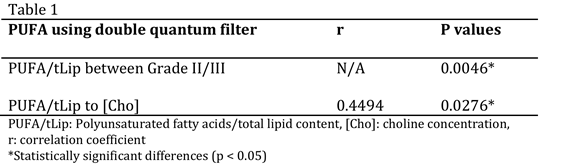
The mean PUFA/lipid was 0.12 ± 0.06 %, while choline concentration ranged from 1.0 to 10.2 mmol/kg over the entire cohort. PUFA/lipid was significantly higher in grade II compared to grade III group (Figure 1), while the difference in choline concentration was not statistically significant. The PUFA spectra from typical samples of each group are shown in Figure 2. There was no significant correlation between PUFA/lipid against voxel size, tumour volume or surface area (Figure 3). There was a significant correlation between PUFA/lipid and choline concentration (r=0.4494, p=0.0276) (Figure 4). The statistical findings are summarised in Table 1.Discussion
MQC MRS achieved robust water suppression in breast cancer, allowing accurate quantification of PUFA. Grade III tumours showed a diminished PUFA/lipid, indicating a shift towards inflammatory processes. Although choline is known to be related to membrane synthesis and correlates with PUFA/lipid, choline concentration does not appear as a sensitive prognostic marker. The independence between PUFA/lipid and voxel size demonstrates no bias arising from experimental setup, while dissociation from tumour volume and surface area highlights the fundamental nature of lipid composition in cancer biology.Conclusion
Lipid composition is a sensitive prognostic biomarker, where its relationship with choline concentration indicates the role of lipid composition in membrane formation. The lower PUFA in grade III tumours could be related to differences in prostaglandin synthesis.Acknowledgements
The authors would like to thank Dr Matthew Clemence for clinical scientist support, Bolanle Awote for patient recruitment, Dawn Younie for logistic support, Prof Andrew M Blamire for advice on MRS. This project is funded by Friends of ANCHOR, and Sai Man Cheung is jointly supported by Elphinstone scholarship, Roland Sutton Academic Trust and John Mallard scholarship.References
1. Ramadan, S., Arm, J., Silcock, J., et al. Lipid and Metabolite Deregulation in the Breast Tissue of Women Carrying BRCA1 and BRCA2 Genetic Mutations. Radiology. 2015; 275(3): 675 – 682.
2. Basu, S., Rossary, A., Vasson, M-P. Role of inflammation and eicosanoids in breast cancer. Lipid Technology. 2016; 28(3-4): 60 – 64.
3. He, Q., Shkarin, P., Hooley, R.J., et al. In vivo MR spectroscopic imaging of polyunsaturated fatty acids (PUFA) in healthy and cancerous breast tissues by selective multiple-quantum coherence transfer (Sel-MQC): A preliminary study. Magnetic Resonance in Medicine. 2007; 58(6): 1079 – 1085.
4. Bolan, P. J., Meisamy, S., Baker, E. H., et al. In vivo quantification of choline compounds in the breast with 1H MR spectroscopy. Magnetic Resonance in Medicine. 2003; 50(6): 1134 – 1143.
Figures