0888
Metabolic variability in a brief status epilepticus model1MRRC, University of Pittsburgh, Pittsburgh, PA, United States, 2Developmental Biology, Children's Hospital Pittsburgh, Pittsburgh, PA, 3Neurology, University of Pittsburgh, Pittsburgh, PA, 4Neurosurgery, Yale University, 5Allegheny Singer Research Institute, Pittsburgh, PA
Synopsis
This study uses short echo MR spectroscopy (TE 10ms) to study the metabolic changes seen in a status epilepticus kainate rodent model. Applied with a brief period (45min) of seizures, a hierarchical cluster analysis is performed on the spectroscopic changes measured 3days after the status injury. These data displayed a bimodal distribution characterizing two groups of animals, “more” or “less” injured. The classification persists into a repeat MRS measurement performed at 3wk, with the less injured group being able to recover; the more injured group did not recover well. Finally, this classification was consistent with Nissl based histological analysis.
Introduction
We investigate to what extent MR spectroscopy is informative on seizure linked injury. Many rodent models of epilepsy use a lengthy period (~3hr) of status epilepticus (SE) to subsequently generate epilepsy. The duration of the SE is known to have a non-linear effect on the experimental outcome, specifically a duration of 40-50min1 seems necessary in order to develop HSP72 expression or Fluoro-Jade injury. Whether or not such temporal dependence relates to the human disorder is unclear. However, this suggests that in rat models, different pathophysiological processes are provoked with progressively longer periods of SE. To investigate this, we used a comparatively brief 45min SE duration of the Hellier-Dudek2 kainate model to generate seizure linked injury. 3days later MRS is performed, repeated 3wks later and then animals sacrificed. A metabolomics approach was used for analysis.Methods
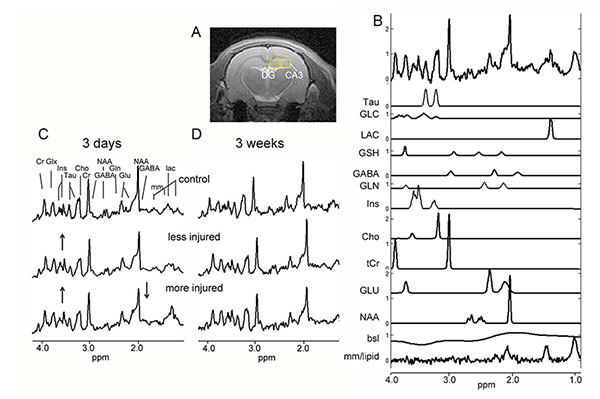
Per the Hellier-Dudek protocol, male Sprague-Dawley rats (n=21) received injections of 5mg/kg kainate (controls n=10 received saline) to generate status epilepticus (SE) lasting 45min. 3days after status, rats were studied at 7Tesla (Bruker) using single voxel (8ul) localized hippocampal PRESS acquisitions TE 10ms separately over the left and right hippocampus (dentate gyrus, DG). Shimming was performed using a Bolero3 acquisition (B0 loop encoded readout) achieving a typical σB0 of ~7Hz over the bilateral hippocampi. LCM analysis4 was used to determine metabolite profiles. Metabolites with Cramer Rao values of <15% were included in the analysis. Histology: n=8 of the kainate rats were processed with Nissl staining to assess neuronal loss and gliosis.Results
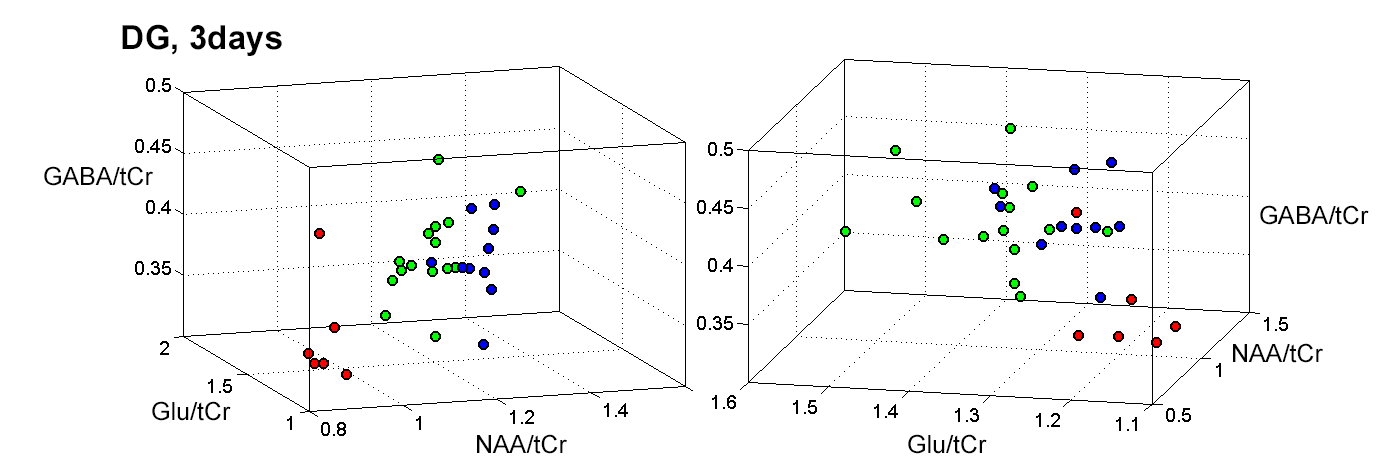
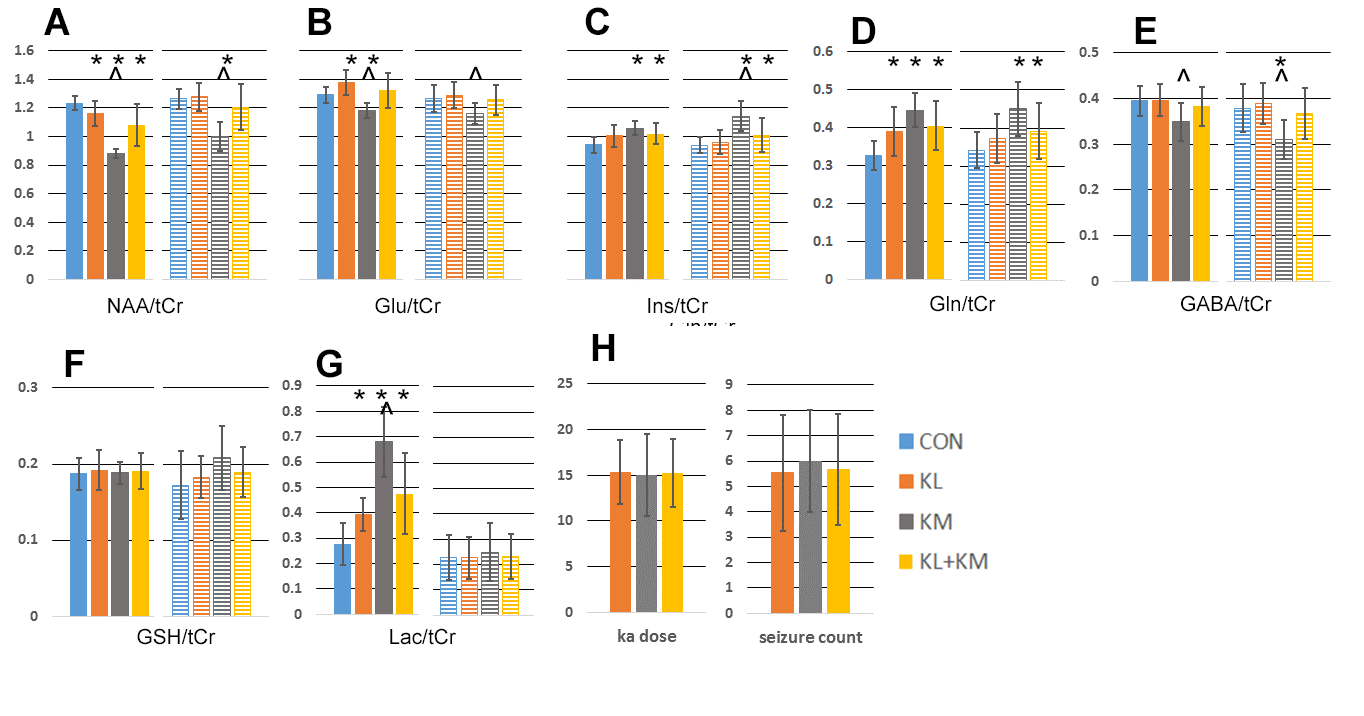
As anticipated, there is variability with the kainate treated animals, seen from the 3day and 3wk spectra from matched animals (Fig. 1). At 3days, all 45min rats showed changes consistent with the occurrence of seizures, with evidence for neuronal mitochondrial injury (decreased NAA/tCr), glial activation with osmotic changes and glutamine synthetase activation (Ins/tCr, Gln/tCr respectively). glycolytic energy production (Lac/tCr) commonly seen in seizures and post-status. Using a hierarchical cluster analysis based on 8 metabolites (NAA, glutamate, inositol, glutamine, GABA, glucose and lactate as ratios to total creatine tCr) from the DG voxel demonstrated a bimodal distribution. Fig. 2 shows 3D plots of the clusters, identifying red “KMI” kainate more injured group, n=6 rats; green “KLI” kainate less injured group n=15. The KMI group showed a large decline in NAA/tCr while the KLI group showed a much smaller decline. The differences between the KLI and KMI groups persisted into the 3wk timeframe. While both groups exhibited some recovery of NAA/tCr at 3wk, KLI returned to control values at 1.28±0.12, while the KMI group NAA/tCr value stayed depressed at 1.00±0.12 (control, 1.30±0.15). The 3wk KMI group continued to show significantly increased Ins/tCr and decreased Glu/tCr. In contrast, the 3wk KLI group had largely normalized (Fig. 3). A blinded histological analysis performed on n=8 kainate treated animals (4 from each KLI, KMI group) was consistent with the 3day MRS classification. Several regressions between neuronal and glial components were identified. While both KLI and KMI groups exhibited strong neuronal regressions (NAA/tCr with Glu/tCr), the KMI group exhibited a significant cross neuronal-glial regression, Glu/tCr with Ins/tCr (R=0.77, p<0.005); this regression was not identified in the KLI group (R=-0.17 non-significant).Discussion
A cluster analysis based on the 3day MRS metabolites segregated all the kainate treated animals into more vs. less injured groups. The 3day segregation persisted into 3wk and was meaningful for the Nissl analysis from the dorsal hippocampus. These findings are well understood in terms of glial and neuronal reaction. These data strongly argue that although all animals were prepared with the same length of apparent SE injury (with the metabolic injury anticipated to reflect one large Gaussian distribution of injury), the 3day bimodal distribution suggests that by that time, the SE injury provoked at least two different pathophysiological processes. The KLI animals were largely able to recover; however the KMI group did not recover as well, with persistent injury as demonstrated by the 3wk measurements and histology. While the dynamic range of parameters are similar between the two groups, regression analyses suggest with the healthier KLI group, neuronal and astrocytic parameters do not normally inter-relate. It is in the KMI group in which neuronal and astrocytic metabolites inter-relate, possibly reflecting a common pathologic process seen in epileptogenesis.Acknowledgements
Supported by R21 NS83035, R01 NS090417.References
1. Norwood BA, Bauer S, Wegner S et al. Electrical stimulation-induced seizures in rats: a "dose-response" study on resultant neurodegeneration. Epilepsia. 2011;52:e109-12.
2. Hellier JL, Dudek FE. Chemoconvulsant model of chronic spontaneous seizures. Curr Protoc Neurosci 2005;9:9-19.
3. Miyasaka N, Takahashi K, Hetherington HP. Fully automated shim mapping method for spectroscopic imaging of the mouse brain at 9.4 T. MRM 2006 Jan;55(1):198-202.
4. Provencher SW. Estimation of metabolite concentrations from localized in vivo proton NMR spectra. Magn Reson Med. 1993;30: 672-679.
Figures