0886
High and Ultra-High Field Proton MR Spectroscopy in Early Amyotrophic Lateral Sclerosis1University of Minnesota Twin Cities, Minneapolis, MN, United States
Synopsis
Amyotrophic lateral sclerosis (ALS) is a devastating disease of motor neurons with unknown etiology. Evidence suggests that the brain undergoes degenerative changes in ALS, particularly within areas of the descending motor pathway. Identifying robust and non-invasive biomarkers that are sensitive to neurodegeneration in ALS is essential for improving clinical trial design and assessment of treatment effectiveness. This study evaluated 1H-MRS-measured metabolite levels as biomarkers of disease severity. Ultra-high field (7 tesla) 1H-MRS revealed metabolic abnormalities in the motor cortex and brainstem of humans with ALS that are dependent on disease stage.
Purpose
Amyotrophic lateral sclerosis (ALS) is a fatal adult-onset neurodegenerative disease characterized by rapid loss of voluntary muscle function. Degenerative changes within motor areas of the brain are known to occur in ALS, and a major impediment in therapy development has been the lack of robust biomarkers of cerebral pathology.1 Previous proton MRS (1H-MRS) studies in ALS have produced conflicting findings regarding alterations in the levels of potential disease-related neurochemical markers such as glutamate and myo-inositol (mIns).2-4 We hypothesized that neurochemical levels are dependent on disease stage in ALS, potentially explaining dissimilar findings observed for cohorts consisting of subjects at different disease-stages. Our goal in this study was to identify neurochemical abnormalities specifically associated with early-stage ALS using single-voxel 1H-MRS at 7 tesla (T). Motivated by a recent report of lower glutathione (GSH) in ALS,5 we further quantified GSH in the same subjects by spectral editing at 3 T.Methods
Nineteen subjects with ALS and 17 age- and gender-matched healthy controls participated in the study. Subjects with ALS were determined to have either possible, probable, or definite ALS based on revised El Escorial diagnostic criteria.6 Scores on the validated ALS Functional Rating Scale-Revised (ALSFRS-R),7 site of onset, most affected side of the body, and disease duration were recorded.
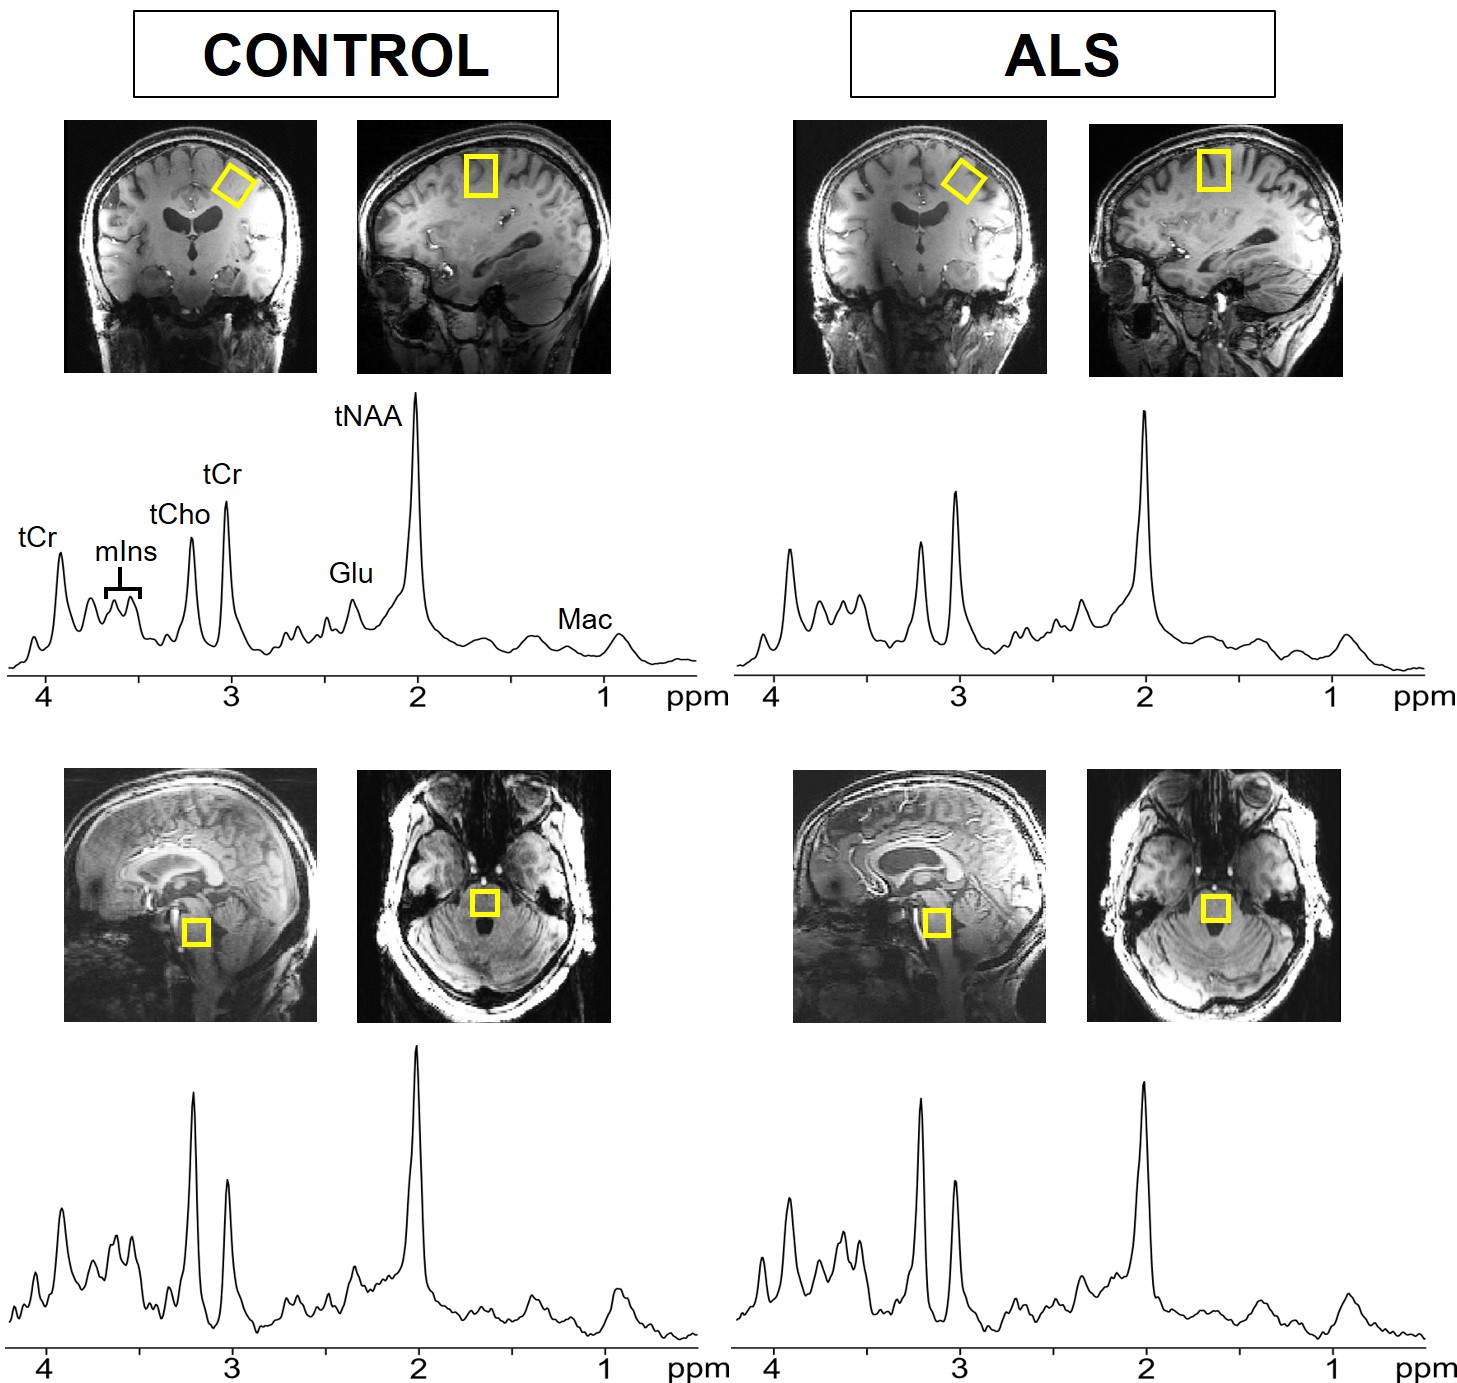
Single-voxel 1H-MRS was performed using a 16-channel transceiver coil8 on a 7 T scanner (Siemens Erlangen). Spectra from the motor cortex (2.2 x 2.2 x 2.2 cm3, placed contralaterally to the most affected side) and pontine brainstem (1.6 x 1.6 x 1.6 cm3) were acquired using semi-LASER9 (TR = 5 s, TE = 26 ms, 64 averages) (Fig. 1). GSH in the motor cortex was quantified by spectral editing at 3 T in the same subjects using MEGA-PRESS10 (TR = 2 s, TE = 68 ms, 512 averages; VOI: 3.5 x 2.5 x 2.3 cm3) (Fig. 2).
Metabolite concentrations were determined by LCModel11 with water-scaling, as described previously.12,13 Only metabolites quantified with mean Cramer-Rao Lower Bounds less than 20% were reported (Fig. 3). Pairs of metabolites with strong cross-correlations (r<-0.7) were reported as sums. Neurochemical levels were compared using ANCOVA adjusted for hemisphere scanned. Pearson’s correlation coefficients were calculated to estimate correlations between neurochemical levels and clinical status measures.
Results
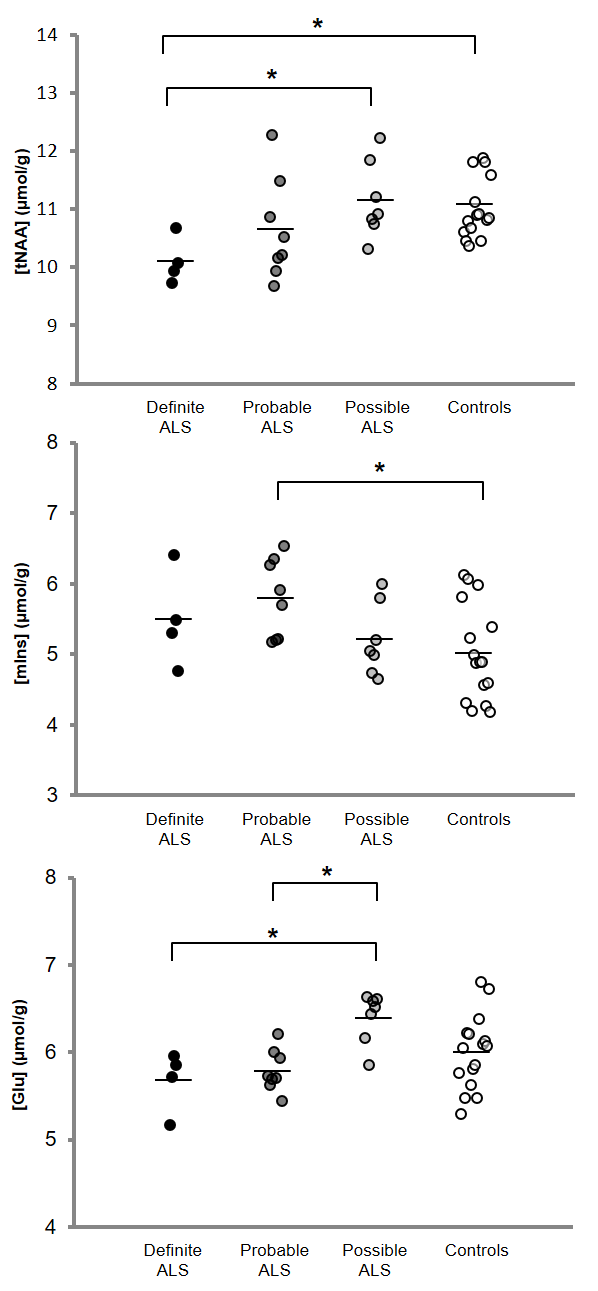
High quality spectra were obtained in both subject groups (Figs. 1, 2). Subjects with ALS were studied at relatively early stage compared to prior studies2,14 (ALSFRS-R mean±SD: 39.8±5.6) and displayed higher mIns levels (p<0.01) and a lower tNAA (N-acetylaspartate+N-acetylaspartylglutamate) over mIns ratio in the motor cortex and pons compared to controls (Fig. 3). To investigate if neurochemical levels were different at different diagnostic stages of ALS, we separated the ALS cohort into El Escorial diagnostic classifications. Total NAA levels in the motor cortex were lower in subjects with definite ALS than those with possible ALS and healthy controls (p=0.04) (Fig. 4). Glutamate (Glu) levels in subjects with probable or definite ALS were lower compared to those with possible ALS (p=0.01). Combined probable/definite ALS had lower tNAA than possible ALS and controls (both p=0.03), higher mIns than controls (p<0.01), and lower Glu than possible ALS (p<0.01). No group differences in GSH levels were observed using either 7 T non-edited or 3 T edited 1H-MRS. A positive correlation was observed between ALSFRS-R and tNAA/mIns (r=0.56; p=0.01). No correlations were observed between neurochemical levels and disease duration.Discussion
Higher mIns levels and lower tNAA/mIns ratio in the motor cortex and pons of humans with ALS are consistent with previous findings2,15 and suggest glial proliferation and neuronal dysfunction or loss in these regions. Group differences in motor cortex tNAA levels became apparent only when comparing subjects with probable or definite ALS to controls. Importantly, while numerous studies reported lower tNAA levels in subjects with ALS than in controls, most of them restricted their enrollment to probable/definite ALS.2 Conversely, a few studies that did not report alterations notably also included possible ALS.3,16 Our study suggests that discrepancies among previous findings in both NAA and Glu are explained by cohort differences in the proportion of enrolled subjects belonging to each El Escorial category. Our data show that Glu levels are lower in probable/definite ALS compared to other groups, supporting previous studies that reported lower Glu as evidence of neuron loss in ALS.4,17 Finally, the differences in tNAA, mIns, and Glu levels between the El Escorial categories suggest that these metabolite levels change with disease stage. Longitudinal MRS investigations will be critical to fully evaluate the progression of these MRS markers in ALS.Acknowledgements
This project was supported by the Bob Allison Ataxia Research Center, the University of Minnesota Foundation, and the NIH P41 EB015894 and P30 NS076408.References
1. Turner MR, Kiernan MC, Leigh PN, Talbot K. Biomarkers in amyotrophic lateral sclerosis. Lancet Neurol. 2009; 8(1): p. 94-109.
2. Foerster BR, Pomper MG, Callaghan BC, Petrou M, Edden RA, Mohamed MA, Welsh RC, Carlos RC, Barker PB, Feldman EL. An imbalance between excitatory and inhibitory neurotransmitters in amyotrophic lateral sclerosis revealed by use of 3-T proton magnetic resonance spectroscopy. JAMA Neurol. 2013; 70(8): p. 1009-16.
3. van der Graaff MM, Lavini C, Akkerman EM, Majoie Ch B, Nederveen AJ, Zwinderman AH, Brugman F, van den Berg LH, de Jong JM, de Visser M. MR spectroscopy findings in early stages of motor neuron disease. AJNR Am J Neuroradiol. 2010; 31(10): p. 1799-806.
4. Kalra S, Seres P, Choi C. In vivo quantification of excitatory and inhibitory neurotransmitters in amyotrophic lateral sclerosis. Proceedings of the International Society of Magnetic Resonance in Medicine 2013.
5. Weiduschat N, Mao X, Hupf J, Armstrong N, Kang G, Lange DJ, Mitsumoto H, Shungu DC. Motor cortex glutathione deficit in ALS measured in vivo with the J-editing technique. Neurosci Lett. 2014; 570: p. 102-7.
6. Brooks BR, Miller RG, Swash M, Munsat TL, World Federation of Neurology Research Group on Motor Neuron D. El Escorial revisited: revised criteria for the diagnosis of amyotrophic lateral sclerosis. Amyotroph Lateral Scler Other Motor Neuron Disord. 2000; 1(5): p. 293-9.
7. Cedarbaum JM, Stambler N, Malta E, Fuller C, Hilt D, Thurmond B, Nakanishi A. The ALSFRS-R: a revised ALS functional rating scale that incorporates assessments of respiratory function. BDNF ALS Study Group (Phase III). J Neurol Sci. 1999; 169(1-2): p. 13-21.
8. Adriany G, Van de Moortele PF, Ritter J, Moeller S, Auerbach EJ, Akgun C, Snyder CJ, Vaughan T, Ugurbil K. A geometrically adjustable 16-channel transmit/receive transmission line array for improved RF efficiency and parallel imaging performance at 7 Tesla. Magn Reson Med. 2008; 59(3): p. 590-7.
9. Oz G, Tkac I. Short-echo, single-shot, full-intensity proton magnetic resonance spectroscopy for neurochemical profiling at 4 T: validation in the cerebellum and brainstem. Magn Reson Med. 2011; 65(4): p. 901-10.
10. Mescher M, Merkle H, Kirsch J, Garwood M, Gruetter R. Simultaneous in vivo spectral editing and water suppression. NMR Biomed. 1998; 11(6): p. 266-72.
11. Provencher SW. Estimation of metabolite concentrations from localized in vivo proton NMR spectra. Magn Reson Med. 1993; 30(6): p. 672-9.
12. Marjanska M, Lehericy S, Valabregue R, Popa T, Worbe Y, Russo M, Auerbach EJ, Grabli D, Bonnet C, Gallea C, Coudert M, Yahia-Cherif L, Vidailhet M, Meunier S. Brain dynamic neurochemical changes in dystonic patients: a magnetic resonance spectroscopy study. Mov Disord. 2013; 28(2): p. 201-9.
13. Terpstra M, Cheong I, Lyu T, Deelchand DK, Emir UE, Bednarik P, Eberly LE, Oz G. Test-retest reproducibility of neurochemical profiles with short-echo, single-voxel MR spectroscopy at 3T and 7T. Magn Reson Med. 2016; 76(4): p. 1083-91.
14. Mitsumoto H, Ulug AM, Pullman SL, Gooch CL, Chan S, Tang MX, Mao X, Hays AP, Floyd AG, Battista V, Montes J, Hayes S, Dashnaw S, Kaufmann P, Gordon PH, Hirsch J, Levin B, Rowland LP, Shungu DC. Quantitative objective markers for upper and lower motor neuron dysfunction in ALS. Neurology. 2007; 68(17): p. 1402-10.
15. Kalra S, Hanstock CC, Martin WR, Allen PS, Johnston WS. Detection of cerebral degeneration in amyotrophic lateral sclerosis using high-field magnetic resonance spectroscopy. Arch Neurol. 2006; 63(8): p. 1144-8.
16. Rule RR, Suhy J, Schuff N, Gelinas DF, Miller RG, Weiner MW. Reduced NAA in motor and non-motor brain regions in amyotrophic lateral sclerosis: a cross-sectional and longitudinal study. Amyotroph Lateral Scler Other Motor Neuron Disord. 2004; 5(3): p. 141-9.
17. Atassi N, Triantanfyllou C, Keil B, Lawson R, Kaplan L, Dheel C, Murphy A, Berry J, Salibi N, Seethamraju R, Rosen B, Cudkowicz M, Ratai E. Ultra High-Field (7T) Magnetic Resonance Spectroscopy (MRS) in People with Amyotrophic Lateral Sclerosis (ALS). Proceedings of the International Society of Magnetic Resonance in Medicine. 2013.
Figures