0885
Automatic tissue-type classification of 1H-MRSI spectra in patients with glioblastoma1SCAN / Neuroradiology, University Hospital Bern (Inselspital), Bern, Switzerland, 2Institute for Surgical Technology & Biomechanics, University of Bern, Bern, Switzerland
Synopsis
Clinical-routine MRSI-data analysis is commonly performed through the visual inspection of multiple metabolite and metabolite-ratio maps, and aims at translating the different spectroscopic patterns into known tissue-types, such as, necrosis, solid tumour, tumour-infiltration, normal-brain-tissue, etc. Such translation/segmentation requires solid expertise in MR-spectroscopy, which most clinicians do not have. Bad-quality-data, as well as frequency-dependant-selection-profiles further complicate proper interpretation of MRSI-data. Therefore, to facilitate the clinical-use of MRSI, we present an automatic MRSI-tissue-type segmentation algorithm, that includes automatic-quality-filtering and selection-profile-correction. The method was tested in glioblastoma and the tissue-types were compared against an MRI-based tumour-segmentation-method.
Purpose
The work here presented had the following goals:
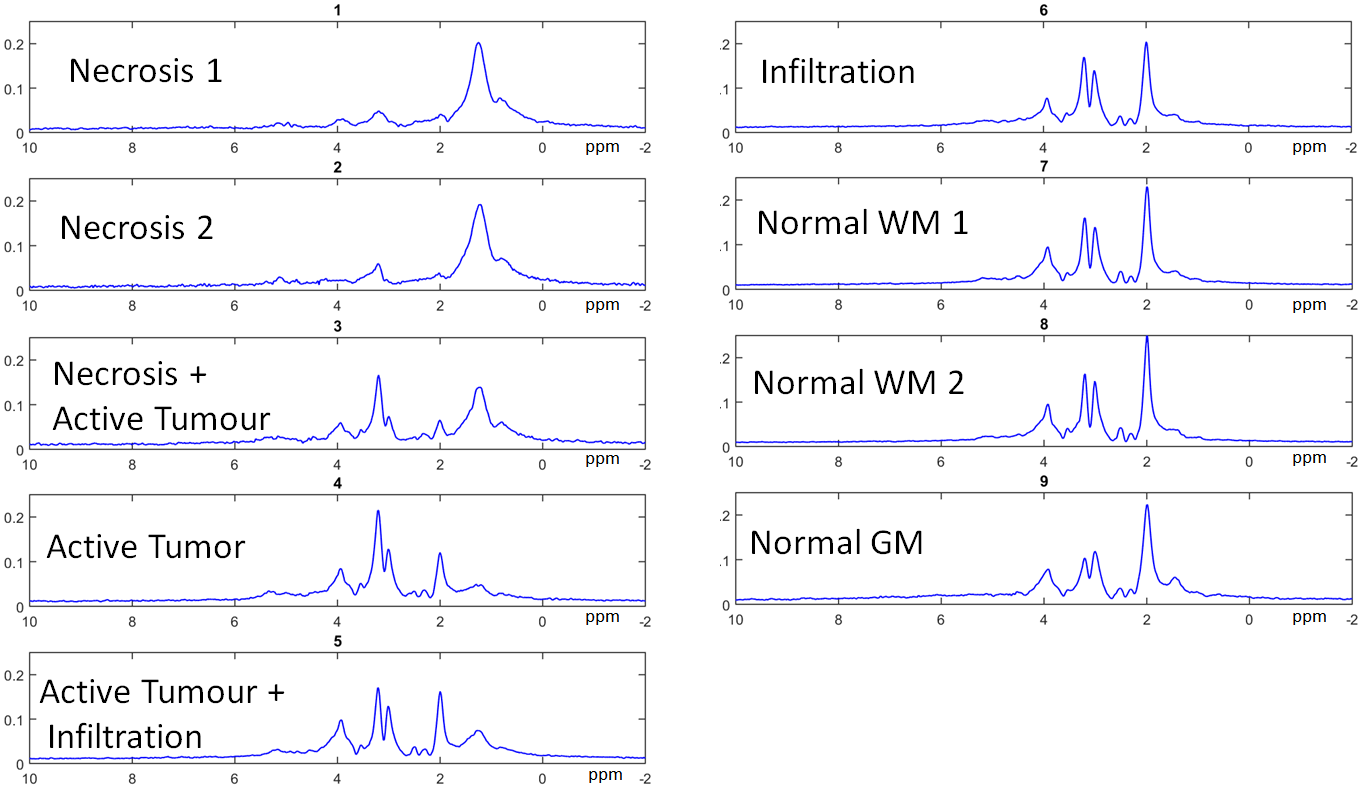
1. To identify the most important spectroscopic patterns characteristic of different tissue-types present in 1H-MRSI of glioblastoma.
2. To develop a tissue-classification-method for segmenting MRSI maps of glioblastoma patients.
3. To compare the spatial-distributions of the different identified MRS-based tissue-types with the tissue-types identified by an MRI-based automatic-tumour-segmentation-method, BraTumIA1,2.
Methods
The development of the MRSI-segmentation method was made in two steps. First, the main spectroscopic patterns present in MRSI of glioblastoma patients were identified by clustering a training-set containing data from 17 different patients. Second, the mean feature-values of the different identified clusters were used to classify the spectra of 5 new patients, thus segmenting the MRSI-grid into the previously-identified tissue-types. An important aspect of the strategy used here is the choice of the clustering method. For that purpose, X-means3 was used, which has the advantage that it determines the number-of-clusters based on the data, not requiring any assumption regarding the number of existent spectroscopic-patterns/clusters beforehand. Moreover, given that it works in a hierarchical fashion it allows for the detection of clusters of different sizes, what is especially relevant for this problem, given that the number of healthy-brain-tissue voxels is normally considerably greater than the one of tumorous-tissue voxels.
The 22 pre-operative imaging studies of glioblastoma patients used in this study contained imaging (T1, T2, T1c, FLAIR) and 1H-MRSI (2D-PRESS, CHESS, TE=135ms, TR=1500ms; 32x32 interpolated from 12x12), and were acquired on two 1.5T Siemens scanners (Aera, Avanto). The measurements were performed conforming to local and national ethical regulations: all patients gave their informed consent to use the data for scientific purposes.
All spectra were pre-processed using jMRUI’s SpectrIm plug-in (residual-water-removal HLSVD, automatic-quality-filtering4,5, frequency-shift-correction, auto-phasing). Quantification was performed with QUEST6, using a model containing following metabolites: Cho, Cr, NAA, Lip1.3, Lac, Lip0.9, mIno, and Glx. Due to large variances in peak area estimates, the results of Glx, mIno and Lip 0.9 were not included in the features used for clustering the data. Lactate and Lip1.3 were combined given the common errors in resolving these two peaks. The quantification results were corrected for differences in the RF-pulses’ selection profile and chemical shift displacement errors, using pre-acquired MRS-phantom data.
For the clustering using X-means the following features were used: Cho/Cr, NAA/Cho, NAA/Cr, (Lip1.3+Lac)/Cr, (Lip1.3+Lac)/NAA, (Lip1.3+Lac)/Cho). For each cluster, a tissue-type/metabolic-state was assigned by an experienced spectroscopist, based on the corresponding cluster-mean feature-values and cluster-mean spectra.
The MRSI-segmentation performed on the 5 test studies, assigned to each spectroscopic-voxel the closest cluster. The metabolite maps were interpolated to 64x64 prior to MRSI-segmentation and the resolution of the BraTumIA segmentation was downscaled to match the resolution of the spectroscopy.
MRI segmentation was performed using BraTumIA, an automatic segmentation method that was trained on manually segmented MR-images of glioblastoma patients. BraTumIA requires as input T1, T1c, T2 and FLAIR, and segments the images into the following tissue-types: white-matter, grey-matter, CSF, edema, non-enhancing-tumour, enhancing-tumour and necrosis.
The results of MRSI and MRI segmentations were compared.
Results/Discussion
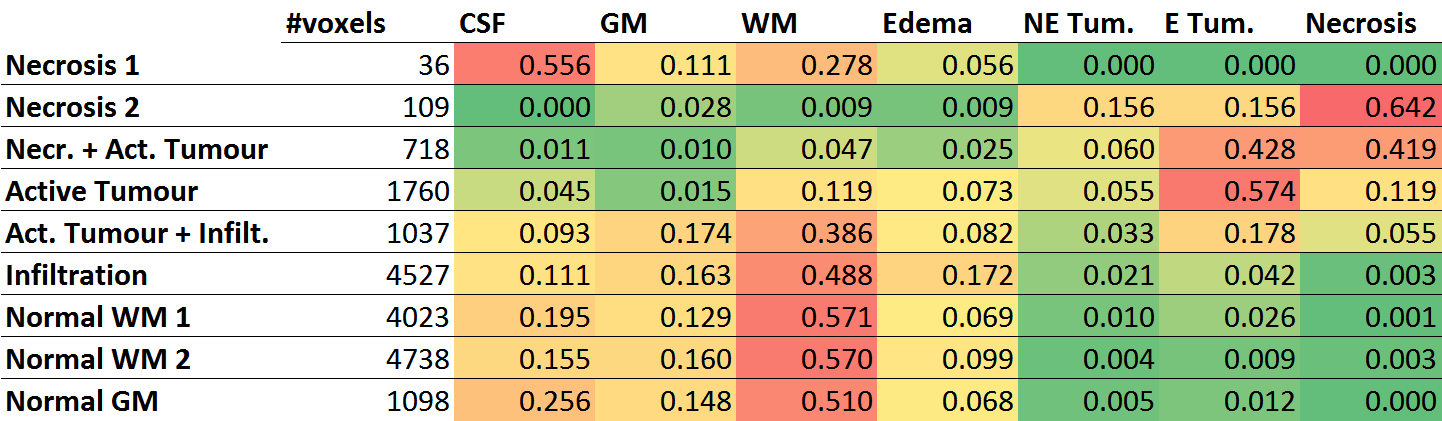
Figure 1 shows the different representative cluster-mean spectra of the identified clusters, as well as the corresponding assigned labels. The patterns were ordered according to their malignancy. In Figure 2 an example of a comparison between the segmentation performed by BraTumIA (left) and the MRSI-segmentation (right) is presented. The maps show good concordance, still the differences in spatial resolution are noticeable. Figure 3 shows the number of voxels from the test-set assigned to each cluster, as well the ratio of voxels from each cluster assigned to each of the MRI-segmentation tissue-types. Besides a general good agreement between both types of segmentation, a few points should be highlighted. First, the cluster “necrosis 1” is unexpectedly found in healthy brain-tissue. A closer look at the corresponding mean feature values showed that this originates from a fitting error, when due to low-SNR and/or broad linewidths, creatine is fitted in the place of choline. Second, the MRSI-segmentation detected patterns of tumour-infiltration7 (increased Cho/Cr and Cho/NAA) in regions identified by BraTumIA as white-matter. Third, possibly due to the low spatial resolution, the method is not able to clearly discriminate between grey and white-matter.Conclusion
A novel method for mapping different brain and brain-tumour tissue types based on 2D-MRSI was presented. The method exempts clinicians from the task of translating spectral information into clinical more relevant tissue type information. The ability of the current method to detect tumour infiltration will be validated in further studies.Acknowledgements
This work was funded by the EU Marie Curie FP7-PEOPLE-2012-ITN project TRANSACT (PITN-GA-2012-316679) and the Swiss National Science Foundation (project number 140958).References
1. Porz N, Bauer S, Pica A, et al. Multi-modal glioblastoma segmentation: Man versus machine. PLoS One. 2014;9(5):e96873. doi:10.1371/journal.pone.0096873.
2. Meier R, Knecht U, Loosli T, et al. Clinical Evaluation of a Fully-automatic Segmentation Method for Longitudinal Brain Tumor Volumetry. Sci Rep. 2016;6(October 2015):23376. doi:10.1038/srep23376.
3. Pelleg D, Moore AW. X-means: Extending K-means with efficient estimation of the number of clusters. Proc Seventeenth Int Conf Mach Learn table contents. 2000:727–734. doi:10.1007/3-540-44491-2_3.
4. Pedrosa de Barros N, Mckinley R, Knecht U, Wiest R, Slotboom J. Automatic quality control in clinical 1 H MRSI of brain cancer. NMR Biomed. 2016;(August 2015). doi:10.1002/nbm.3470.
5. Pedrosa de Barros N, McKinley R, Knecht U, Wiest R, Slotboom J. Automatic quality assessment of short and long-TE brain tumour MRSI data using novel Spectral Features. Proc Intl Soc Mag Reson Med 24. 2016.
6. Ratiney H, Sdika M, Coenradie Y, Cavassila S, van Ormondt D, Graveron-Demilly D. Time-domain semi-parametric estimation based on a metabolite basis set. NMR Biomed. 2005;18(1):1-13. doi:10.1002/nbm.895.
7. Croteau D, Scarpace L, Hearshen D, et al. Correlation between magnetic resonance spectroscopy imaging and image-guided biopsies: Semiquantitative and qualitative histopathological analyses of patients with untreated glioma. Neurosurgery. 2001;49(4):823-829. doi:10.1227/01.NEU.0000027634.52243.46.
Figures