0883
Apparent short transverse relaxation time of inorganic phosphate in breast cancer tissue at 7 tesla.1Department of Radiology, UMC Utrecht, Utrecht, Netherlands
Synopsis
Here we show in a patient group with breast cancer an apparent shortening of the transverse relaxation time of the Pi signal at 7 tesla, as compared to healthy breast fibroglandular tissue and propose an underlying mechanism to explain this observation.
Introduction
Phosphorus magnetic resonance spectroscopy offers the possibility to measure phospholipid membrane metabolism and cell energy metabolism in vivo. It is well known that the levels of phosphomonoesters (PME), phosphocholine (PC) and phosphethanolamine (PE) are often higher in cancerous tissues than in healthy tissue. Here we show in a patient group with breast cancer an apparent shortening of the transverse relaxation time of the Pi signal, as compared to healthy breast fibroglandular tissue. Additionally, we propose an underlying mechanism to explain this observation.Methods
A group of 8 healthy volunteers and 24 patients with breast cancer comprising of 28 lesions (lesion size=< 2cm; 26 IDC, 2 ILC) were scanned at 7 Tesla with 31P MRSI using adiabatic multi-echo spectroscopic imaging, AMESING1, with TR=6s; TE=45ms; matrix 8x8x8 unilateral; acquiring 1 FID and 5 full echoes; BW=8200Hz and 256 datapoints for the echoes. Data were Hanning filtered, apodised (10Hz Lorentzian) and zerofilled to 2048 datapoints. The spectra (FID and echoes) of the different patients were referenced and aligned to the α-ATP of the FID spectrum and summed to patient group data leading to 1 summed FID spectrum and 5 summed echo spectra. The group data were spectrally fitted in JMRUI using the AMARES algorithm and T2-fits of the different 31P metabolites were made.Results and discussion
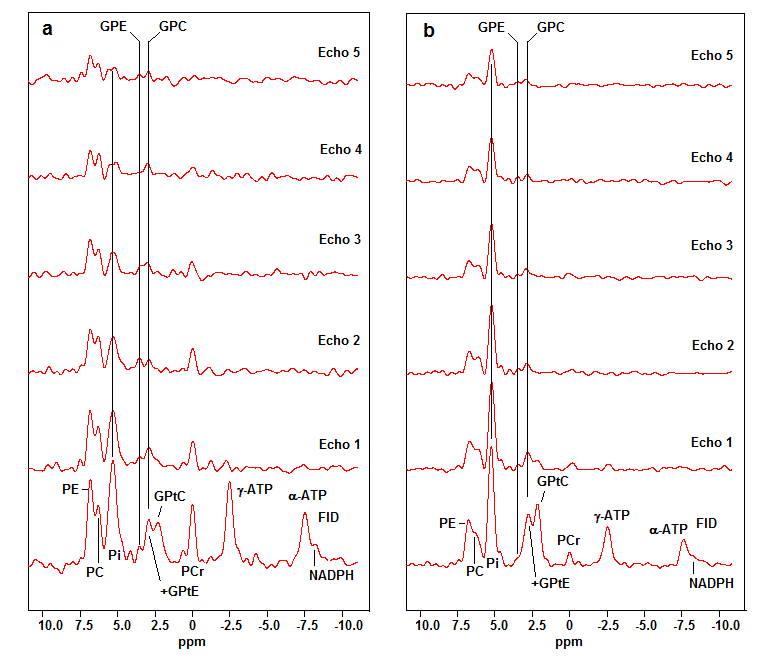
The FID spectra and the echo spectra of the patient group and the healthy volunteers, are shown in Figure 1a,b, respectively. There is a short T2-component in the phosphodiester metabolites, that we ascribe to mobile phospholipids in the form of glycerophosphatidylcholine (GPtC) and glycerophosphatidylethanolamine (GPtE). The aqueous phosphodiester signals glycerophosphoshcholine (GPC) and glycerophosphoethanolamine (GPE) remain also visible at longer echo times.
In the healthy spectra the Pi signal is by far the highest signal and this remains the case also in the echoes, while in the breast cancer spectra the signal intensity of Pi drops quickly below the PME signal intensities.
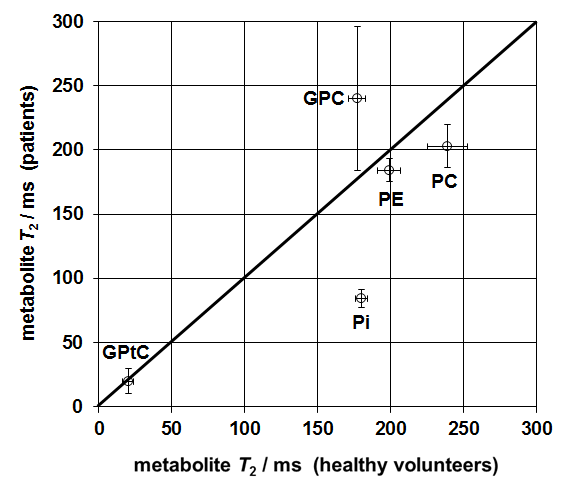
Figure 2 shows fitted T2 for various 31P metabolites. There is a large deviation in the (mono-exponentially fitted) T2 of Pi, which is over a factor 2 longer in healthy volunteers than in patients.
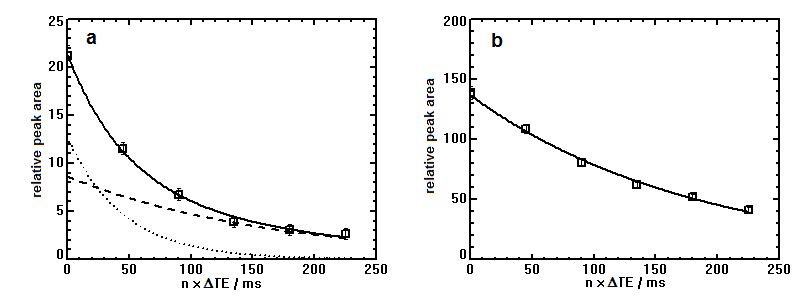
Fitting the T2 of Pi in breast cancer tissue with a bi-exponential model gives a short T2-component of 45ms and a long T2-component of 164ms, as shown in Figure 3a, where it is compared with the mono-exponentially fitted T2 of Pi for healthy fibroglandular tissue, Figure 3b.
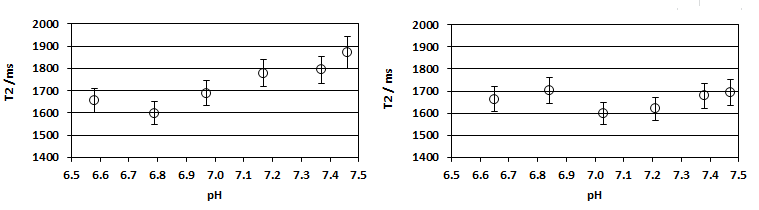
The interstitial space of cancerous tissue is often acidic, as compared to healthy tissue, and to test the influence of pH and protein on the T2 of Pi (in vitro), we performed a series of experiments and measured the T2 of Pi in the range 6.5<=pH<=7.5, in the absence and presence of protein (Figure 4). There is only a small shortening effect on the T2 of Pi (~15 %), when the pH drops from 7.45 to 6.8. Addition of protein dampens this effect.
A possible explanation for the large difference in T2-behaviour of Pi, in breast cancer tissue and healthy fibroglandular tissue, could be an influx of Pi from the interstitial space to provide Pi for the enhanced phospholipid and nucleotide synthesis of the cancer cells. The Pi-transport through the cell membrane (Na-Pi cotransport) is a restriction of the Pi-mobility, as compared to free Pi in solution, and this leads to a short T2-component in part of the Pi pool. Previously, we have reported on 31P metabolite T2-values in a small group of breast cancer patients receiving neo-adjuvant chemotherapy3. In that patient group we also observed a significantly shorter T2(<100ms) for Pi than in healthy volunteers. Moreover, the T2 of Pi in that group of patients did not normalize during the course of chemotherapy. We hypothesize that the cause for this may be that cellular phospholipid catabolism, caused by the chemotherapy, leads to an efflux of Pi from the cell to the interstitial space, which also gives rise to a short T2-component in observable Pi. A comparable effect can be seen with 31P MRS in exercising muscle, where the created Pi is transported from the cytosol to the mitochondria, which leads to an increased line-width for Pi (figure 2b from4).
Conclusions
The T2 of Pi in breast cancer tissue at 7 tesla is over a factor 2 smaller than that in healthy fibroglandular tissue. The effect cannot be explained by the influence of pH on Pi or interaction with protein. Possibly, the T2-shortening is caused by a flux of Pi from the interstitial space to the cancer cells to provide phosphate for increased membrane phospholipid and nucleotide synthesis.Acknowledgements
No acknowledgement found.References
1. W.J.M. van der Kemp, V.O. Boer, P.R. Luijten, B.L. Stehouwer, W.B. Veldhuis, D.W. Klomp, NMR Biomed. 2013; 26 :1299-1307.
2. W.J.M. van der Kemp, B.L. Stehouwer, V.O. Boer, P.R. Luijten, D.W.J. Klomp, J.P. Wijnen, Proc. ISMRM 2016 Singapore, #0894
3. W.J.M. van der Kemp, B.L. Stehouwer, P.R. Luijten, MAAJ van den Bosch, D.W.J. Klomp, Springerplus 2014; 3: 634.
4. Valkovic L, Chmelík M, Just Kukurová I, Jakubová M, Kipfelsberger MC, Krumpolec P, Tušek Jelenc M, Bogner W, Meyerspeer M, Ukropec J, Frollo I,Ukropcová B, Trattnig S, Krššák M. NMR Biomed. 2014; 27: 1346–1352
Figures