0882
1H-NMR of carnosine combined with 31P-NMRS to better characterize skeletal muscle pH dysregulation in Duchenne muscular dystrophy1NMR Laboratory, Institute of Myology, Paris, France, 2CEA, DRF, I²BM, MIRCen, Paris, France
Synopsis
The finding of an alkaline Pi pool has been established with 31P-NMRS in healthy resting skeletal muscle and the dystrophic muscle of GMRD dogs and DMD patients. The pH values corresponding to this Pi pool corresponds better with extracellular pH. Intracellular pH, however, can also be measured with 1H-NMRS, using carnosine. In a group of DMD patients, we observed that pH determined with 31P-NMRS were systematically increased, whereas this was not always the case for pH based on the measurement of carnosine, revealing two groups in dystrophic muscle: (1) pH elevated with 31P and 1H and (2) pH only elevated with 31P.
Purpose
Methods
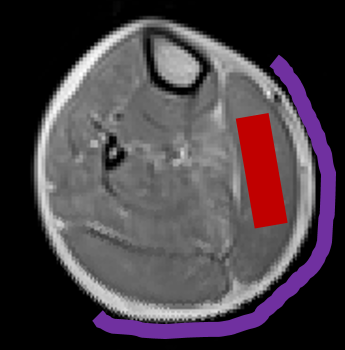
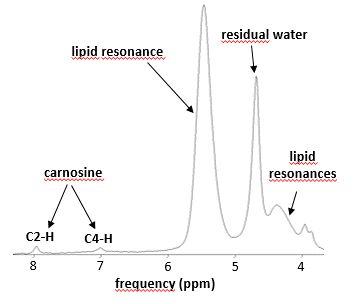
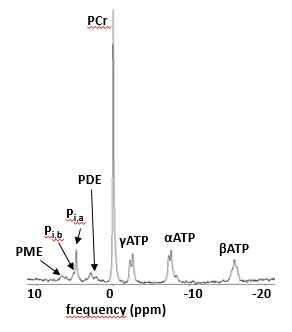
Data was acquired in 18 DMD patients (all male, 10 ± 2 yrs), as well as in 7 healthy controls (4 male, 31 ± 4 yrs) on a 3T Siemens Prisma system using a body matrix coil for quantitative NMRI, a dual-tuned 31P-1H surface coil for 31P-NMRS or a 15-channel volume knee coil for 1H-NMRS. 1H-NMRS data was obtained using a PRESS sequence with a TR of 3000 ms and a TE of 30 ms. Voxels were positioned in the gastrocnemius medialis muscle and voxel size depended on muscle size. Two 1H-NMR spectra were acquired: one water-suppressed (central frequency at 8.0 ppm, 64 averages) and one unsuppressed water spectrum (central frequency at 4.7 ppm, 16 averages). 31P-NMRS data was obtained from a non-localized excitation (TR = 4000 ms, 64 averages) with the coil wrapped around the calf (Fig. 1). NMRS data was processed with the AMARES [5] algorithm from jMRUI using optimized prior knowledge (Fig. 2,3). Additionally, an MSME sequence with 17 echoes was acquired which was processed using in-house python code, extracting water T2 and fat fraction values based on the tri-exponential model of Azzabou et al. [6]. Kruskal-Wallis tests for comparisons of groups and Spearman correlation analysis was performed (with P = 0.05 as significance level).Results
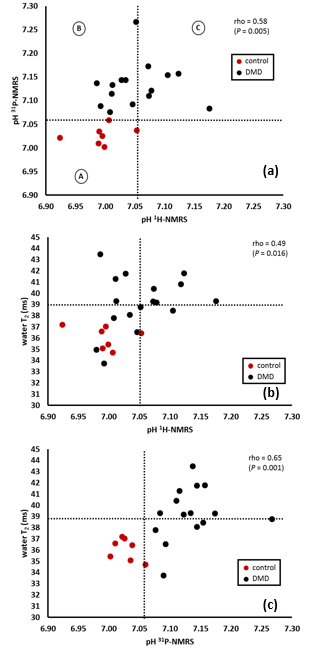
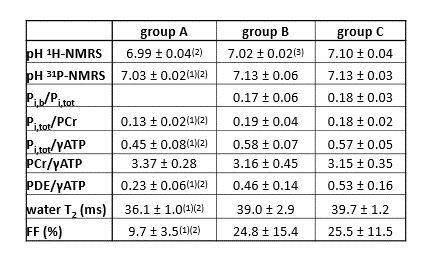
Fig. 4a shows that pH values derived from 31P-NMRS were systematically increased in DMD patients. While there is good agreement between 1H and 31P pH determination in normal subjects (group A), discrepancies can be observed in DMD patients. Whereas all have alkaline pH when determined by 31P-NMRS, there are DMD subjects with normal intracellular pH as calculated from the carnosine resonance (group B), the others have an increased (intracellular) pH measured by the two methods (group C), as illustrated in Fig. 4a. Interestingly, the carnosine intracellular pH was never found alkaline in absence of concurrent Pi pH elevation. The same observation can be made for the relation between 1H derived pH and water T2. Abnormal intracellular pH is hardly ever associated with normal water T2 values (Fig. 4b). Elevated 31P-derived pH values are observed in both the presence and absence of elevated water T2 (Fig. 4c). Data of the three groups are summarized in Table 1.Discussion
While pH alterations in the dystrophic muscle had been described long ago, the mechanism for the prominence of an alkaline Pi resonance in dystrophic muscle was still being debated. It may reflect cell pH dysregulation in leaky damaged myocytes or an increased volume fraction of the interstitium, impossible to distinguish using 31P-NMRS. Magnetization transfer experiments have indicated that, at least partly, the alkaline Pi pool was in exchange with ATP, and consequently originating from cells. The combined 1H and 31P approach used here identified that the two proposed mechanisms can exist. In muscles where 1H and 31P pH estimates are in agreement, the lesional mechanisms predominate. When 1H and 31P measures are discordant, it indicates that the alkaline Pi pool is extracellular, with an increased interstitial volume fraction being possibly related to fibrotic changes. Consequently, it will be worth investigating whether carnosine-based intracellular pH may provide an early indicator of dystrophic myocytes to therapy, as opposed to the 31P-NMRS-based pH, whose origin cannot be ascertained and may reflect predominantly the extent of chronic degenerative changes in dystrophic muscles.Conclusion
Contrary to 31P-NMRS, carnosine 1H-NMRS can be used as a biomarker to assess specifically the intramyocytic pH changes in Duchenne patients.Acknowledgements
No acknowledgement found.References
[1] Kan HE., Klomp DWJ, Wong CS, et al. In vivo 31P MRS detection of an alkaline inorganic phosphate pool with short T1 in human resting skeletal muscle. NMR Biomed. 2010;23(8): 995–1000.
[2] Wary C, Naulet T, Thibaud JL, et al. Splitting of Pi and other 31P NMR anomalies of skeletal muscle metabolites in canine muscular dystrophy. NMR Biomed. 2012;25(10):1160–1169.
[3] Wary C, Azzabou N, Giraudeau C, et al. Quantitative NMRI and NMRS identify augmented disease progression after loss of ambulation in forearms of boys with Duchenne muscular dystrophy. NMR Biomed. 2015;28(9):1150–1162.
[4] Pan JW, Hamm JR, Rothman DL, et al. Intracellular pH in human skeletal muscle by 1H NMR. Proc. Natl. Acad. Sci. USA. 1988;85(21):7836–7839.
[5] Vanhamme L, van den Boogaart A, Van Huffel S. Improved method for accurate and efficient quantification of MRS data with use of prior knowledge. J. Magn. Reson. 1997;129(1):35–43.
[6] Azzabou N, de Sousa PL, Caldas E, et al. Validation of a generic approach to muscle water T2 determination at 3T in fat-infiltrated skeletal muscle. J. Magn. Reson. Imaging. 2015;41(3):645–653.
Figures