0880
Patch-based super-resolution of MRSI data in multiple sclerosis patients at 7 T1icometrix, R&D, Leuven, Belgium, 2High Field MR Centre, Medical University of Vienna, Vienna, Austria, 3Department of Electrical Engineering-ESAT, STADIUS Center for Dynamical Systems, Signal Processing and Data Analytics, KU Leuven, Leuven, Belgium, 4Christian Doppler Laboratory for Clinical Molecular MR Imaging, Vienna, Austria, 5Medical IT, iMinds, Leuven, Belgium, 6Department of Electrical Engineering-ESAT, PSI Medical Image Computing, KU Leuven, Leuven, Belgium, 7BioImaging Lab, Universiteit Antwerpen, Antwerp, Belgium
Synopsis
The clinical application of brain MRSI is, upon several factors, limited by the comparatively low resolution that makes it difficult to resolve lesions. This work demonstrates the application of a patch-based super-resolution (PBSR) method that increases the spatial resolution of metabolite maps obtained from MRSI. The method is validated against conventional interpolation techniques in multiple sclerosis patient measurements. Our results clearly show the benefits of PBSR over other common interpolation techniques.
Purpose
Magnetic resonance spectroscopic imaging (MRSI) of the brain provides insight into the distribution of metabolites, but is subject to comparatively low resolutions that limit the method’s usefulness. Approaches with higher resolution1,2 were successfully introduced, but are in turn limited by increased measurement times. Another possibility is the application of super-resolution techniques to low resolution datasets to increase the information about metabolite distribution at high resolution. This work presents the validation of our patch-based super-resolution (PBSR) method on quantified N-acetyl-aspartate (NAA) and myoInositol (Ins) metabolite maps of multiple sclerosis (MS) patients at 7 T.Methods
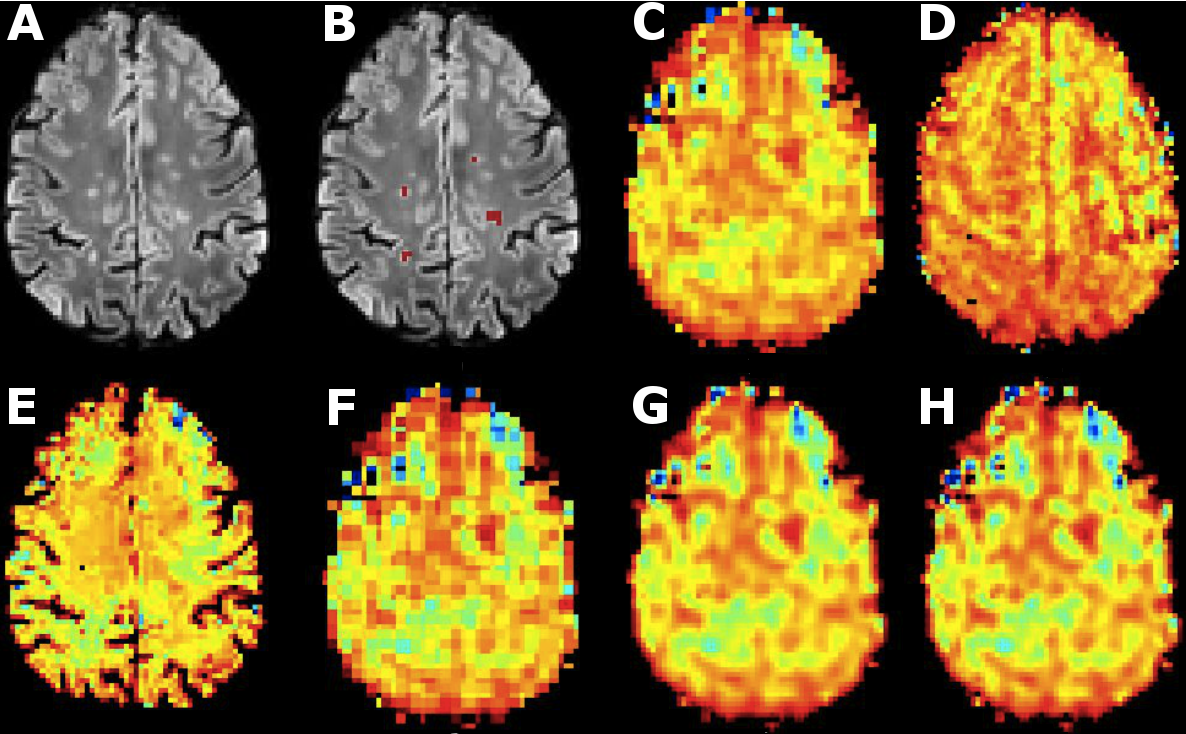
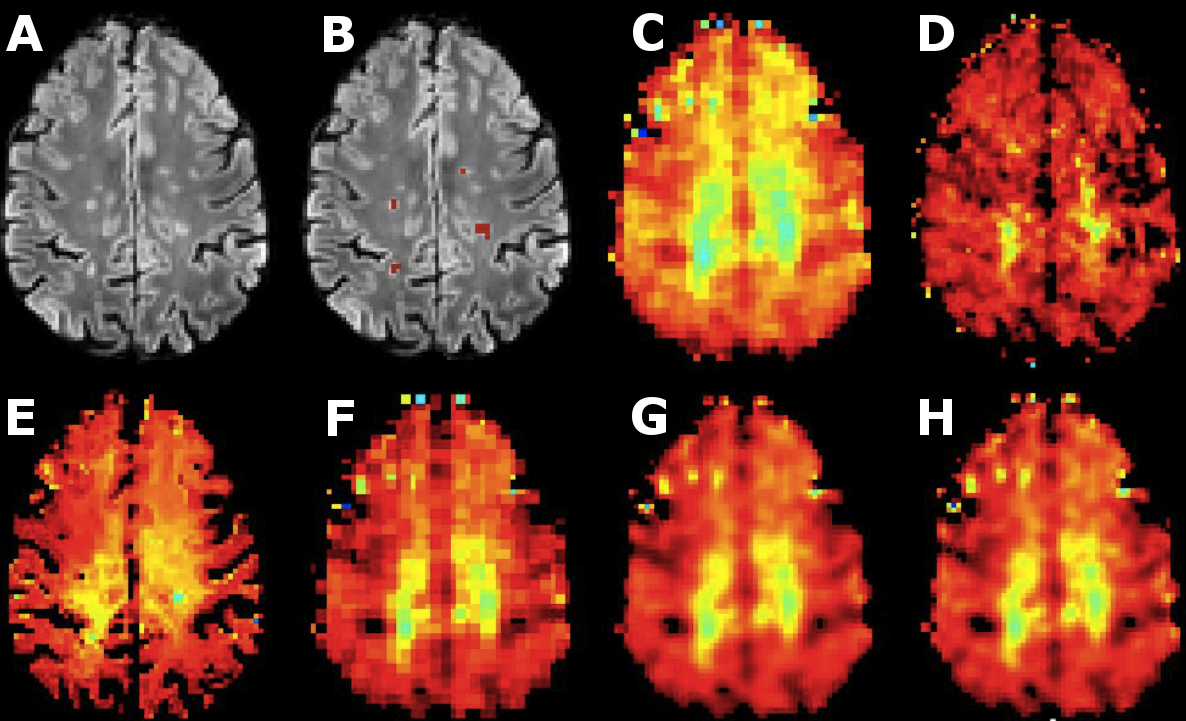
The PBSR method takes high resolution anatomical MR images (T1-weighted and FLAIR) and low resolution MRSI images as input. The pipeline has three steps: (1) a preprocessing step, including (a) segmentation of MR images into grey matter, white matter (WM), cerebrospinal fluid and lesions3, (b) metabolite quantification of the acquired low resolution (LR) and high resolution (HR) MRSI data using the LCModel software, (2) a reconstruction step, aiming to find similar voxels (based on tissue segmentations and image intensities) in the neighbourhood of each central voxel, and (3) a mean correction step, imposing that the average of the L reconstructed values composing the low resolution voxel must be close to the corresponding original value of the low resolution image4. We validated the accuracy of our method on human datasets acquired in-vivo against three conventional interpolation techniques: nearest neighbours (NN), linear interpolation (LIN) and B-splines (BS). These datasets consisted of five MS patients (4 f, 1 m, age 32-46) that were measured with a Siemens 7 T Magnetom scanner and a 32-channel head coil (Nova Medical). Written informed consent and approval of the institutional review board were obtained. Using a CAIPRINHA-accelerated phase-encoded FID-MRSI sequence1,5, a low resolution (TR = 600 ms, TE = 1.3 ms, 45° FA, 64×64 matrix, 3.4× 3.4× 8.0 mm³ voxel size, 6×acceleration, 5 min) and a high resolution (TR = 200 ms, TE = 1.3 ms, 29° FA, 100×100 matrix, 2.2× 2.2×8.0 mm³ voxel size, 4×acceleration, 6 min) single slice protocol were acquired, in addition to MPRAGE and FLAIR scans and a pre-saturation turbo-FLASH-based B1+ map. Data processing utilised a MATLAB-based in-house routine6 that included MUSICAL7 coil combination, a spatial Hamming filter and the removal of lipid contamination by L2-regularisation8. After spectral fitted in the range of 1.8 to 4.2 ppm using LCModel, NAA and Ins maps were created. All four interpolation techniques were applied and their results compared.Results
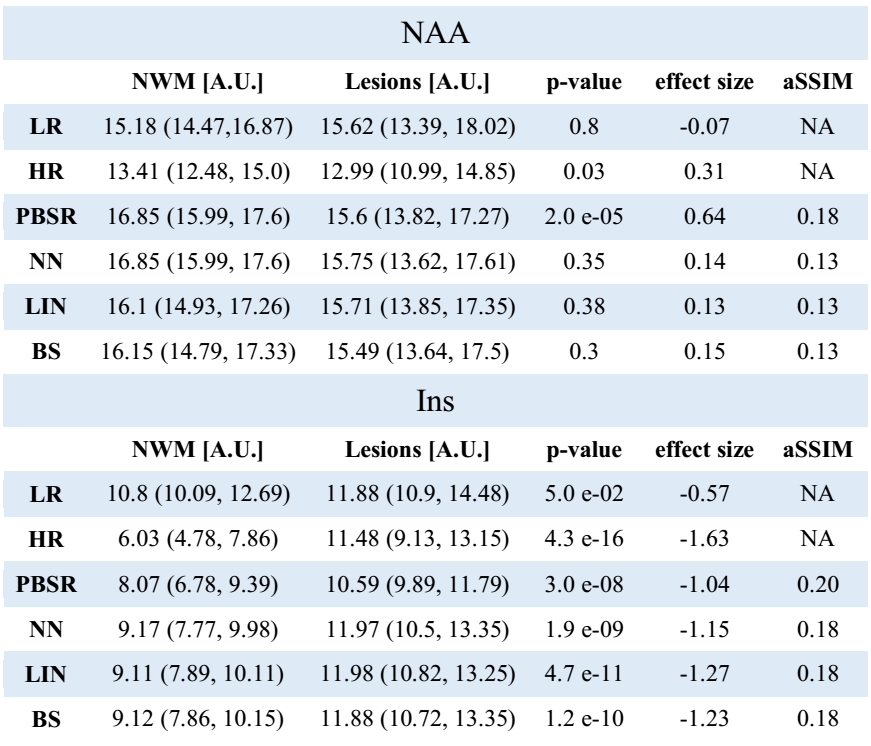
The acquired high resolution maps show the contrast between lesions and surrounding white matter which is not seen in the acquired LR maps. In the case of NAA (Fig.1), only PBSR achieves the same contrast, while for Ins (Fig. 2) the contrast is highest for LIN followed BS, NN and PBSR. In the resulting statistics (Fig. 3), PBSR has the highest averaged structural similarity index (aSSIM) and the best p-value and effect size for NAA for differentiating lesion voxels versus surrounding white matter, while for Ins this is the case for the acquired HR maps. In general, PBSR preserves tissue contrast and structural information best, matching well with the trend of the acquired HR MRSI.Discussion
The results obtained in human in vivo datasets show that PBSR is a feasible and superior method for the up-sampling of quantified metabolite maps from MRSI. MRI-based weights allow to achieve a better tissue contrast than the other methods. This approach has a high potential for clinical neuroimaging applications at 7 T, as more metabolic information can be obtained from measurements with low resolution that can be conducted in a shorter measurement time. For future development, using absolutely quantified metabolite maps for PBSR may allow to show the methods accuracy even better.Acknowledgements
This study was supported by TRANSACT (EU-FP7-PEOPLE-2012- ITN-316679); research support from the NIHR/WT Clinical Research Facility; the Austrian Science Fund (FWF): KLI-61; and the FFG Bridge Early Stage Grant #846505.References
[1] Hangel et al., ISMRM 24 (2016):0387
[2] Lam et al., MRM 2016;
76(4):1059-70
[3] Jain et al.,
NeuroImage Clinical 2015; 8: 367 – 375
[4] Jain et al., ISBI
2016; in press
[5] Strasser
et al., MRM 2016, early view
[6]
Považan et al., ISMRM 23 (2015):1973
[7] Strasser et
al.; NMR in Biomed 2013; 26(12): 1796-805
[8] Bilgic et al., JMRI
2014; 40(1):181-191
Figures