0878
Initial results of combined 1H and 31P spectroscopic imaging of the prostate at 7 TeslaBart WJ Philips1, Mark van Uden1, and Tom WJ Scheenen1
1Radiology and Nuclear Medicine, Radboud University Medical Centre Nijmegen, Nijmegen, Netherlands
Synopsis
Proton MR spectroscopy has proven to be a valuable tool in the evaluation and detection of prostate cancer by assessing metabolite ratios incorporating choline and citrate signals. The choline peak in the proton spectrum actually consists of several different peaks of choline containing compounds[2], of which some can be distinguished using 7 Tesla 31P spectroscopic imaging. In this work we present our first patient results of a method that combines 31P and 1H within one measurement using a 31P Tx/Rx and 1H Rx endorectal coil and we show its feasibility for correlating 31P and 1H metabolite ratios.
Introduction
Proton MR spectroscopy has proven to be a valuable tool in the evaluation and detection of prostate cancer by assessing metabolite ratios incorporating choline and citrate signals. The intensity of the choline peak has been shown to increase in prostate cancer lesions, whereas the citrate peak decreases [1]. The choline peak in the proton spectrum actually consists of several different peaks of choline containing compounds[2], of which some can be distinguished using 7 Tesla 31P spectroscopic imaging [3,4]. By performing 31P and 1H MRSI within one measurement, the total choline 1H resonance can be correlated to the 31P peaks of the different choline containing compounds. This provides additional information about prostate cancer biology and may give an additional parameter in assessing prostate cancer aggressiveness. In this abstract we present a method for combining 31P and 1H MRSI and show our first in vivo results.Methods
Measurements were performed on a 7T whole-body MR system (MAGNETOM, Siemens Healthineers, Erlangen, Germany). An 8 channel multi-transmit body array coil was used in combination with an endorectal coil that featured a separate receive channel for 1H and a Tx/Rx channel for 31P (Figure 1). After local B0 and B1 shimming [5], a multiparametric MRI protocol (transversal T2W and diffusion weighted imaging) [6] was performed in combination with proton and phosphorus MRSI. Proton MRSI was performed using a PRESS-like sequence with RF pulses that are both spectrally and spatially selective (Figure 2) [7], such that a VOI is excited of only the spectral region of interest (2.3-3.3 ppm) (TR=1000ms, TE= 135 ms, 1 average, FOV=84x70x70mm3, 12x10x10 matrix, 50% Hamming filter, true voxel size=0.94cc and acquisition time=7:01 min). 31P MRSI was performed using a 3D phase-encoded pulse-acquire sequence with a non-selective BIR-4 excitation pulse (flip angle= 45⁰, TR=1500ms, FOV=120x100x100 mm3, 12x10x10 matrix, 100% Hamming filter, 4 weighted averages, true voxel size=4.2cc, acquisition time 13:09 min). 4 patients with histopathologically proven prostate cancer (Gleason 4+4, 3+4, 3+4 and one unknown Gleason score) were measured using this setup. The data for the phosphorus MRSI was fit using Metabolite Report (Siemens Healthineers Erlangen, Germany). 1H spectra were qualitatively assessed.Results
All prostate cancer lesions were clearly identified on T2W and ADC imaging and in 3 out of 4 patients (patient 2, 3 and 4) a well distinguishable choline peak was present in the 1H spectra of the tumor (Figures 3 and 4). Lipids in some cases contaminated the 1H citrate signal, but did not influence the choline signal. Spermine signals had high intensities, due to refocusing the J-coupling with the spectrally selective pulses [7]. The 31P-MRSI measurement showed phosphocreatine (PCr) (low intensity within prostate, large signals from surrounding muscles) and the well-separated phosphomonoesters phosphoethanolamine (PE) and phosphocholine (PC) in all patients,. The phosphodiesters glycerophosphocholine (GPC) and glycerophosphoethanolamine (GPE) were occasionally detectable and if both present, they were also well-separated. In patient 4 the 31P metabolite maps had strong asymmetry: the GPC+GPE and PC+PE metabolite maps showed a high intensity specifically within the prostate cancer lesion, whereas the smooth muscle PCr signals outside the prostate appeared highest on the contralateral side. Assuming a symmetric muscle PCr muscle signal, this indicates distinctly increased levels of GPC+GPE and PC+PE within the cancer lesion (Figure 4). In this lesion a highly elevated 1H choline signal was also present, whereas it was completely absent in the contralateral prostate side.Discussion
The described method can be used to obtain 31P as well as 1H spectroscopic data of the prostate within one measurement and can correlate 31P choline compounds to the 1H choline signal. The use of an endorectal coil hinders absolute quantification, hence we need to rely on relative signal intensities, ratios, or asymmetries. Metabolite ratios such as choline/spermine can be used to this extent for 1H MRSI. 31P Ratios of PE, PC, GPE and GPC can provide information about metabolic pathways and are therefore suitable candidates for 31P MRSI. yATP and PCr may also to some extend serve as reference values. A high choline/spermine ratio can then be linked to 31P metabolite ratios. Due to the small patient group at the moment, no clinical conclusions can be drawn from the data yet, but preliminary anecdotal results indicate that the increase in 1H choline in some high Gleason score prostate cancer lesions might partly be caused by a specific increase in GPC+GPE, which agrees with the results that were found by Lagemaat et al [3].Conclusion
31P and 1H spectroscopy can be performed within one measurement and enables an in vivo correlation between 1H and 31P metabolite ratios.Acknowledgements
Dutch Cancer Society [2014-6624]References
[1] Heerschap et al; Anticancer Res 1997; [2] Awwad HM; Clin Biochem. 2012;45(18):1548-53 [3] Lagemaat et al. Invest. Radiol. 2014; 49(5):363-72; [4] Kobus T; MRM, 2012; [5] Metzger GJ et al, MRM. 2008; Feb;59(2):396-409; [6] Maas et al MRM 71:1711-1719 (2014; [7] Lagemaat et al. Magn Reson Med. 2015; 10.1002/mrm.25569Figures
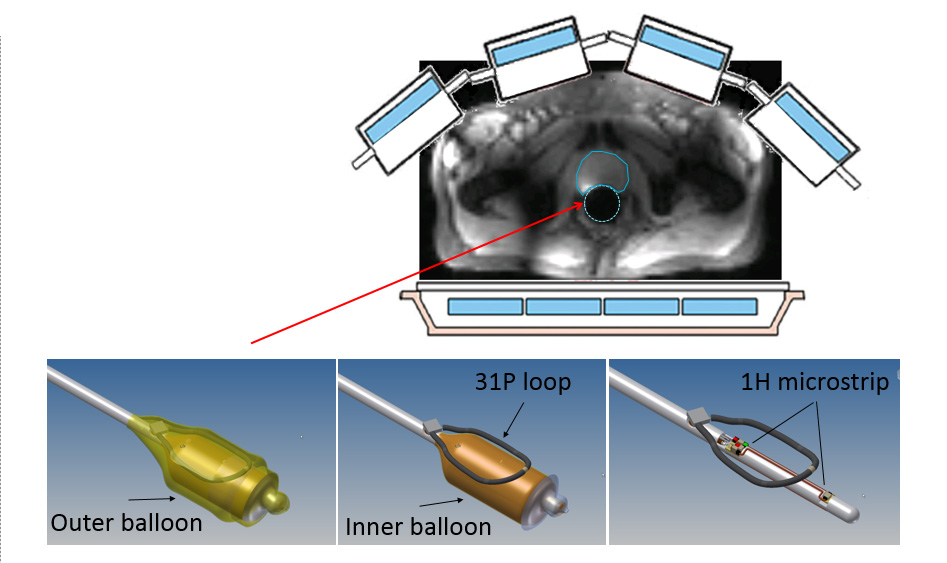
Experimental setup: 8 channel 1H
transmit body array in combination with an endorectal 31P
transmit/receive and 1H receive channel for high local receive
sensitivity. The coil consists of a 31P loop contained between the
inner and outer balloon and a 1H receive strip located within the
inner balloon.
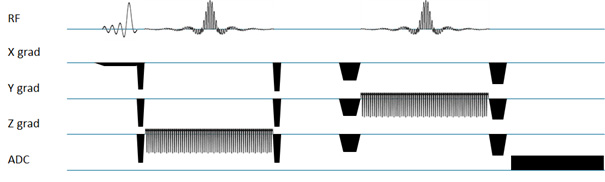
Spectral-spatial
PRESS-like MRSI sequence [7]. An asymmetric slab selective 90° excitation pulse
is followed by two spectrally and spatially (SPSP) selective RF pulses. The SPSP pulses select a
VOI while also selecting the spectral region containing citrate, creatine,
polyamines and choline but excluding lipids and water.
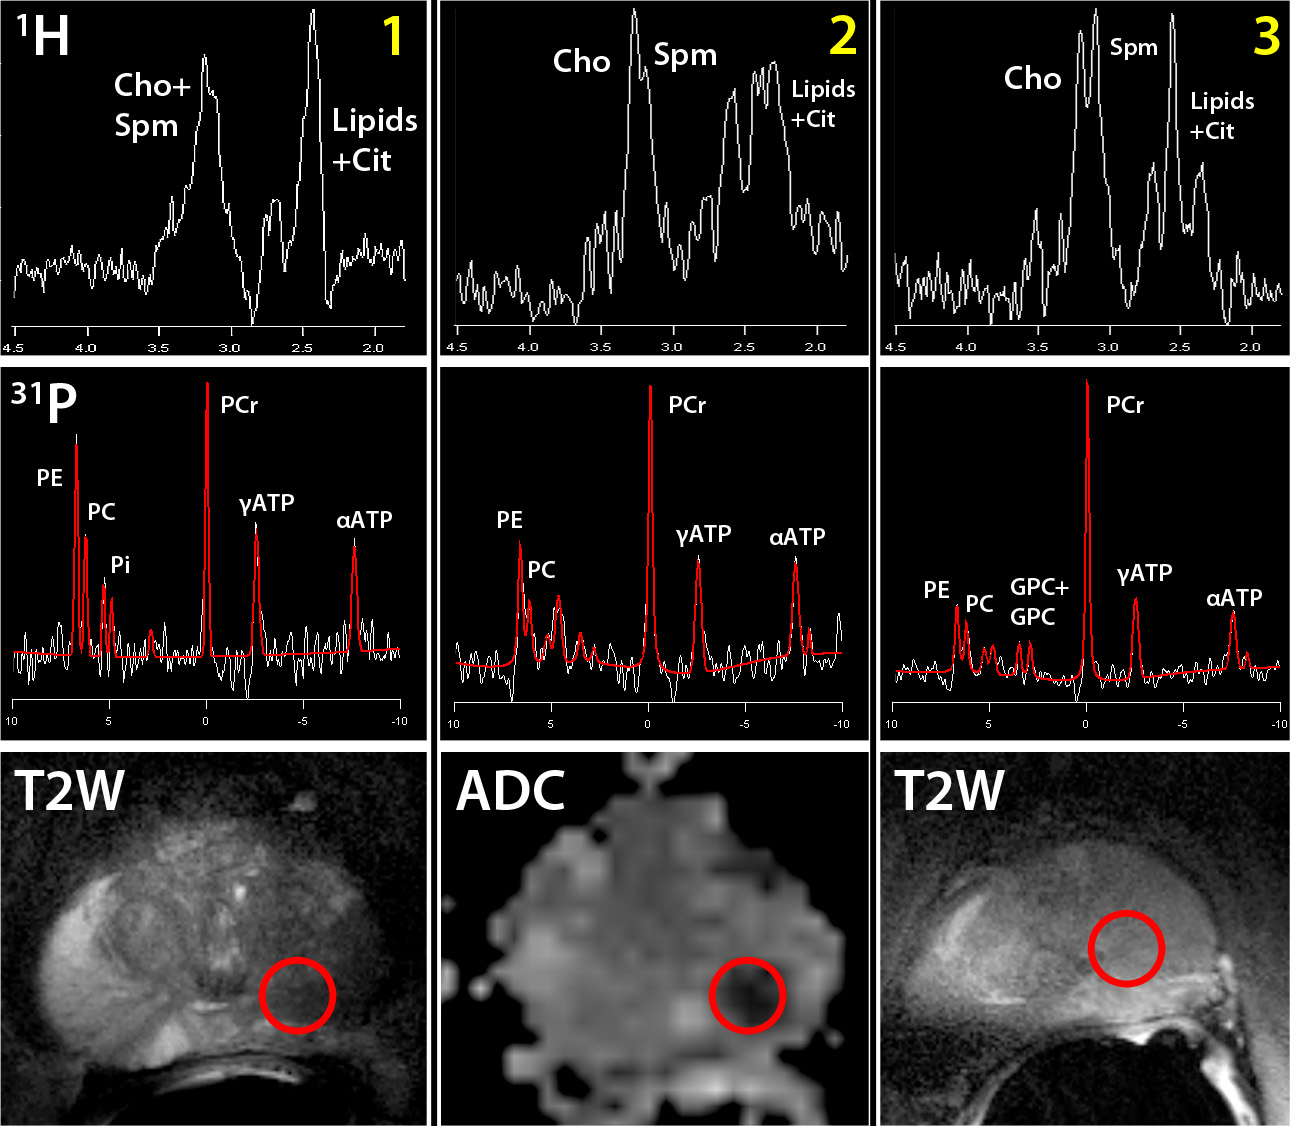
31P and 1H spectra of patient 1-3
located in cancer tissue. The red circle indicates the location of the 31P
and 1H spectra on the T2W (volunteer 1 and 3) or ADC (volunteer 2) images.
All voxels were located in the primary prostate cancer lesion of the patient.
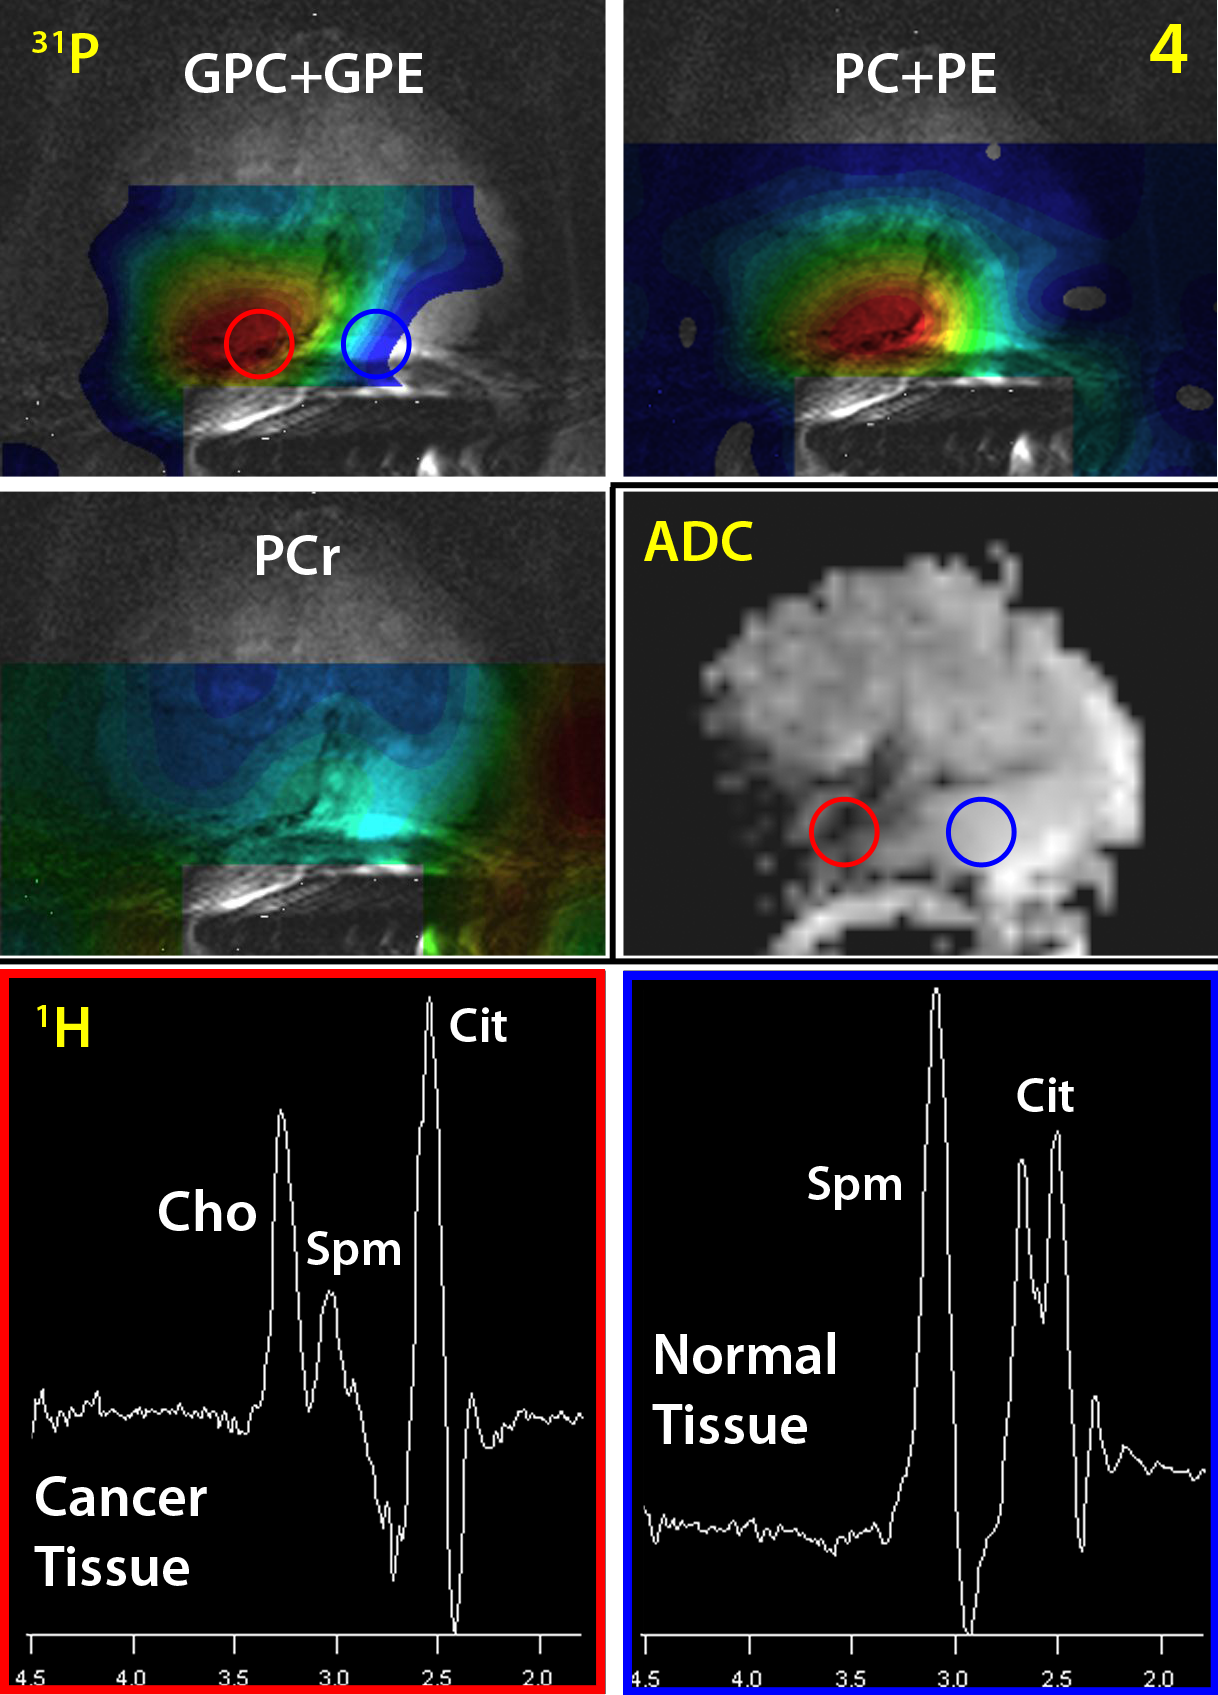
31P
MRSI metabolite maps of GPC+GPE, PC+PE and PCr of patient 4 (Gleason 4+4). The
red and blue circle on the GPC+GPE and ADC map indicate the location of the 1H
spectra located in cancer tissue (red) and healthy tissue (blue).