0877
Resolution Enhanced accelerated Four Dimensional Echo Planar Spectroscopic Imaging: Application in Prostate Cancer1Radiological Sciences, University of California - Los Angeles, Los Angeles, CA, United States, 2Urology, University of California - Los Angeles, Los Angeles, CA, United States
Synopsis
Prostate cancer (PCa) remains the most prevalent form of cancer in men. For diagnosis, Prostate-Specific Antigen (PSA) levels are most commonly used as a screening tool. Chemical shift imaging (CSI) methods can provide information on the biochemical concentrations of metabolites in different regions of the prostate. Here, we demonstrate a novel technique capable of improving the spatial and spectral resolution of the accelerated echo-planar J-resolved spectroscopic imaging (EP-JRESI) method, which obtains 2 spatial and 2 spectral dimensions in a single scan. This resolution enhanced EP-JRESI (RE-JRESI) method is evaluated in PCa patients and compared to the EP-JRESI results.
Introduction
Prostate cancer (PCa) is the second leading cause of cancer related deaths among men in the United States1. Chemical shift imaging (CSI)2 can be used to aid in the diagnosis of PCa when used in conjunction with the Prostate-Specific Antigen (PSA) test. One technique capable of improving spectral dispersion while retaining spatial resolution when compared to the CSI method is the accelerated echo planar J-resolved spectroscopic imaging (EP-JRESI) technique3,4. However, spatial resolution and spectral resolution along the indirect dimensions remain low. Using cubic convolution interpolation in the spatial domain5 and a covariance transformation in the spectral domain, we present a novel resolution enhanced EP-JRESI (RE-JRESI) technique and show applications of this method in PCa.Methods
Acquisition and Reconstruction: Data were acquired as previously discussed4 on a Siemens 3T Trio scanner (Siemens Healthcare, Erlangen, Germany). Data were acquired as $$$(k_x,k_y,t_2,t_1)$$$, where $$$k_x,k_y$$$ are the spatial dimensions and $$$t_2,t_1$$$ are the direct and indirect temporal dimensions, respectively. The following acquisition parameters were used for the phantom and in vivo acquisitions: $$$(k_x,k_y,t_2,t_1)$$$ points = (16,16,512,64), voxel resolution = 1x1x1cm$$$^3$$$, TE/TR= 30/1500ms, direct spectral bandwidth = 1190Hz, and indirect spectral bandwidth = 1000Hz. After phase rotation, the indirect spectral bandwidth was $$$\pm$$$250Hz6. All fifteen in vivo subjects with PCa (mean age = 60 years old) were consented as per the IRB protocol, and were scanned using the endo-rectal coil in addition to the body coil. For prostate phantom measurements, which included citrate (Cit), creatine (Cr), phosphocholine (PCh), spermine (Spm), myo-Inositol (mI), glutamate+glutamine (Glx), only the body coil was used.
A non-uniform sampling scheme was applied to the $$$k_y,t_1$$$ volume3 in order to accelerate the scan by a factor of four (4x). Data were subsequently reconstructed by maximizing the entropy of the data, as previously described in detail7.
Resolution Enhancement: After performing the acquisition and reconstruction steps above, the data were transformed into $$$(x,y,F_2,t_1)$$$, where $$$x,y$$$ are the spatial dimensions and $$$F_2$$$ represents the direct spectral dimension. First, cubic convolution interpolation5 was applied to each $$$F_2,t_1$$$ plane at each spatial point. Cubic interpolation utilizes 4x4 spatial points from the original image and interpolates a plane by evaluating the values and derivatives in all directions of these points. The whole image is interpolated by stringing these larger planes together, while keeping the derivatives at the boundaries of these planes equivalent. Spatial resolution was enhanced from 16x16 to 128x128 in this manner using the built in imresize command in MATLAB. Afterwards, the $$$F_2,t_1$$$ data in each voxel in the 128x128 grid underwent a covariance transformation8 to yield a covariance spectrum, $$$S$$$. If $$$A$$$ is a data set in $$$F_2,t_1$$$ for a single voxel, the covariance transformation is performed using the following: $$S = [Re(A) \cdot Re(A^T)]^{\frac{1}{2}} + [Im(A) \cdot Im(A^T)]^{\frac{1}{2}}$$
Above, $$$Re$$$ and $$$Im$$$ are the real and imaginary parts of $$$A$$$, respectively. After the covariance transformation, the indirect spectral bandwidth and resolution become identical to the direct spectral bandwidth and resolution, and therefore the indirect spectral resolution increases by a factor of 6.7. The combined spatial/spectral resolution enhanced method was applied in phantom and in vivo to evaluate the performance of this method.
Results
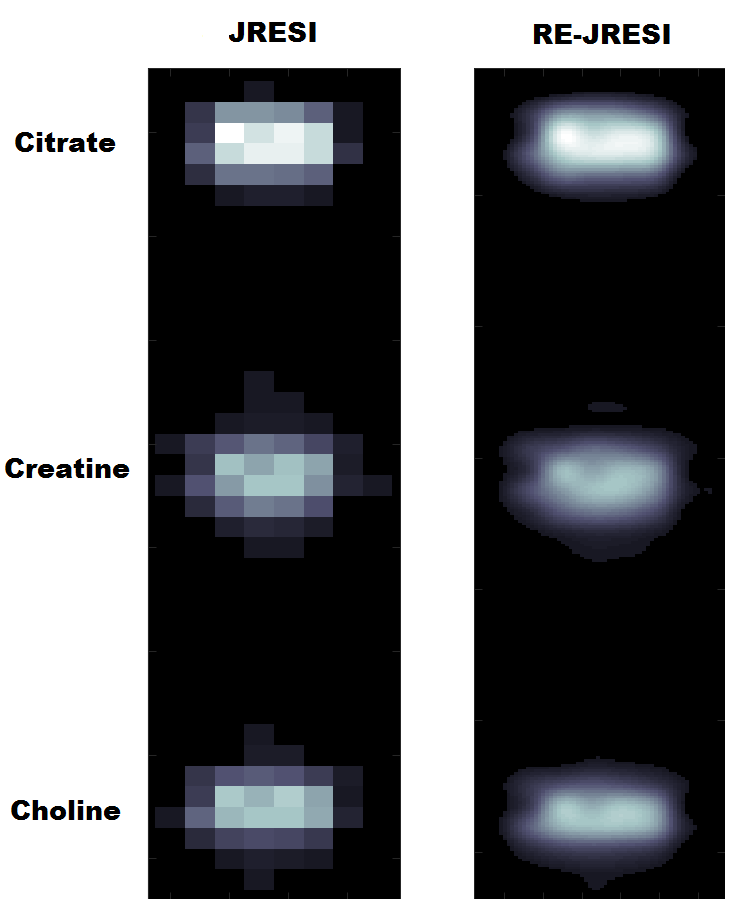
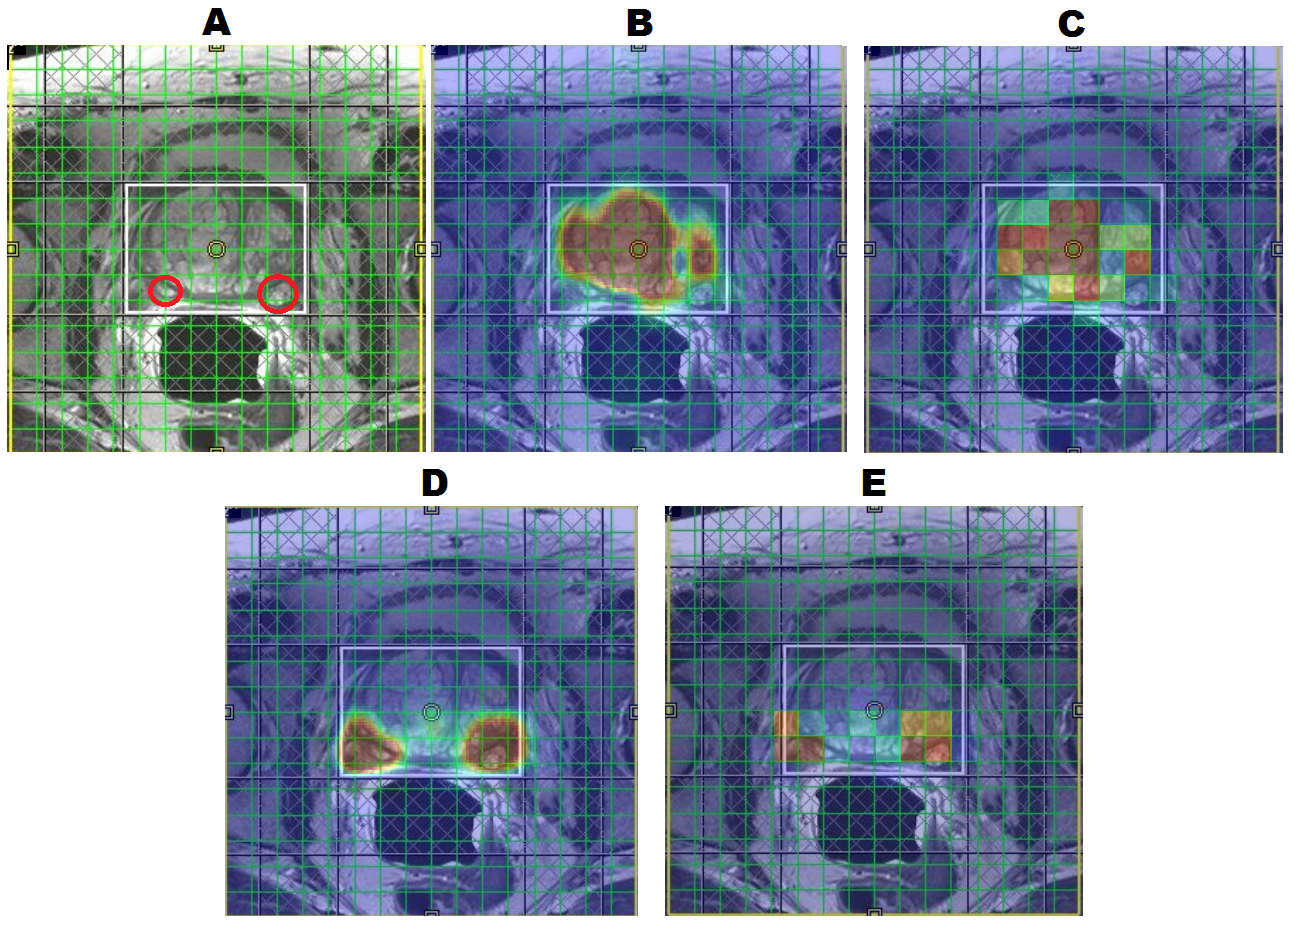
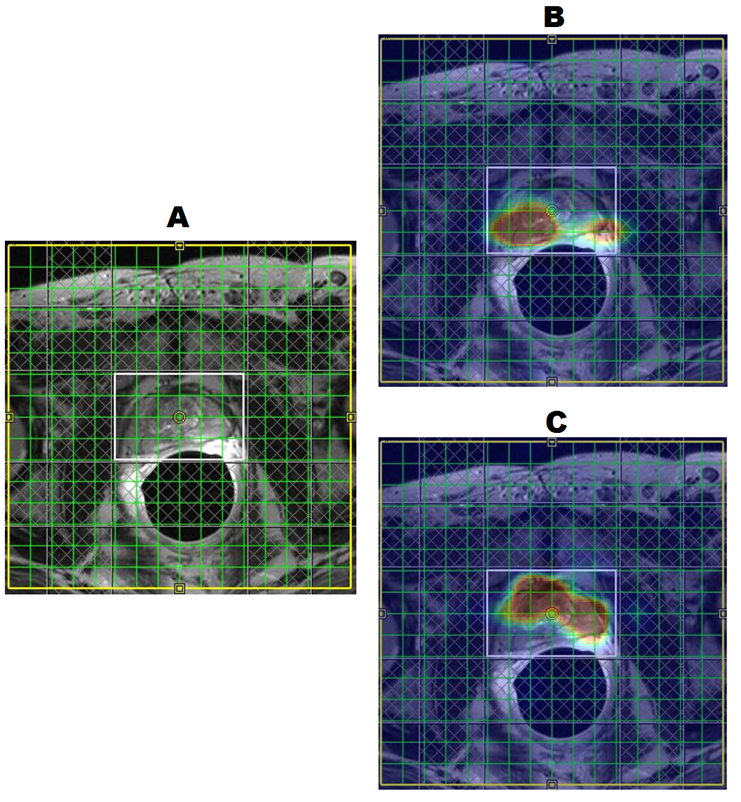
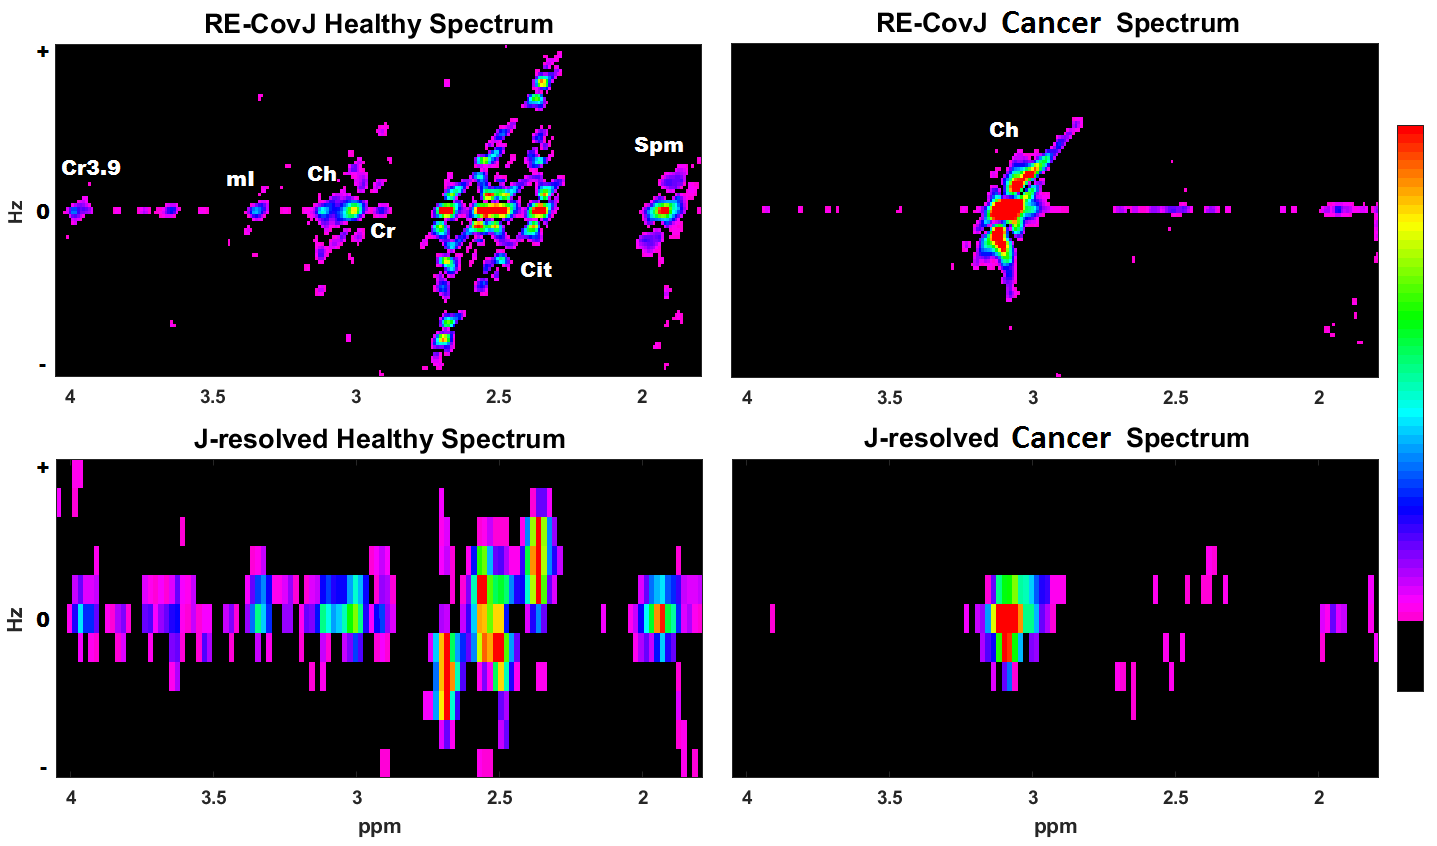
Figure 1 shows the spatial comparison of phantom scans of the regular EP-JRESI, or JRESI, and the RE-JRESI method for Cit, Cr, and choline metabolite maps, which are displayed by projecting peak volumes. Figures 2 and 3 show axial MRIs of the prostate, along with citrate metabolite maps, and choline metabolite maps. Locations with high choline and low citrate are indicative of cancerous tissues. The high choline areas seen in both figures agree with clinical biopsy results. Finally, Figure 4 shows the spectral comparison between the J-resolved spectrum and the resolution enhanced covariance J-resolved (RE-CovJ) spectrum for both healthy and cancerous tissues shown in Figure 2, with significantly improved spectral resolution in the RE-CovJ spectrum.Discussion and Conclusion
The RE-JRESI method is a novel technique capable of improving both spatial and spectral resolution of an EP-JRESI acquisition. The primary benefit of the spatial enhancement is that metabolite images can be directly overlaid onto MRIs, which may be especially useful in the clinic. Spectral resolution improvement may also allow for more accurate detection of metabolites, which will be investigated in the future. Future studies will focus on evaluating the quantitative benefit of using RE-JRESI compared to EP-JRESI and applying this method in five dimensions9.Acknowledgements
The authors would like to acknowledge the UCLA Dissertation Year Fellowship, and the NIH R21 (NS080649-02) grant.References
1. Siegel RL, Miller KD, Jemal A. Cancer statistics, 2015. CA: a cancer journal for clinicians 2015;65:5-29.
2. Brown T, Kincaid B, Ugurbil K. NMR chemical shift imaging in three dimensions. Proceedings of the National Academy of Sciences 1982;79:3523-3526.
3. Furuyama JK, Wilson NE, Burns BL, et. al. Application of compressed sensing to multidimensional spectroscopic imaging in human prostate. Magnetic Resonance in Medicine 2012;67:1499-1505.
4. Nagarajan R, Iqbal Z, Burns B, et. al. Accelerated echo planar J-resolved spectroscopic imaging in prostate cancer: a pilot validation of non-linear reconstruction using total variation and maximum entropy. NMR in Biomedicine 2015;28:1366-1373.
5. Keys R. Cubic convolution interpolation for digital image processing. IEEE transactions on acoustics, speech, and signal processing 1981;29:1153-1160.
6. Schulte RF, Lange T, Beck J, et. al. Improved two-dimensional J-resolved spectroscopy. NMR in Biomedicine 2006;19:264-270.
7. Burns B, Wilson NE, Furuyama JK, Thomas MA. Non-uniformly under-sampled multidimensional spectroscopic imaging in vivo: maximum entropy versus compressed sensing reconstruction. NMR in Biomedicine 2014;27:191-201.
8. Brüschweiler R, Zhang F. Covariance nuclear magnetic resonance spectroscopy. The Journal of chemical physics 2004;120:5253-5260.
9. Wilson NE, Iqbal Z, Burns BL, et. al. Accelerated Five-dimensional echo planar J-resolved spectroscopic imaging: Implementation and pilot validation in human brain. Magnetic Resonance in Medicine 2016;75:42-51.
Figures