0876
Comparison of in-vivo Lung Morphometry Models from 3D Multiple b-value 3He Diffusion-Weighted MRI1Academic Unit of Radiology, University of Sheffield, Sheffield, United Kingdom, 2Department of Bioengeering, Universidad Carlos III de Madrid, Madrid, Spain
Synopsis
The cylinder (CM) and stretched exponential (SEM) models have been proposed as a means of estimating lung alveolar microstructural length scales (Lm for CM and LmD for SEM) from multiple b-value hyperpolarised gas DW-MRI. This work compares Lm and LmD in healthy normals, idiopathic pulmonary fibrosis, and COPD patients. A correlation with a non-linear trend was observed between the Lm and LmD parameters. This suggests that the two models have different operational ranges of length scale estimation accuracy due to inherent differences in their geometrical and mathematical assumptions.
Purpose
Apparent diffusion coefficient (ADC) from diffusion-weighted (DW) MRI with hyperpolarised gas has proven to be sensitive to lung microstructural changes, 1 but ADC is not a direct estimate of airway dimension. Models of gas diffusion have been proposed to relate the gas diffusion signal to lung morphometry parameters. One theoretical model (the cylinder model (CM)) of lung geometry is based upon infinitely long non-connected cylinders, and has been used to obtain estimates of alveolar duct diameter from multiple b-value DW-MRI. 2,3 The stretched exponential model (SEM) is an alternative model that fits the diffusion signal without the need for geometrical assumptions of lung geometry by estimating alveolar dimensions within each voxel from a probability distribution of diffusion length scales. 4,5 This work evaluates and compares these two model parameters; CM mean linear intercept (Lm) and SEM mean diffusion length scale (LmD) using multiple b-value 3He DW-MRI in healthy, idiopathic pulmonary fibrosis (IPF) and chronic obstructive pulmonary disease (COPD) patients.Methods
46 subjects were scanned with either 2D or 3D multiple b-value 3He DW-MRI; 19 were healthy controls, 13 IPF patients, and 14 COPD patients. Each DW-MRI acquisition was acquired on a 1.5T GE HDx scanner with 300mL 3He (mixed with 700mL N2) inhaled from functional residual capacity using either 2D and 3D SPGR DW-MRI sequences described previously. 5,6 For each dataset, ADC was first calculated on a voxel-wise basis, followed by the fitting of all four DW interleaves to the CM 3 and SEM. 4 The CM metrics derived were outer (R) and inner (r) airway radii, and Lm. The fitting of the SEM derives an effective distributed diffusion coefficient from the rate of signal decay (DDC) and a heterogeneity index (α) that describes the amount of deviation from a mono-exponential decay. These parameters were subsequently used to derive LmD.Results and Discussion
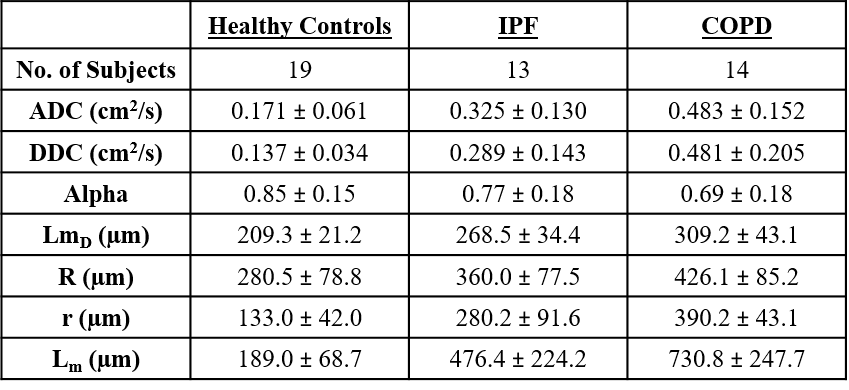
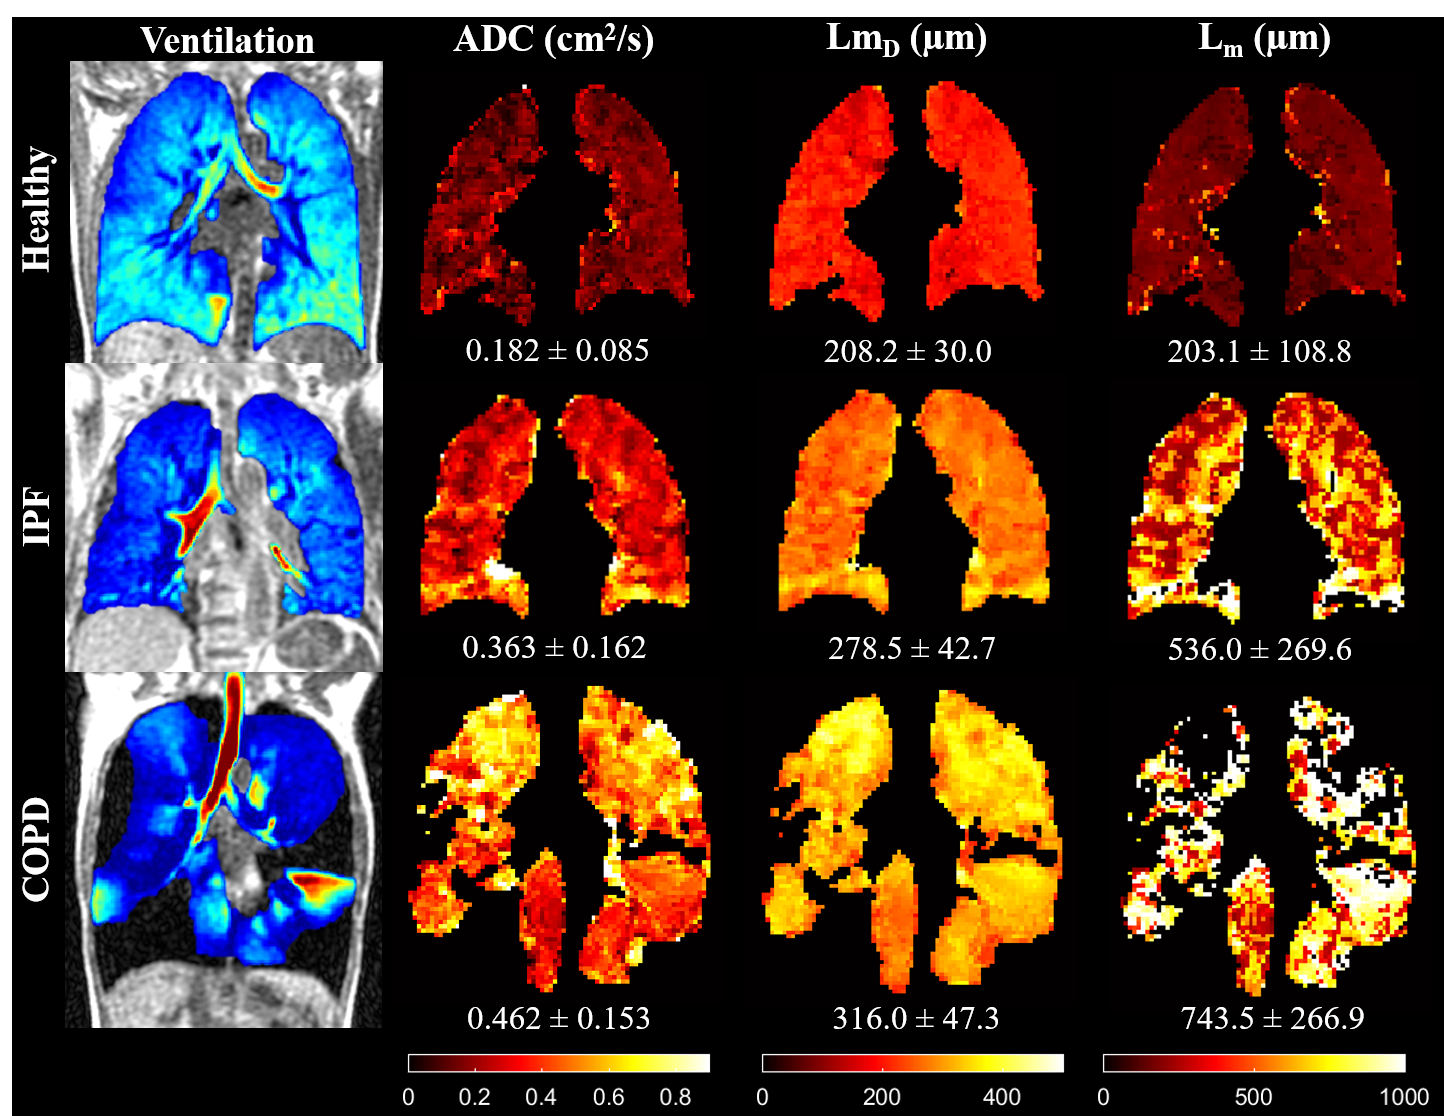
Table 1 gives a summary of mean diffusion-weighted metrics for each patient group. Each lung morphometry measurement showed a statistically significant (p<0.001) increase between healthy controls and patient groups, except α, which showed a statistically significant decrease (p<0.001). This increase (decrease for α) reflects the changes to acinar microstructure from disease in the form of fibrosis in IPF patients, and emphysema for COPD. Example lung morphometry maps in Figure 1 illustrate the differences in lung microstructure for each patient group.
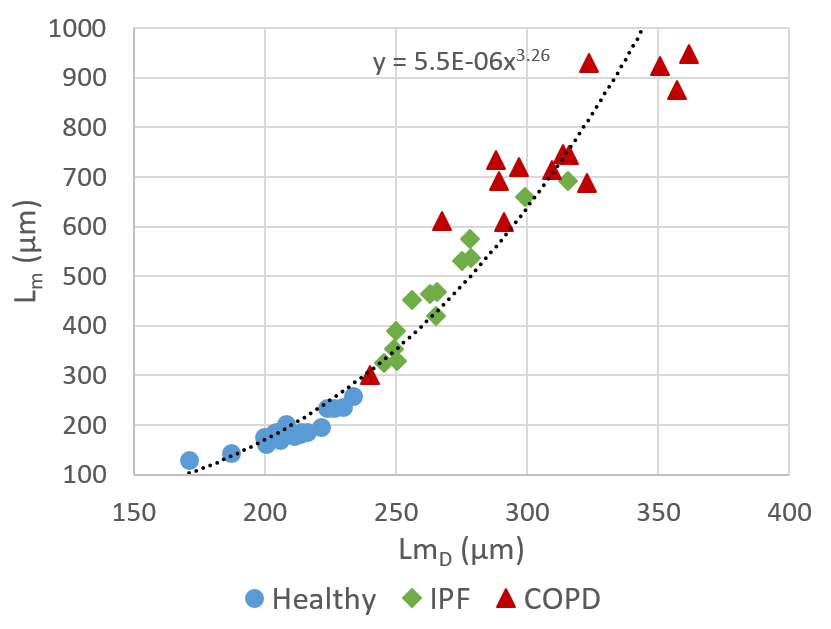
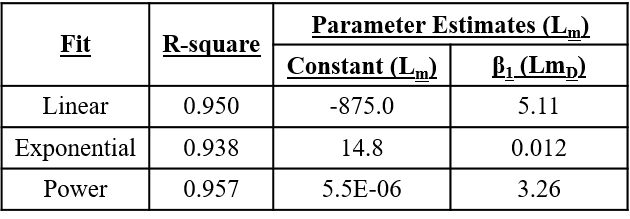
A statistically significant correlation (p<0.001) between LmD and Lm was observed. Three different curve regression fits (linear, exponential, and power) were performed, and all three fit models had similar R-square values (Table 2). The power model had the largest R-square (0.957) and is presented in Figure 2. The R-square value for a linear relationship was however very similar to the power relationship, therefore more in-vivo data from lungs with smaller alveoli (e.g. paediatrics) or HP gas phantom models with realistic acinar geometry are required to confirm this observation. To date, the only previous comparison between the CM and SEM models was made at 3T with 2D DW-MRI. 8 In that preliminary work, a second-order polynomial relationship was observed between LmD and Lm parameters. The substantially different relationship observed in that work was likely the result of the incorrectly calculated LmD parameter, which was not estimated from a probability distribution of diffusion length scales from the SEM.
The deviation from a linear relationship, observed in Figure 2, in diseased lungs is likely due to the limitations of the CM, which assumes anisotropic diffusion in a cylindrical geometry. However, the destruction of the alveolar wall with disease progression results in enlarged airspaces that are no longer alveolated cylinders leading to more isotropic diffusion. This is reflected in the COPD patient Lm map of Figure 1, where missing pixels are observed in areas where LmD values were calculated. These missing pixels indicate areas where alveolar duct dimensions were no longer within the physiological range previously stipulated for the CM. 7 In contrast, the SEM has no underlying geometrical assumptions and can fit the diffusion signal in voxels containing advanced emphysema or those corresponding to conducting airways that show free and/or localised diffusion behaviour.
Conclusion
This is the first comparison of in-vivo lung morphometry models at 1.5 T with 2D and 3D multiple b-value 3He DW-MRI. Lm and LmD parameters showed a non-linear correlation. This suggests that the two models have different operational ranges of length scale estimation accuracy due to inherent differences in their geometrical and mathematical assumptions.Acknowledgements
No acknowledgement found.References
1. Saam, B. T., et al. (2000). Magn Reson Med 44(2): 174-179.
2. Yablonskiy, D. A., et al. (2002). Proc Natl Acad Sci U S A 99(5): 3111-3116.
3. Yablonskiy, D. A., et al. (2009). J Appl Physiol (1985) 107(4): 1258-1265.
4. Parra-Robles, J., et al. (2014). Proc ISMRM:3529.
5. Chan, H-F., et al. (2016). Magn Reson Med. doi:10.1002/mrm.26279.
6. Parra-Robles, J., et al. (2012). Magn Reson Med 67(2): 322-325.
7. Sukstanskii, A. L. and D. A. Yablonskiy (2008). J Magn Reson 190(2): 200-210.
8. Ouriadov, A., et al. (2016). Proc ISMRM:0006.
Figures