0875
Acquisition at maximum blood velocity overcomes the problem of the ill-posedness of the IVIM model: a demonstration with renal diffusion MRI1Nephrology, CHUV, Lausanne, Switzerland, 2Radiology, CHUV, 3Nephrology, CHUV
Synopsis
We explain why diffusion MRI should always be acquired when blood has maximum velocity in the organ of interest. We first give some theoretical arguments to support this hypothesis. We then demonstrate it with numerical experiments and with in-vivo experiments.
Introduction
The IVIM model, proposed by Le Bihan in 1988, suggests that the trace-weighted images measured in a diffusion-MRI experiment follows a bi-exponential decay as a function of the b-values:
Itrace(b) = PF·e-b·Dpseudo + (1-PF)·e-b·Dpure (1)
A voxel-by-voxel fitting procedure yields three coefficients characterizing each voxel: the perfusion fraction (PF) which corresponds to the volume fraction (between 0 and 1) occupied by blood in the voxel, Dpseudo which is the pseudo-diffusion-coefficient of blood related to blood-velocity in capillaries, and Dpure which is the diffusion-coefficient of water protons diffusing passively in the tissues. This model has been intensively used to quantify the perfusion fraction in different organs with different protocols. However, results are very heterogeneous and lack reproducibility. No standard values for the perfusion fraction has therefore been accepted yet.
Fitting data to a multi-exponential model is known to be an ill-posed problem which is exacerbated by noise 1. For bi-exponential models such as in Eq. (1), it has been demonstrated that the ratio of the two decay-constants (i.e. Dpseudo/Dpure) must exceed a certain noise-dependent threshold to correctly measure these parameters and, conversely, that no algorithm can lead to any reliable results if this ratio is not large enough 1. This result implies that the blood velocity (related to Dpseudo) must be maximized during the image acquisition to obtain more accurate measurements. In this study, we numerically and experimentally tested this hypothesis for the application of kidney diffusion-MRI.
Method
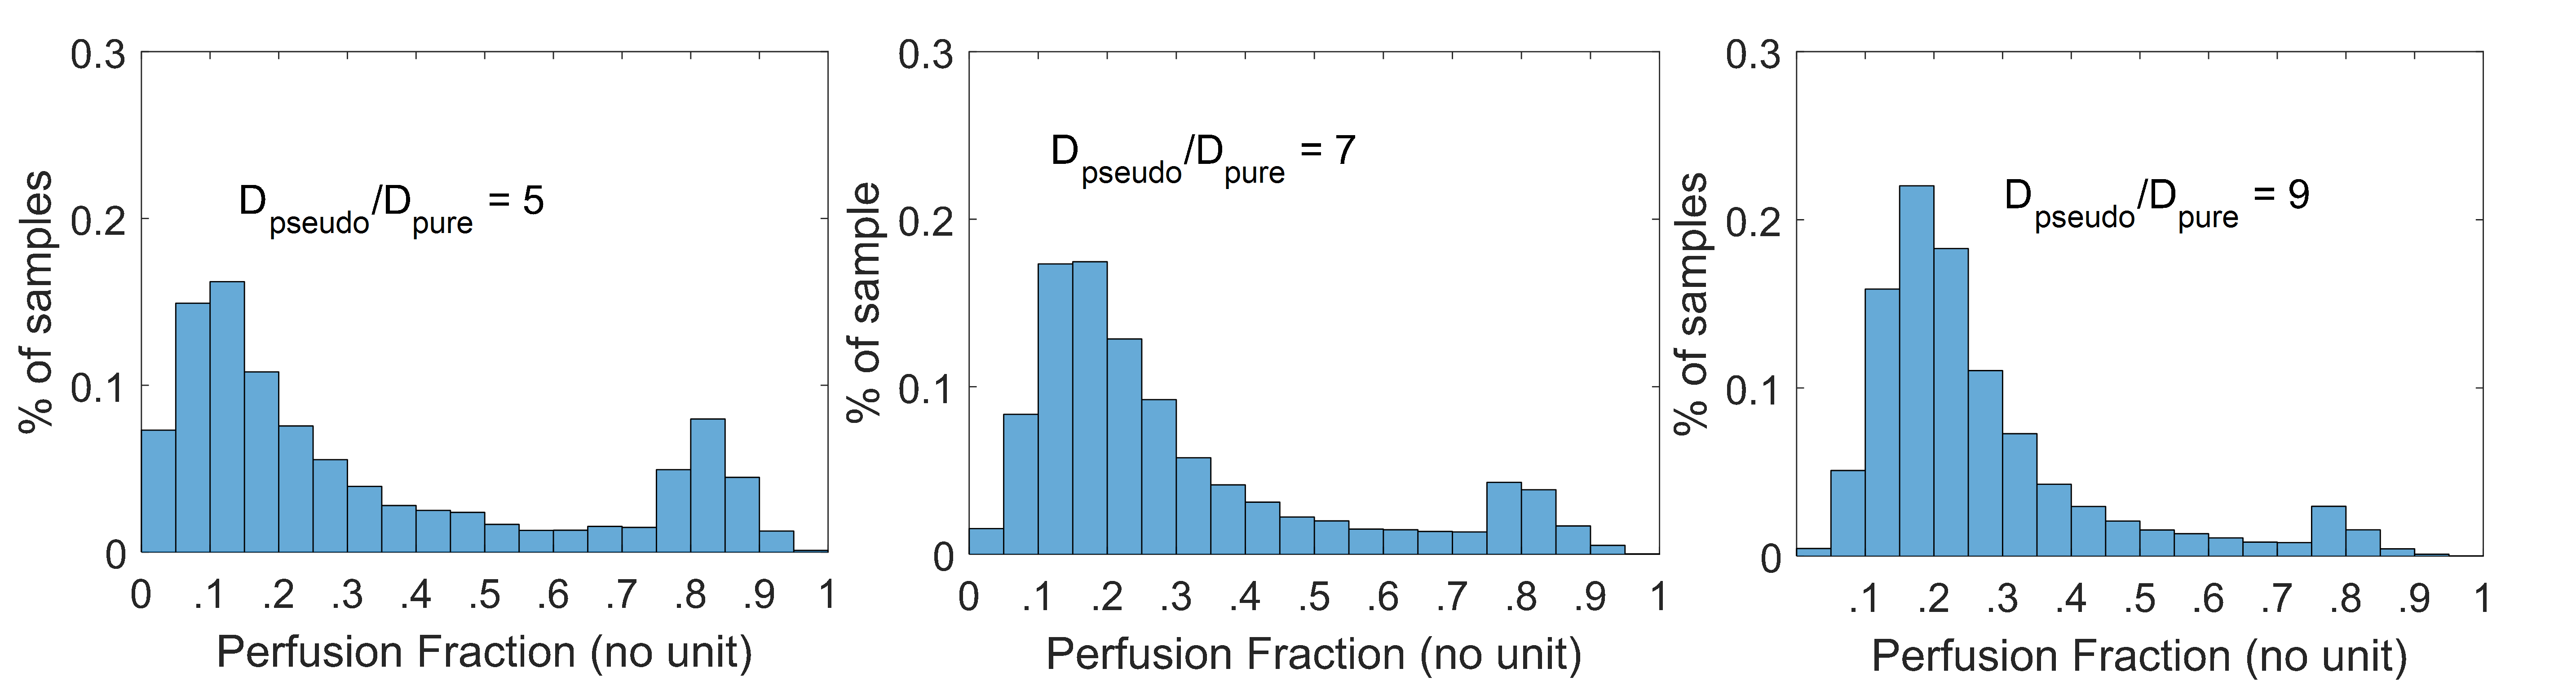
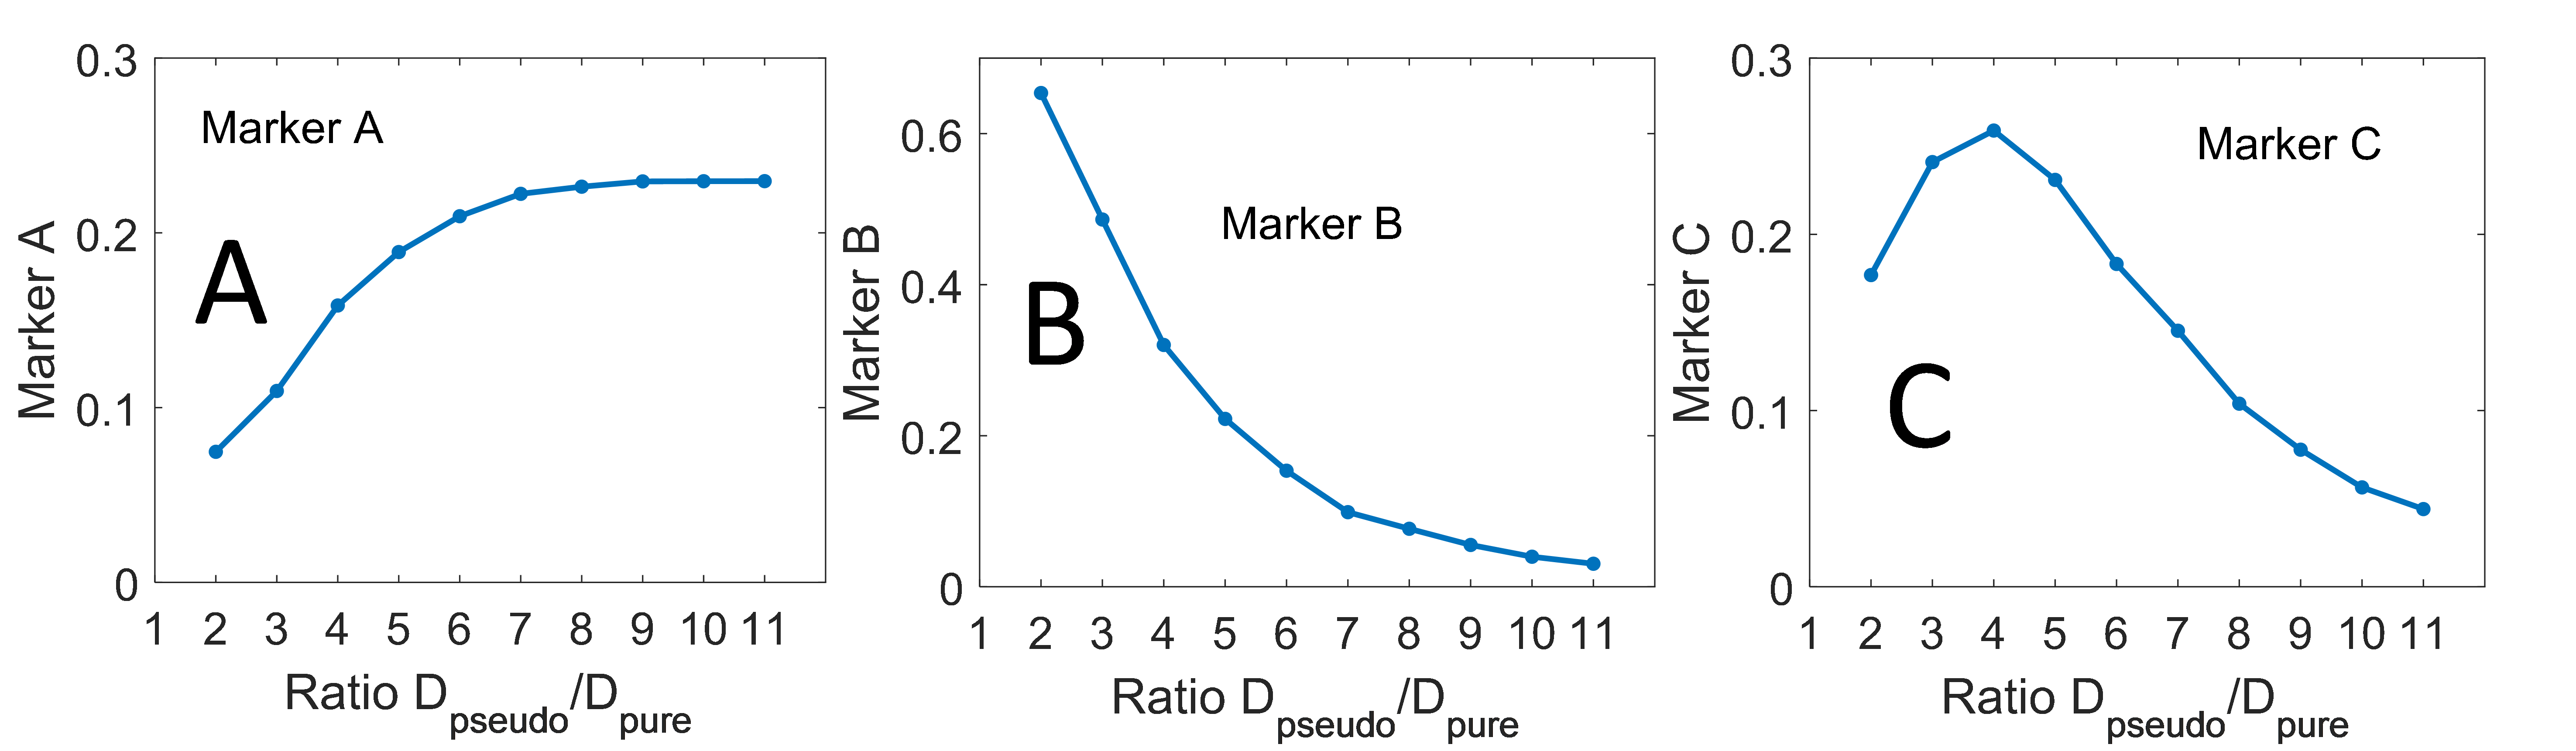
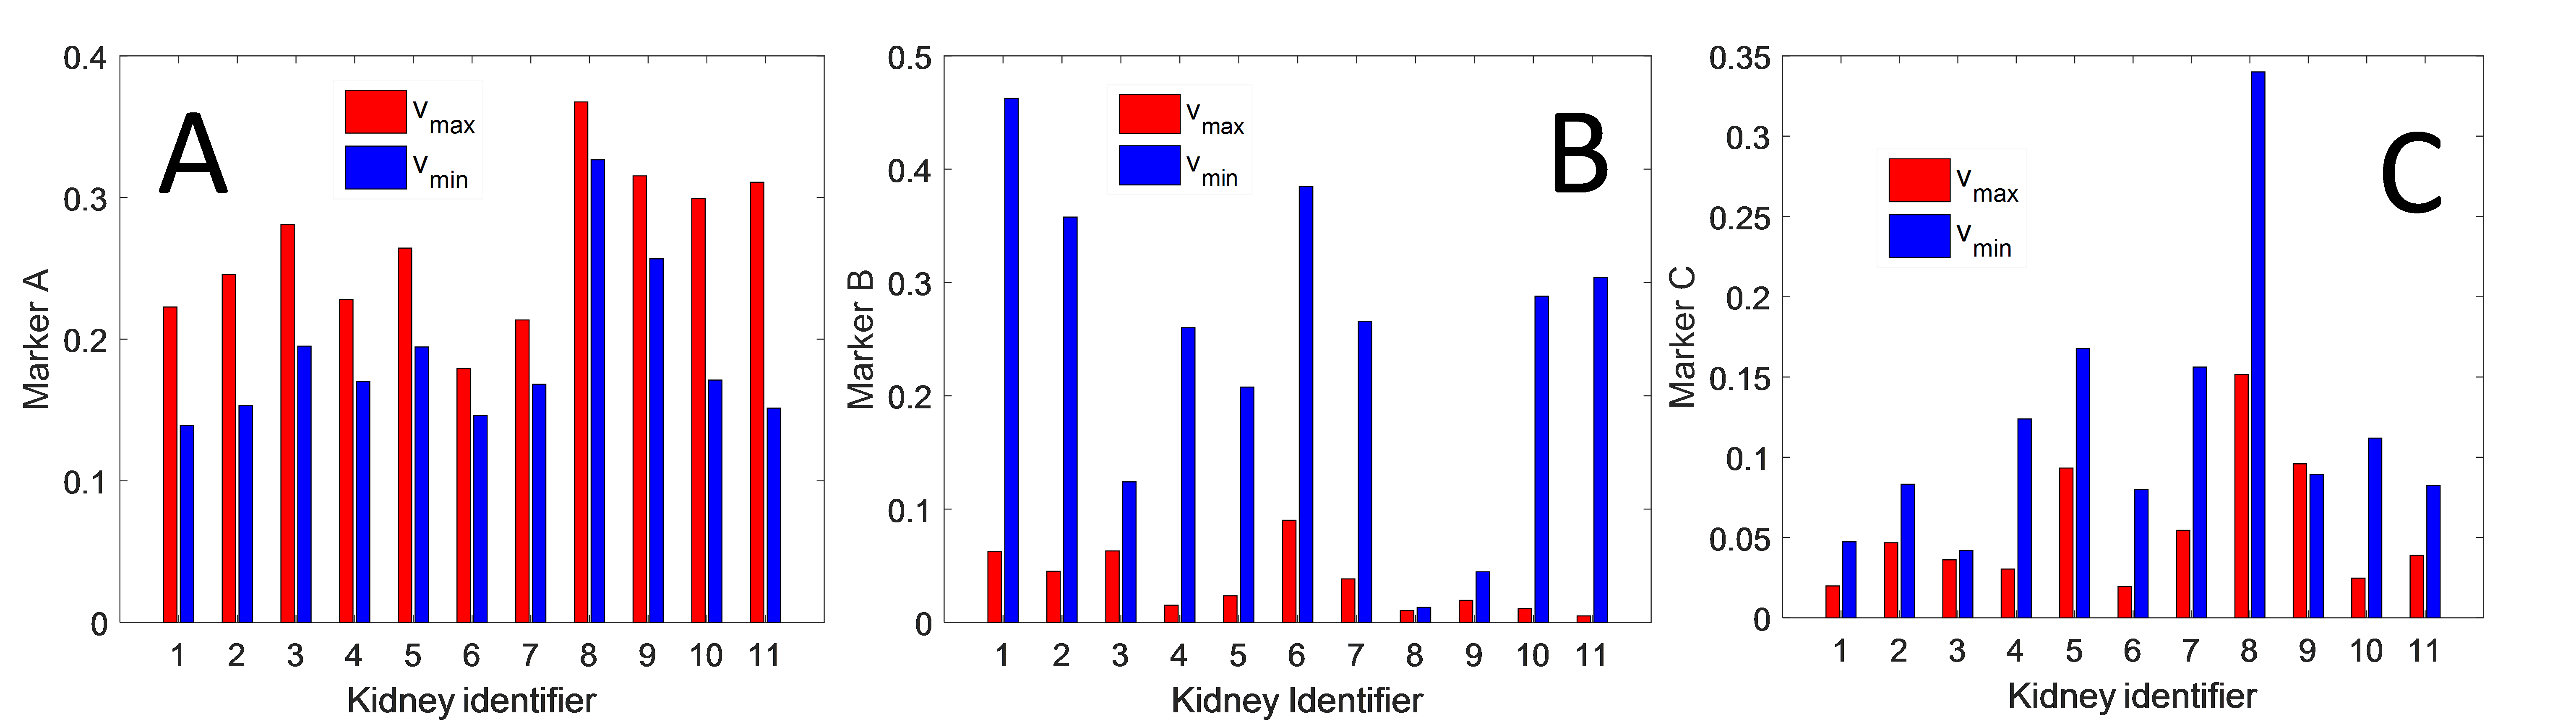
Numerical experiment: a least square fitting procedure following a bi-exponential model was applied to a simulated decay curve with realistic parameters (PF = 0.2, Dpure = 2·10-3 mm2/s) and additive noises with an amplitude of 7% (in agreement with our MRI measurements). The experiment was repeated 10’000 times for different values of Dpseudo: from 4·10-3 to 22·10-3 mm2/s in steps of 2·10-3 mm2/s. This lead to 10’000 simulated PF-measurements for each of ten different decay-constant-ratios (Dpseudo/Dpure) that ranged from 2 to 11. To compare the ten distributions of the PF measurements, the histograms were quantified with three markers:
-the mean PF of all trials with values smaller that 0.6 (marker A),
-the percent of trials with PF smaller than 0.1 (marker B),
-the percent of trials with PF bigger than 0.6 (marker C).
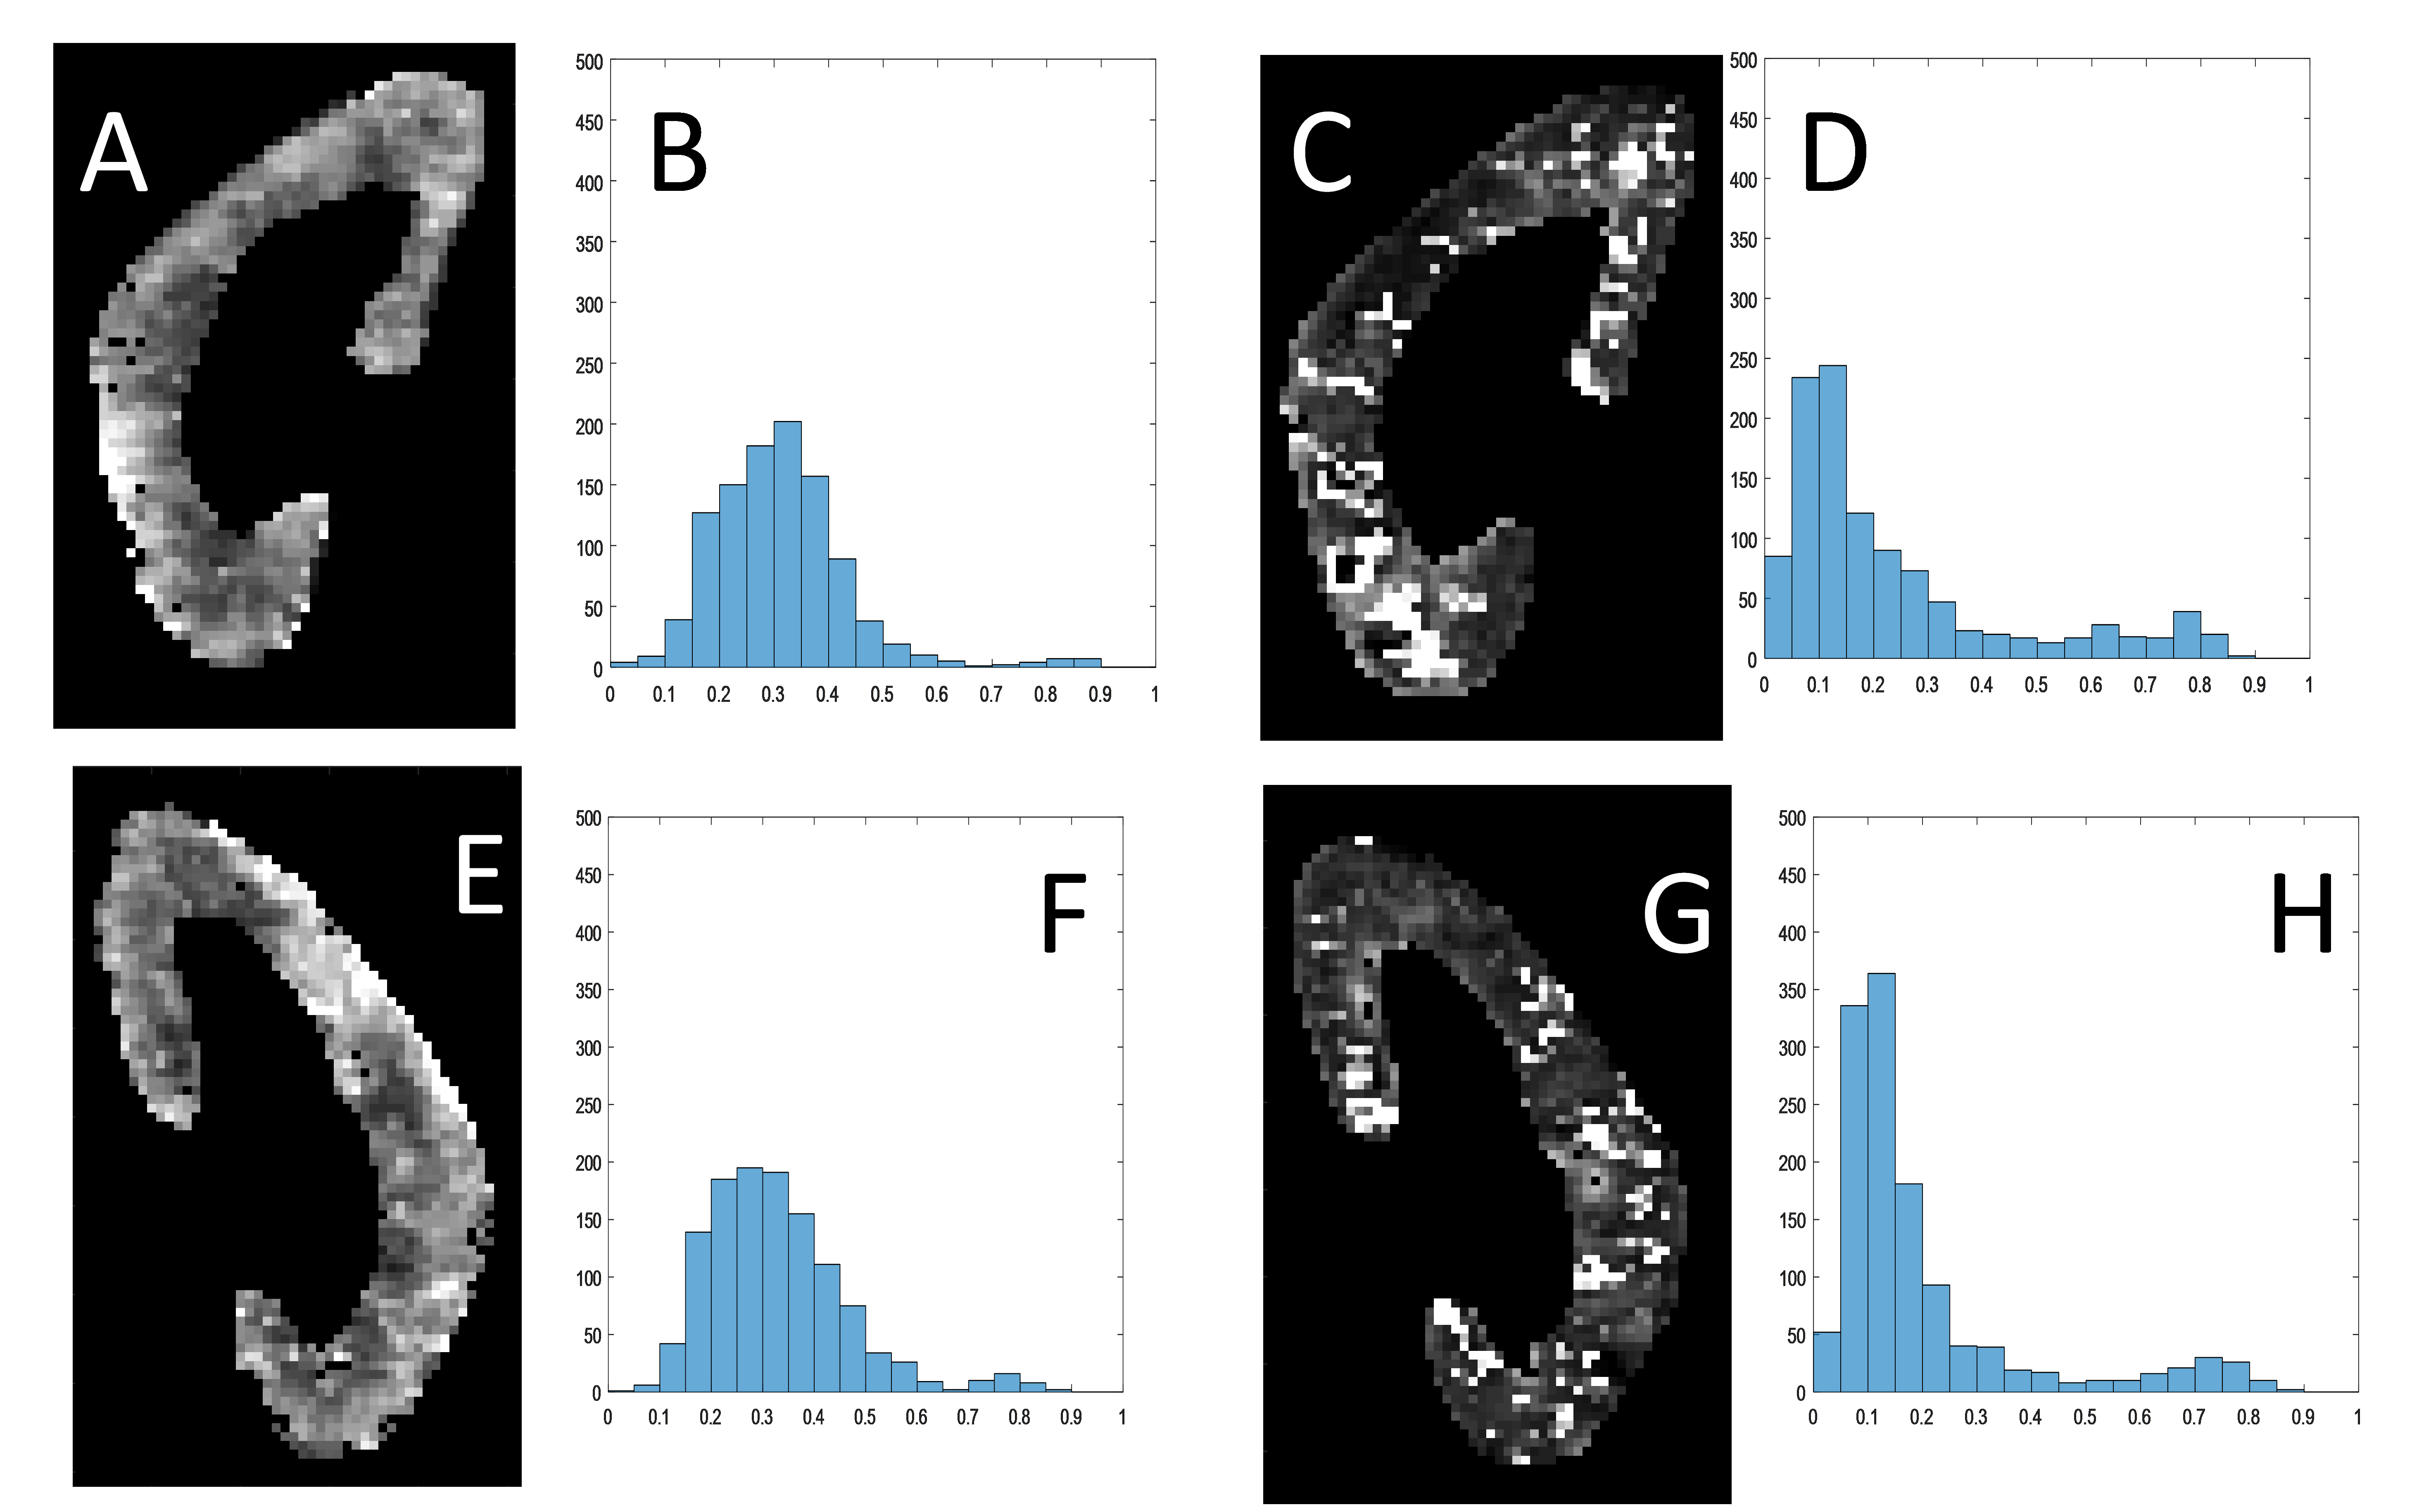
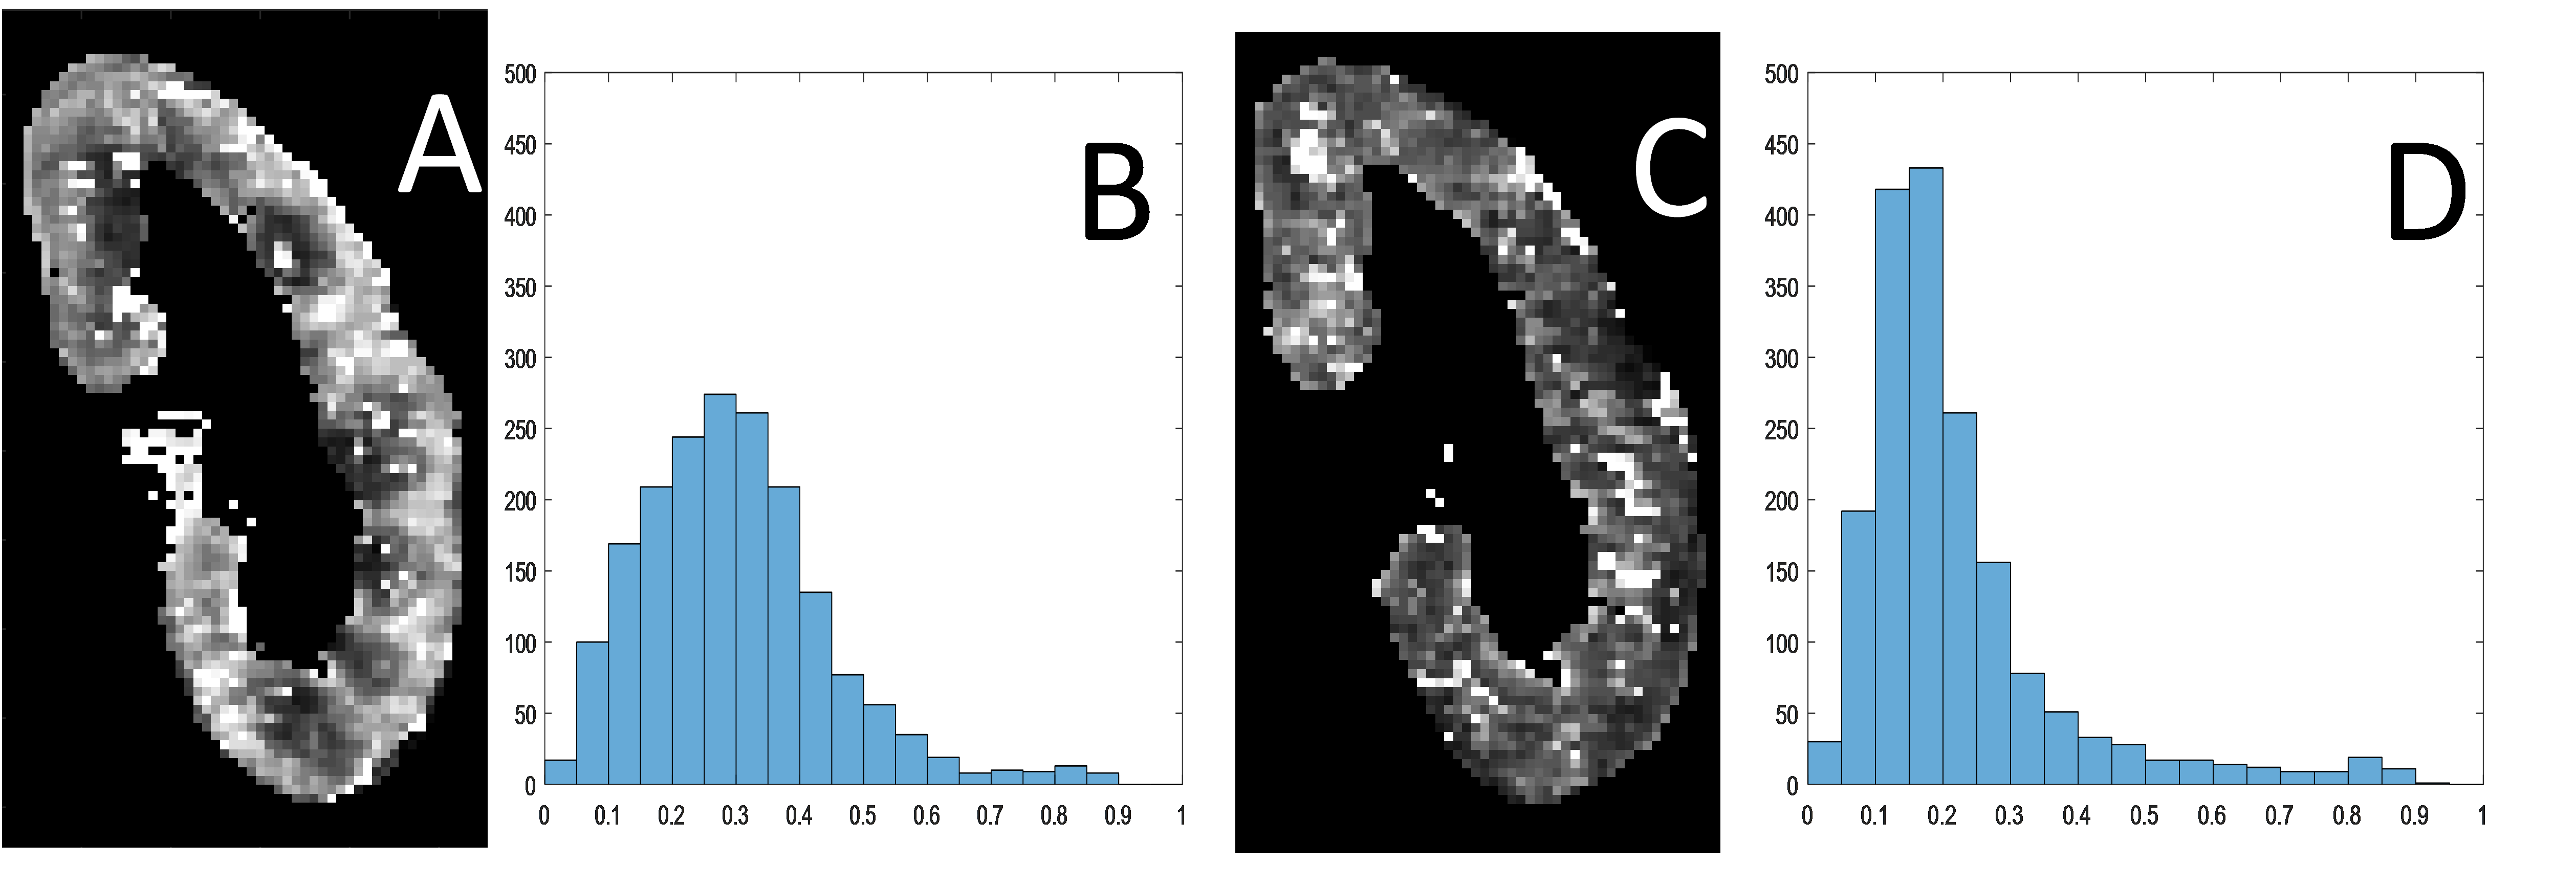
In vivo experiment: 5 healthy volunteers and one chronic kidney disease (ckd)-patient with solitary kidney (11 kidneys in total) where scanned on a 3-T MRI scanner (Magnetom Prisma, Siemens Medical Systems, Erlangen, Germany). The protocol was directly inspired by Wittsack et al2. Phase-contrast flow imaging was performed on one kidney-artery to determine the delays tmax and tmin after the R-wave for which the blood velocity in the renal artery was maximal (vmax) resp. minimal (vmin). DWI was performed with electrocardiogram- and respiratory-gating (liver-dome pencil-beam-navigator) on one coronal plane and the following parameters: 10 b-values, bi-polar diffusion gradients, orthogonal diffusion-directions, echo-planar readout, TE=65ms, TR=220ms, matrix=192x192, FoV=400mm, 4 averages. Two different acquisitions were performed at the two different time-points of the cardiac cycle i.e. tmax and tmin. For each pair of acquisitions, a radiologist with 20 years experience evaluated the cortico-medullary-differentiation and quality of the PF-maps. The PF-map-histogram of each kidney-parenchyma was quantified with the three previously defined markers to assess the similarity with the numerical experiment.
Results
Numerical experiment: As predicted by the theory, we observed that the measurements of the PF (=0.2) improves with increased decay-constant-ratio (Fig.1). When this ratio increases, marker A increases and marker B decreases (Fig.2). Marker C decreases for a decay-constant-ratio greater than 3. In vivo experiment: The radiologist jugged that cortico-medullary-differentiation and quality of the PF-map were better for all acquisition at tmax, excepted to one hesitation. Figure 3 and 4 show examples of PF-maps with their corresponding histograms. The quantification of the PF-histogram of each parenchyma with the three markers is in agreement with the numerical experiment (Fig.5).Discussion
We demonstrated numerically and experimentally that the PF-measurements are more accurate when the acquisition is performed at the time-point in the cardiac cycle with maximal blood-velocity, as predicted by the theory. Changes of the perfusion fraction along the cardiac cycle have already been observed in kidneys2. Kidney capillaries are however unlikely to experience a significant volume change during the cardiac cycle. In our opinion, this change of perfusion fraction is not due to a real change of blood volume but appears because the measurements are more precise when blood has a high velocity, and are subject to inherent instability of the fitting procedure when blood has a lower velocity.Acknowledgements
No acknowledgement found.References
1.Istratov, A.A. and O.F. Vyvenko, Exponential analysis in physical phenomena. Review of Scientific Instruments, 1999. 70(2): p. 1233-1257.
2.Wittsack, H.J., et al., Temporally resolved electrocardiogram-triggered diffusion-weighted imaging of the human kidney: correlation between intravoxel incoherent motion parameters and renal blood flow at different time points of the cardiac cycle. Invest Radiol, 2012. 47(4): p. 226-30.
Figures