0872
The value of diffusion kurtosis imaging in assessing pathological complete response to neoadjuvant chemoradiation therapy in rectal cancer: a comparison with conventional diffusion-weighted imagingFei-Xiang Hu1, Tong Tong1, Wei Tang1, Yi-Qun Sun1, Dang Wang1, San-Jun Cai2, Zhen Zhang3, Grimm Robert4, Xu Yan5, Cai-xia Fu6, and Wei-Jun Peng1
1Radiology, Fudan University Shanghai Cancer Center, Shanghai, People's Republic of China, 2Colorectal Surgery, Fudan University Shanghai Cancer Center, Shanghai, People's Republic of China, 3Radiotherapy, Fudan University Shanghai Cancer Center, Shanghai, People's Republic of China, 4MR Applications Predevelopment, Siemens Healthcare GmbH, Germany, 5MR Collaboration NE Asia, Siemens Healthcare, People's Republic of China, 6APPL, Siemens Shenzhen Magnetic Resonance Ltd., People's Republic of China
Synopsis
The aim of this study was to evaluate the performance of diffusion kurtosis imaging (DKI) in predicting pathological complete response (pCR) of locally advanced rectal cancer (LARC) to neoadjuvant chemoradiation therapy (CRT) before and at an early stage of the treatment, and in comparison to conventional diffusion-weighted imaging (DWI). Results showed that DKI outperformed conventional DWI in accurately differentiating between pCR and nonPCR patients who received neoadjuvant chemoradiation therapy both before and at an early stage of treatment.
Introduction
Previous studies [1-5] have reported that DKI outperforms conventional ADC regarding tumor detection and grading. One study [6] suggested that DKI may be superior to ADC for predicting early response to neoadjuvant chemotherapy (NAC) in patients with locally advanced nasopharyngeal carcinoma (NPC). Our study aims to assess whether DKI could be helpful in predicting pathological complete response (pCR) of locally advanced rectal cancer (LARC) to neoadjuvant chemoradiation therapy (CRT) before and at an early stage of treatment, and to compare DKI with conventional DWI.Methods
Fifty-six consecutive patients diagnosed with locally advanced rectal cancer (LARC) were prospectively enrolled and underwent MRI before and after CRT on a 3 T scanner (MAGNETOM Skyra, Siemens , Erlangen, Germany). An axial multi-b EPI DWI sequence was performed with the following parameters: TR/TE = 4500/82ms; FOV = 200x180mm2; slice thickness = 6 mm; scan matrix = 140x140; voxel size = 1.4x1.4x6 mm3, phase oversampling = 20%; no. of slices = 20; tri-directional diffusion gradients was performed with b values of 0, 700, 1400, and 2100 s/mm2 (with no. of averages = 1, 2, 4, 6, respectively); GRAPPA acceleration factor = 2; acquisition time = 3 min 51 sec. Patients did not receive any bowel preparation before the MR examinations. The apparent diffusion coefficient (ADC), the mean diffusion (MD) value, and mean kurtosis (MK) values of the tumor were calculated by using the prototype post-processing software Body Diffusion Toolbox (Siemens , Erlangen, Germany). The ratios (pre-CRT / post-CRT) of all three parameters were also calculated and evaluated.Results
For a total of 56 rectal lesions (pCR, n=14; non-pCR, n=42), the MKpre and MKpost values were significantly lower for the pCR patients than for the non-pCR patients (0.72±0.09 vs. 0.89±0.11, p<0.001; 0.56±0.06 vs. 0.68±0.08, p<0.001, respectively). MDpost and MDratio were significantly higher for pCR patients than for the non-pCR patients (2.45±0.33*10-3s/mm² vs. 1.95±0.30*10-3s/mm², p<0.001; 0.80±0.43*10-3s/mm² vs. 0.35±0.32*10-3s/mm², p<0.001, respectively). ADCpost and ADCratio were also significantly higher for the pCR patients than for the non-pCR patients (1.31±0.13*10-3s/mm² vs. 1.12±0.16*10-3s/mm², p<0.001; and 0.64±0.34*10-3s/mm² vs. 0.33±0.27*10-3s/mm², p=0.001, respectively). MKpre and MKpost were superior to other parameters for assessment of pCR, having the highest AUC values of 0.901 and 0.908 (cutoff value = 0.8199 and 0.6196), respectively. Figures 1 and 2 show image examples from 2 patients, and Figure 3 shows the ROC curves of all 3 parameters.Discussion and conclusion
Our study showed that DKI outperforms conventional DWI in predicting early treatment response to neoadjuvant chemoradiation therapy in rectal cancer. In particular, the MKpre could more accurately differentiate between pCR and non-pCR patients both before and at an early stage of treatment. MK could be a potential biomarker for CRT response prediction and could be helpful in treatment strategy decision making at an earlier stage. While multicenter trials with larger sample sizes are needed to confirm our findings, our results thus far show that DKI may be a novel superior option for the evaluation of CRT response of LARC compared to conventional imaging.Acknowledgements
No acknowledgement found.References
[1] Jensen JH, etc., MAGN RESON MED 2005; 53(6):1432-1440. [2]Sun K, etc., RADIOLOGY 2015; 277(1):46-55. [3]Suo S, etc., MAGN RESON IMAGING 2014;32(5):421-427. [4] Nogueira L, etc., EUR RADIOL 2014;24(6):1197-1203. [5]Van Cauter S, etc., RADIOLOGY 2012; 263(2):492-501. [6]Chen Y, etc., J MAGN RESON IMAGING 2015;42(5):1354-1361.Figures
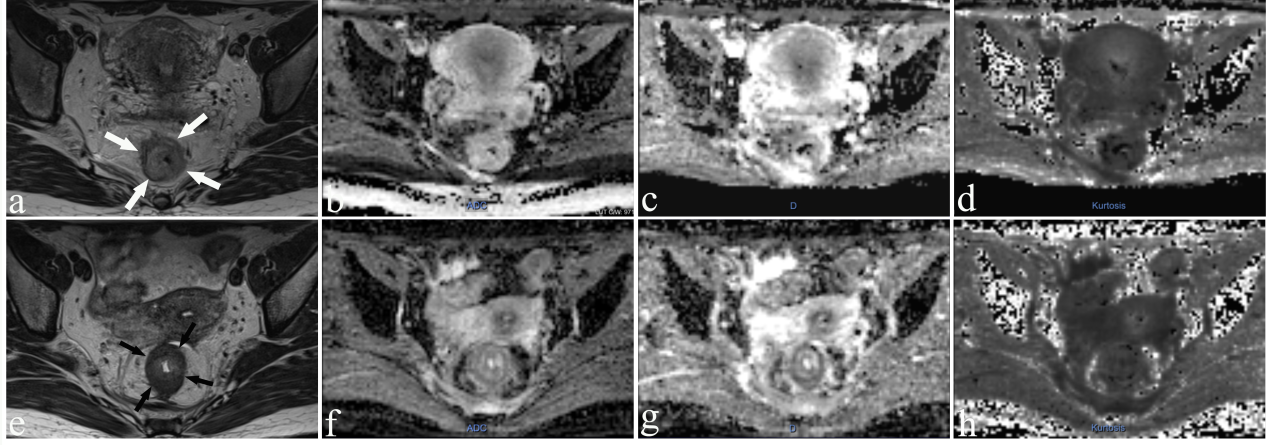
Figure 1: Images of a 36-year-old woman with a pCR. Images were acquired before CRT (a-d) and post-CRT (e-h). (a, e) are T2-weighted MR images showing a tumor visible in the rectum (arrows). The others are ADC maps (b, f), D maps (c, g), and K maps (d, h). The means of ADC, MD, and MK of the lesion were 0.932×10⁻³ mm2/s, 1.580×10⁻³ mm2/s, and 0.657 before CRT, respectively. While ADC and MD increased substantially to 1.240×10⁻³ mm2/s and 2.601× 10⁻³mm2/s, MK decreased slightly to 0.535 after CRT.
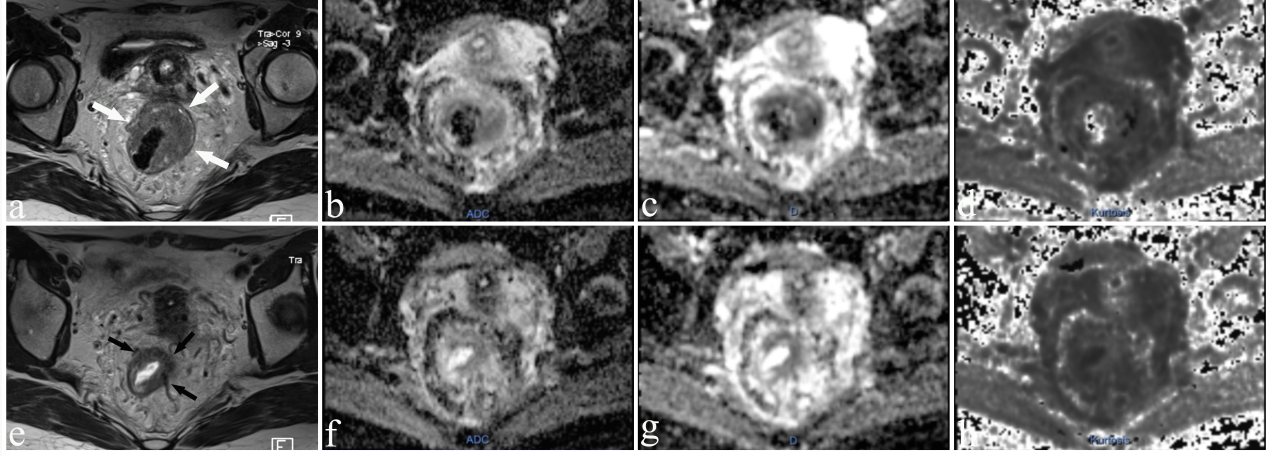
Figure 2: Images of a 43-year-old woman with a non-pCR. Images were acquired before CRT (a-d) and post-CRT (e-h). (a, e) are T2-weighted MR images showing a tumor with a horseshoe shape visible in the rectum(arrows). The mean values of ADC, MD, and MK of the lesion were 0.924×10⁻³ mm2/s, 1.4244×10⁻³ mm2/s, and 0.876, respectively, before CRT. After CRT, the ADC and MD increased slightly to 0.947×10⁻³ mm2/s and 1.533×10⁻³ mm2/s, while MK decreased slightly to 0.812.
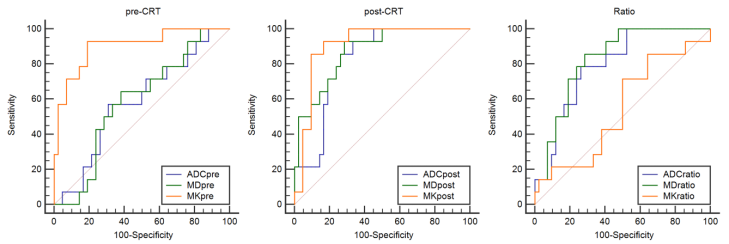
Figure 3:The receiver operating characteristic (ROC) curve analyses were calculated to characterize each parameter in terms of its value in predicting the CRT outcome.