0871
Intravoxel incoherent motion diffusion-weighted imaging for discriminating the pathological response to neoadjuvant chemoradiotherapy in locally advanced rectal cancerWen Lu1, Yu xiaoping1, and Zhang zhongping2
1Hunan Cancer Hospital, Chang sha, People's Republic of China, 2GE Healthcare China, Beijing, People's Republic of China
Synopsis
In this study, we investigated the utility of IVIM-DWI in discriminating the pathological response to nCRT in locally advanced rectal cancer (LARC). We found that both the pre-nCRT and post-nCRT IVIM-DWI parametric values for LARC, together with their percentage changes, might benefit the evaluation of pathological response to nCRT, which suggest IVIM-DWI is potentially useful in discriminating pathological response for LARC patients.
Introduction
Neoadjuvant chemoradiotherapy (nCRT) followed by total mesorectal excision (TME) has become a standard treatment in patients with locally advanced rectal cancer (LARC) [1], which could decrease loco-regional recurrence rate and even increase overall survival. After nCRT, approximately 15%-27% of LARC patients would achieve a complete pathologic response (pCR) [2, 3]. These patients will have a favourable long-term outcome with excellent local control and disease-free survival. Moreover, Maas and Intven M found that patients with a pCR had an excellent long-term outcome regardless of surgical resection.Accordingly, with the introduction of organ-sparing treatments in rectal cancer there is an increasing need for reliable selection methods to select pCR and non-pCR to after CRT. Therefore, the purpose of the present study was to evaluate the utility of IVIM-DWI in discriminating the pathological response to nCRT for LARC patients.Methods
This prospective single-center study was approved by the Medical Ethics Committee in our institution. Firty-two patients with LARC underwent preoperative IVIM-DWI examination at baseline (pre-nCRT) and 8 weeks after the end of nCRT (post-nCRT). A total of 12 b values (0, 10, 20, 30, 50, 80,100, 150, 200, 400, 600 and 800 s/mm2) were applied with a single-shot diffusion weighted spin-echo echo-planar (ssSE-DW-EPI) sequence. After surgery, the patients were divided into the complete response (pCR) (TRG 4) and non-complete response (non-pCR) (TRG 0,1,2 or 3) groups, and into the good response (GR) (TRG 3 or 4) and the poor response (PR) (TRG 0,1 and 2) groups, according to the Dworak tumor regression grade (TRG) system. The pre-nCRT and post-nCRT IVIM-derived metrics (ADC,D,D* and f), together with their changes (∆metrics) induced by nCRT, were compared between the pCR and non-pCR groups and between the GR and PR groups. The diagnostic efficacy of the IVIM-DWI parameters was determined by using receiver-operating characteristic curve (ROC) analysis. Correlations between TRG score and the IVIM-DWI parametric values were also analyzed.Results
After nCRT, the ADC and D values for LARC increased significantly (all P<0.05). TRG score revelled positive correlation with pref (r=0.357, P=0.020), postD (r=0.551, P=0.000) and ∆%D (r =0.605, P=0.000). The IVIM-DWI parametric values for the pCR (n=10), non-pCR (n=32), GR (n=15) and PR (n=27) groups are summarized in Table 1. The preD*, pref, postD, ∆%ADC and ∆%D values demonstrated significant differences between the pCR and non-pCR groups, whereas the postD, ∆%ADC and ∆%D values showed obvious differences between the GR and PR groups (Figures 1) .Figures 4 and Figures 5 show representative images of LARC from different pathological response groups.Based on ROC curve analysis, the diagnostic performance of the IVIM-DWI parameters in identifying pathological response are showed in Figures 2 and Figures 3. For discriminating pCR from non-pCR, ∆%D had the highest area under the curve (AUC) (0.881), sensitivity (90.0%) and positive predictive value (95.9%) among the five IVIM-DWI parameters. The AUC value of ∆%D was significantly higher than that of ∆%ADC in discriminating the pCR from non-pCR groups (P=0.009). Among the three IVIM-DWI parameters which were helpful in distinguishing the good from poor responders, postD had the highest specificity (100%) and positive predictive value (100%) with an AUC of 0.790, whereas ∆%D had the highest sensitivity (93.3%) and negative predictive value (94.1%) with an AUC of 0.807.Discussion and Conclusion
The present study found that CRT causes obvious changes in the diffusion-related parameters (ADC and D) values in LARC. The increase of diffusion-related parametric values may reflect the reduction of cellularity due to necrosis and apoptosis as treatment effect of CRT[4]. TRG score demonstrated obviously positive correlations with the post-CRT diffusion-related parametric value (postD and ∆%D), suggesting that the diffusion- related microenvironment in LARC after CRT has significant relevance to the status of tumor residual. This suggestion was also supported by our observation that there were obviously higher postD and ∆%D values for the pCR(versus non-pCR)and GR(versus PR).The preD* and pref for the pCR group were significantly higher than those for the non-pCR group. Additionally, TRG score reveled positive correlation with pref in this study. These findings indicate higher baseline perfusion might result in better sensitivity to nCRT for LARC. Higher preD* and pref values represent higher vascularization, perfusion and oxygenation level in tissues, which would lead to better therapeutic response to nCRT. Moreover, higher vascularization and perfusion can result in better delivery of chemotherapeutics into tumor tissue [5].In conclusion, the present study demonstrates that IVIM-DWI is potentially useful in discriminating pathological response to nCRT for LARC patients.Acknowledgements
No acknowledgement found.References
[1] Valentini V, Aristei C, Glimelius B, et al. Multidisciplinary rectal cancer management: 2nd European rectal cancer consensus conference (EURECA-CC2). Radiotherapy and oncology. 2009;92:148-63.[2] Maas M, Nelemans P, Valentini V. Pathologic complete response after chemoradiation for rectal cancer is associated with improved long-term outcome: a pooled analysis of 3105 patients. Lancet Oncol. 2010;11:835-44.[3] Intven M, Reerink O, Philippens ME. Dynamic contrast enhanced MR imaging for rectal cancer response assessment after neo-adjuvant chemoradiation. Journal of Magnetic Resonance Imaging. 2015;41:1646-53.[4] Jenkinson MD, Du Plessis DG, Smith TS, Brodbelt AR, Joyce KA, Walker C. Cellularity and apparent diffusion coefficient in oligodendroglial tumours characterized by genotype. Journal of neuro-oncology. 2010;96:385-92.[5] Cooper RA, Carrington BM, Loncaster JA, et al. Tumour oxygenation levels correlate with dynamic contrast-enhanced magnetic resonance imaging parameters in carcinoma of the cervix. Radiotherapy and Oncology. 2000;57:53-9.Figures
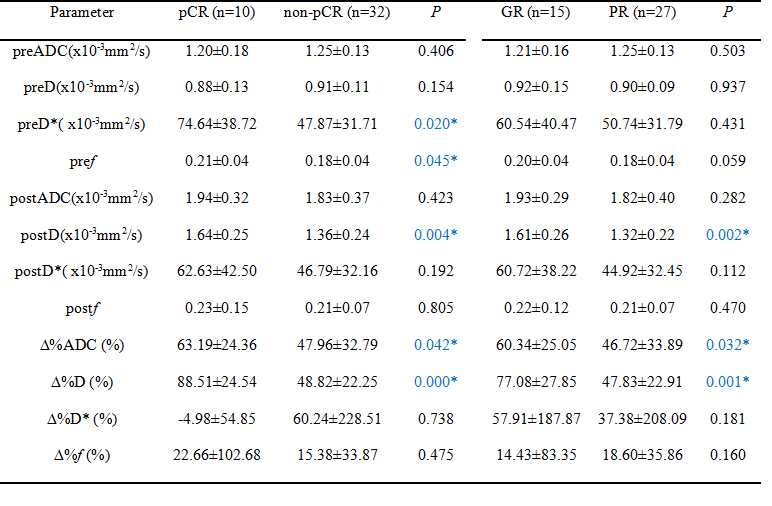
Figures1 Differences in the IVIM-based parametric values between the pCR and non-pCR groups and between the GR and PR group
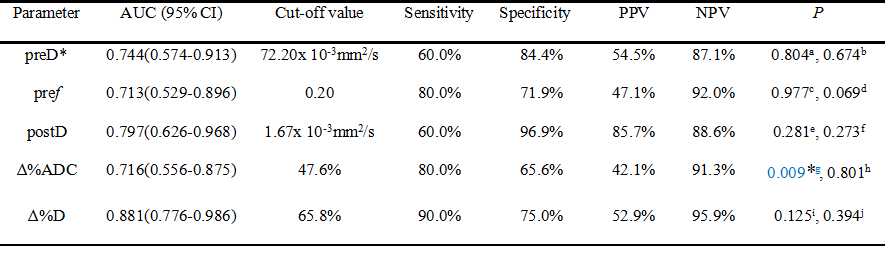
Figures2 Diagnostic efficacy of the IVIM-based parametric values in the differentiation between the pCR and non-pCR groups
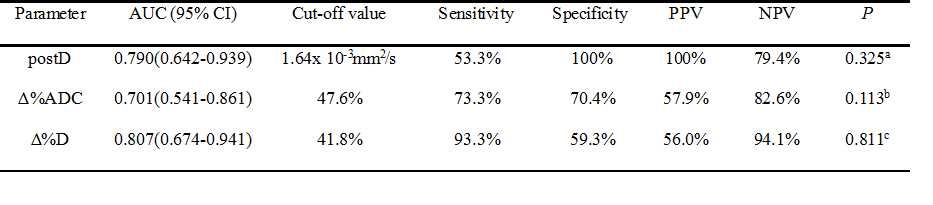
Figures3 Diagnostic efficacy of the IVIM-based parametric values in the differentiation between the GR and PR groups
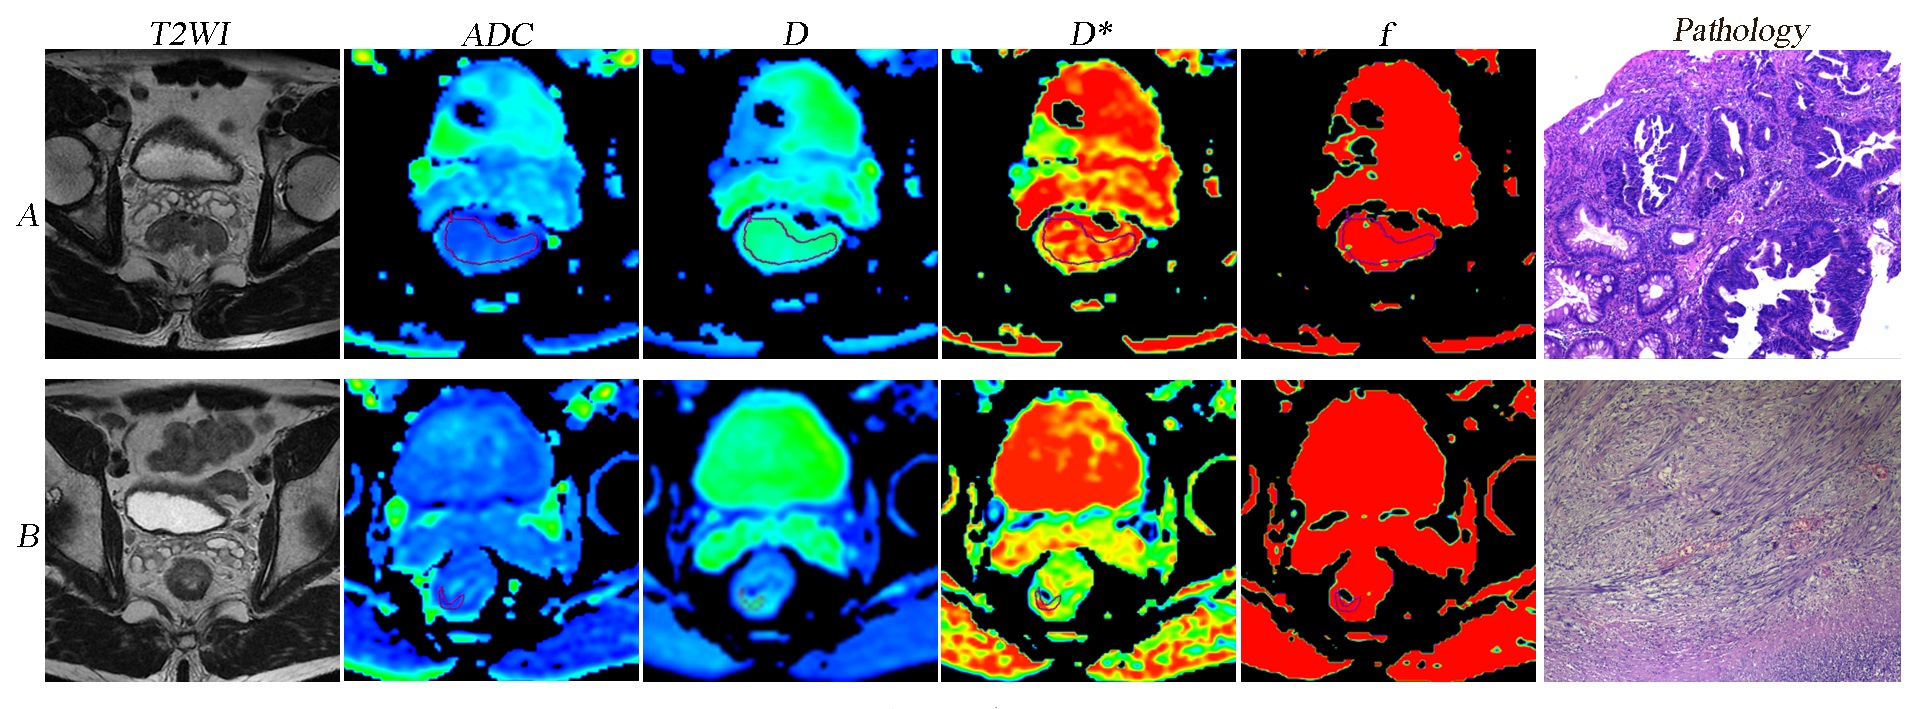
Figures4 A LARC patient from the pCR and GR groups (TRG 4). Images in the row A and B are T2WI, IVIM-DWI parametric and pathological maps before and after nCRT, respectively. The ADC, D, D* and f values before nCRT were 1.07x 10⁻³mm2/s,0.785x10-3mm2/s,47.7x10-3mm2/s and 0.206, respectively. The ADC, D, D*, and f values after nCRT were 2.28 x10⁻³mm2/s, 1.81x10⁻³mm2/s, 55.5 x10⁻³ mm2/s and 0.248, respectively.Pathological map (hematoxylin-eosin staining, original magnification X40) after nCRT indicates absence of residual cancer (TRG 4).
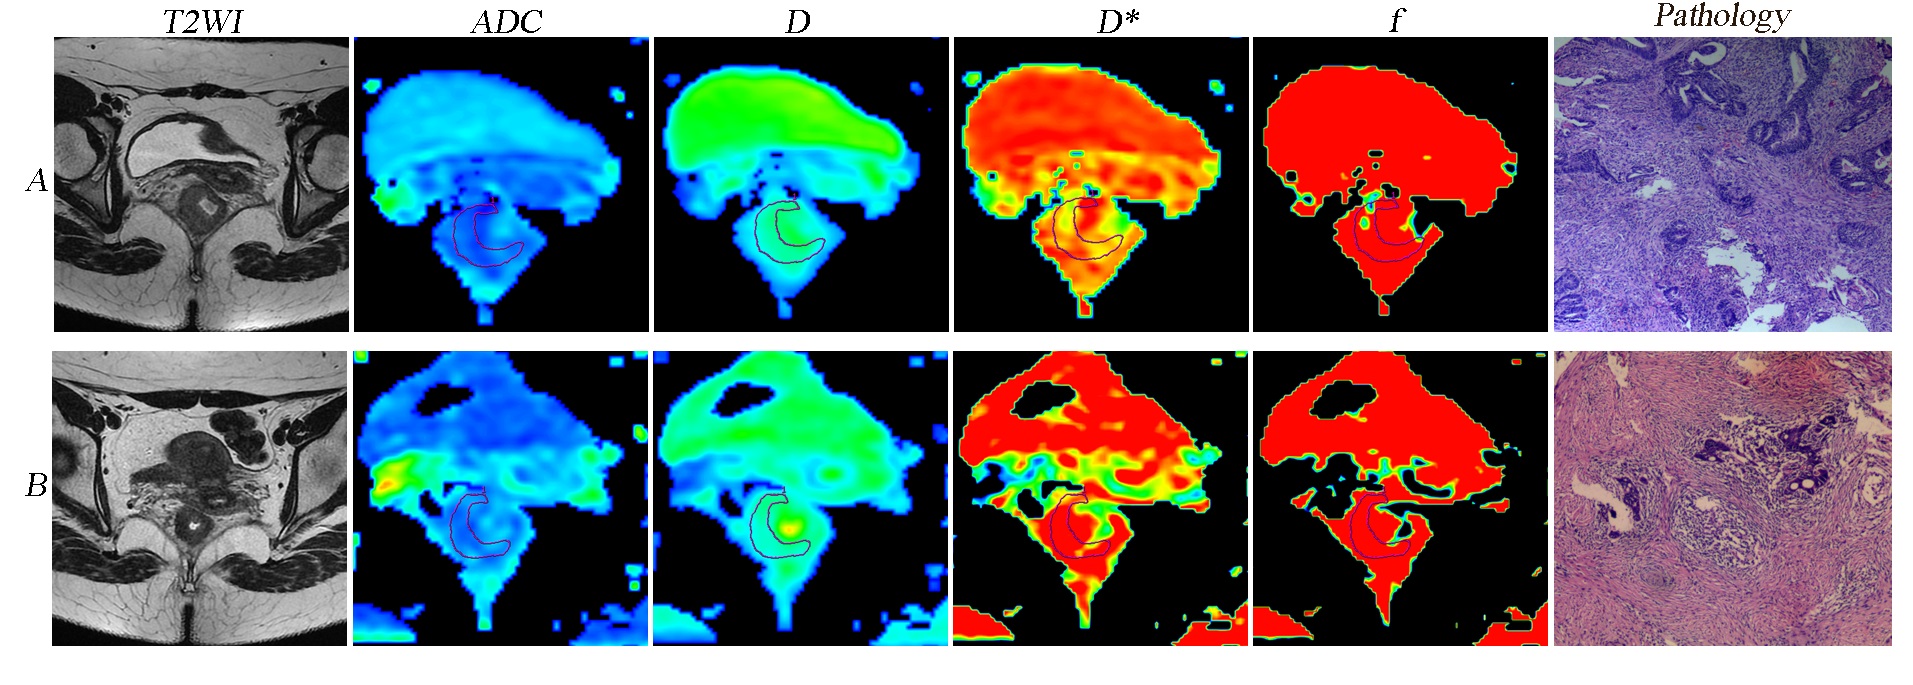
Figures5 A LARC patient from the non-pCR and PR groups (TRG 2). Images in the row A and B are T2WI, IVIM-DWI parametric and pathological maps before and after nCRT, respectively. The ADC, D, D* and f values before nCRT were 1.1x 10⁻³mm2/s, 0.925x10⁻³mm2/s, 40.3x10⁻³mm2/s and 0.165, respectively. The ADC, D, D*, and f values after nCRT were 1.69 x10⁻³mm2/s, 1.61x10⁻³mm2/s, 37.1 x10⁻³ mm2/s and 0.118, respectively. Pathology map (hematoxylin-eosin staining, original magnification X40) after nCRT indicates increased number of residual cancer cells with predominating fibrosis (TRG 2).