0868
Validation of VERDICT MRI using fresh and fixed prostate specimens with aligned histological slices1Centre for Medical Image Computing, University College London, London, United Kingdom, 2Discipline of Medical Radiation Sciences, University of Syney, Sydney, Australia, 3Centre for Advianced Biomedical Imaging, University College London, London, United Kingdom, 4Imaging, Francis Crick Insitute, London, United Kingdom, 5Centre for Medical Imaging, University College London, London, United Kingdom, 6Division of Surgery and Interventional Science, University College London, London, United Kingdom, 7Department of Urology, University College London Hospitals, London, United Kingdom, 8Department of Research Pathology, University College London, London, United Kingdom
Synopsis
This study provides the first step in validating the VERDICT diffusion model of tissue microstructure by examining the effects of fixation on tissue microstructure and comparing VERDICT parameter maps to histological features. Fresh and fixed parameter maps showed similar spatial trends: fixation decreased the extracellular volume fraction parameter and decreased the cell radius parameter slightly, consistent with water efflux. Intracellular volume fraction was lower in regions with lower cellularity, such as the peripheral zone, and directions of diffusion anisotropy corresponded with collagen and smooth muscle orientation patterns in the stroma.
Purpose
Biophysical models like VERDICT1,2 successfully distinguish benign from malignant prostate tissue in vivo, but the accuracy with which model parameters reflect the underlying tissue characteristics is unknown. Traditional histology, which is often used as the gold standard for validation, suffers from fixation effects. This study proposes a method to mitigate this problem by comparing VERDICT parameters in fresh and fixed prostatectomy specimens before comparison with corresponding histological slices.Methods
Specimens
Two prostatectomy specimens were scanned fresh (within 8 hours of surgery) and following formalin fixation (~24 hours later). Fixed specimens were rehydrated for ~10 hours in saline.
Scan protocol
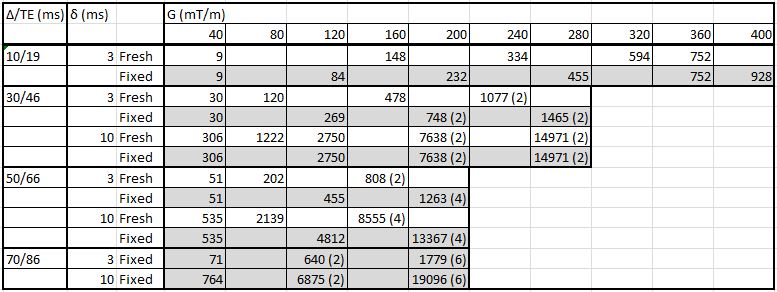
MRI scans were carried out at 9.4 T (Varian Inc). All diffusion images used a PGSE sequence with 1.25 x 1.25 x 2.5 mm3 resolution. Diffusion scan parameters are listed in Table 1 (3 orthogonal directions + 1 unweighted image each). Additionally, high-angular resolution DWIs (b=938 s/mm2) were acquired (20 directions fresh, 30 directions fixed). The fresh protocol contained fewer points (VERDICT parameters agreed within 10%, except DI, which has greater variability for the fresh protocol).
Data analysis
Models combining VERDICT compartments with different shapes were fitted voxelwise3. Compartments: Ball (unrestricted isotropic diffusion), Tensor (unrestricted anisotropic diffusion described by three directions), Zeppelin (cylindrically symmetric tensor) and Sphere (isotropically restricted diffusion).
Parameters fitted include the intracellular volume fraction (fI), intracellular diffusion coefficient (DI), perpendicular diffusion coefficients (D⊥1, D⊥2), sphere radius (R), and the directions for anisotropic components. The normalization constant and T2 were also fitted. The primary extracellular diffusion coefficient (DE) was fixed to 1.5 μm2/ms.
Model selection used the Akaike Information Criterion, $$$AIC=-2\ln(L)+2k$$$, where L is the maximum likelihood obtained from the fit and k is the number of parameters.
Landmarks in a 3D-printed mold were used to select the same slice for fresh and fixed scans, then aligning by manual rotation and translation.
Histology
Guides in the 3D mold were used to cut 3 µm-sections 5 mm apart, aligned with the imaging plane. Slices were stained with H&E, then digitised (Hamamatsu NanoZoomer) using a 20x objective.
Results and Discussion
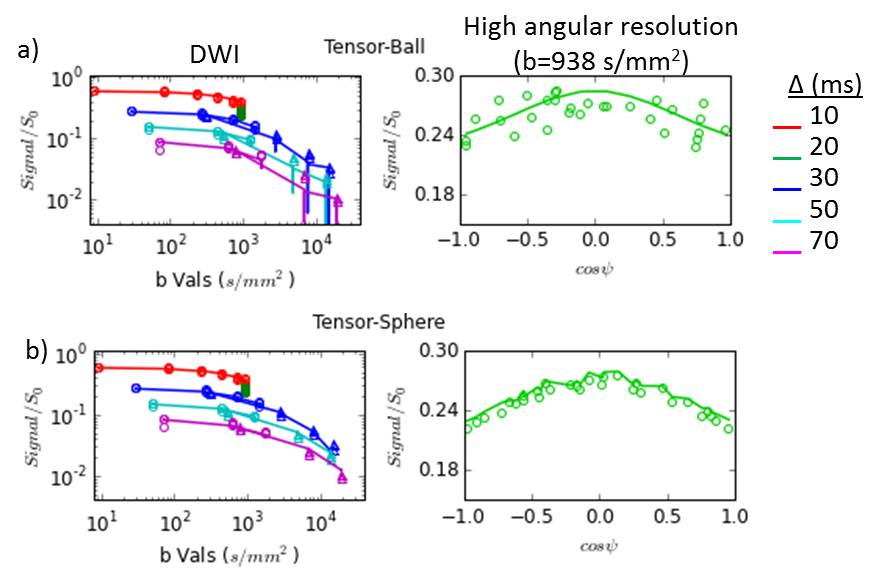
Figure 1 shows fits for a voxel with restriction. The Tensor-Ball model did not capture the trends at high b-values (explanation in Figure caption). The data also indicated anisotropy (Fig 1 right), previously observed ex vivo4.
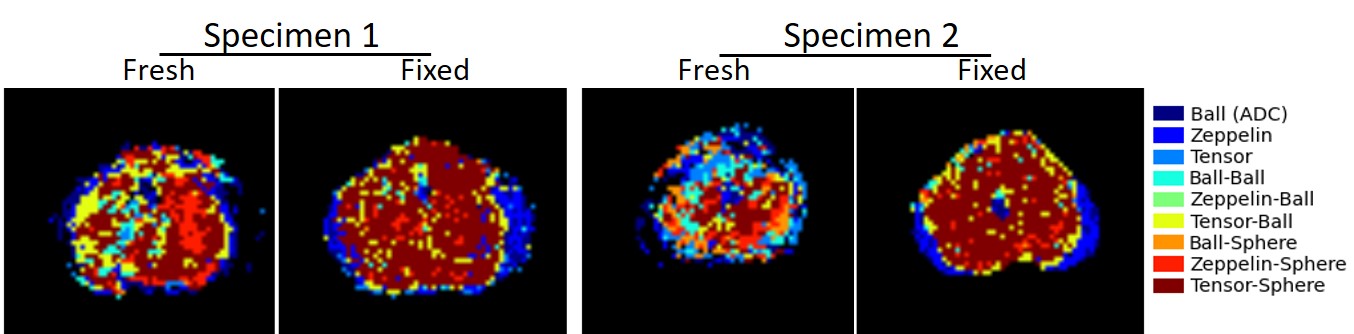
Model selection (via lowest AIC) output is shown in Figure 2. Fresh specimens displayed some voxels where models without restriction (Ball-Ball and Tensor-Ball) were selected. The smaller number of points in the fresh protocol, particularly at high b-values, may reduce the sensitivity to restriction effects. In fixed specimens, the Zeppelin-Sphere and Tensor-Sphere models best explained the data in most voxels, consistent with other studies4.
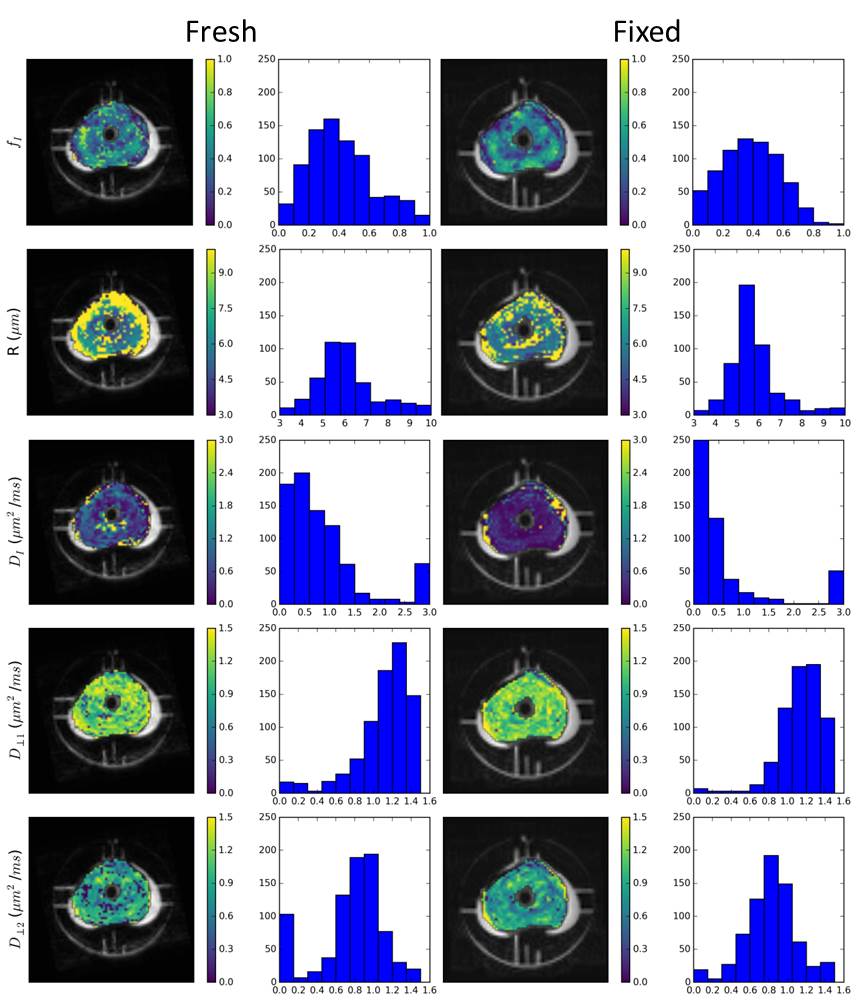
Figure 3 shows the effects of fixation on Tensor-Sphere parameters. Spatial trends were similar between fresh and fixed specimens. R was larger in fresh specimens and fI was smaller, an additional reason that models without restriction may be selected more frequently for fresh tissue: less water experienced the sphere boundary during measurement, which limited the precision of R. The changes in R and fI may result from an efflux of water and cell shrinkage during fixation.
The extracellular perpendicular diffusion coefficients increased slightly from fresh to fixed (a decrease in anisotropy). The apparent decrease in DI from 0.63 to 0.22 µm2/ms may be due to the lower precision of this parameter in the fresh protocol, but the value from fixed voxels agreed with previous high-resolution studies4.
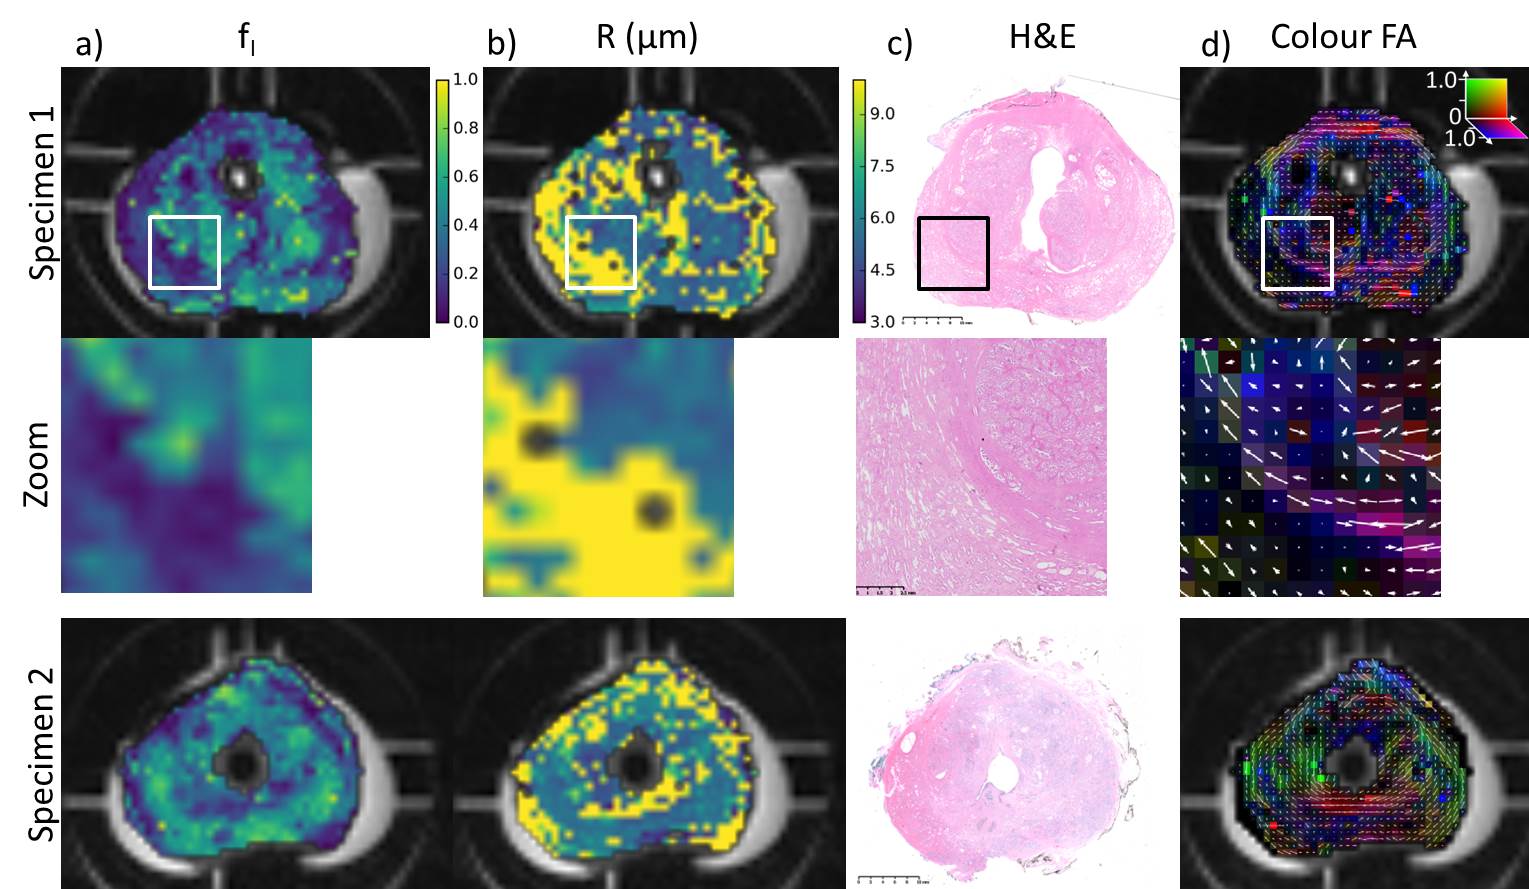
Figure 4 aligns the fI and R fixed parameter maps with histology. The zoomed portion for Specimen 1 highlights trends that can be seen across the sample: regions with lower cellularity had lower fI and R hit the upper limit allowed by the fit in more voxels compared to the transition zone.
The colour FA map indicates the primary diffusion direction and demonstrated stronger anisotropy in stromal regions. The orientation of the collagen and smooth muscle aligned with the primary diffusion direction, a correspondence previously observed using a simple diffusion tensor model6.
Conclusions
Microstructural features from histology corresponded to features of the VERDICT parameter maps, including fewer cells in regions with low fI, such as the peripheral zone, and orientation patterns in the stromal regions that corresponded to the orientation of the extracellular anisotropy. Small changes in fI and R, which can be explained by water efflux, were observed between fresh and fixed tissue maps, but relative trends within a specimen were unaffected. The next step for validation involves clinical VERDICT data and these results emphasise that comparison needs to account for the effects of tissue fixation on microstructure.Acknowledgements
This work was supported by funding from EPSRC platform grant EP/M020533/1, the CRUK-EPSRC Cancer Imaging Centre at KCL/UCL and by EPSRC fellowship EP/N021967/1.References
1. Panagiotaki, E. et al. Noninvasive quantification of solid tumor microstructure using VERDICT MRI. Cancer Res. 74, 1902–1912 (2014).
2. Panagiotaki, E. et al. Microstructural Characterization of Normal and Malignant Human Prostate Tissue With Vascular , Extracellular , and Restricted Diffusion for Cytometry in Tumours Magnetic Resonance Imaging. Invest. Radiol. 50, 218–227 (2015).
3. Panagiotaki, E. et al. Compartment models of the diffusion MR signal in brain white matter: a taxonomy and comparison. Neuroimage 59, 2241–54 (2012).
4. Liang, S. et al. Information-based ranking of 10 compartment models of diffusion-weighted signal attenuation in fixed prostate tissue. NMR Biomed. 29, 660-671 (2016).
5. Bourne, R. M. et al. Effect of formalin fixation on biexponential modeling of diffusion decay in prostate tissue. Magn. Reson. Med. 70, 1160–6 (2013).
6. Bourne, R. M., Bongers, A., Chatterjee, A., Sved, P. & Watson, G. Diffusion anisotropy in fresh and fixed prostate tissue ex vivo. Magn. Reson. Med. 634, 626–634 (2015).
Figures