0867
Diffusion-Weighted MRI Identifies Viable Tissue in Wilms Tumour: Application for Subtype Analysis and Response to Chemotherapy1Developmental Imaging and Biophysics, Institute of Child Health, University College London, London, United Kingdom, 2Developmental Biology and Cancer, Institute of Child Health, University College London, London, United Kingdom
Synopsis
In Wilms Tumour (WT) Blastemal subtype has the worst prognosis. Diffusion MRI (DWI) can distinguish some histological subtypes. Gadolinium-contrast-injected T1 MRI (T1gad) identifies necrotic tissue. Gadolinium is contra-indicated in renal failure. 27 patients received DWI, 20/27 received T1gad. DWI was fitted with Intravoxel Incoherent Motion providing Dmaps. Viable and necrotic regions identified on T1gad were transferred to corresponding Dmaps. ROC analysis determined a D threshold separating necrotic and viable tissue. ANOVAs showed viable regions separated Blastemal from other subtypes, whole lesions could not. DWI separates necrotic and viable tissue in WT potentially identifying subtypes, assessing chemotherapy, guiding biopsies and surgery.
Purpose:
Wilms Tumour (WT) is the most common paediatric renal tumour; accounting for ~90% of all renal tumours1. In Europe patients have surgery after chemotherapy providing risk stratification according to histological response2. Blastemal subtype has a poorer prognosis and is considered ‘high-risk’3. Improving the accuracy of risk stratification can minimise lifelong treatment-related side-effects. Diffusion MRI (DWI) has shown promise in identifying subtypes and showing effects of chemotherapy4. T1-weighted (T1w) MRI following administration of gadolinium can identify ‘non-enhancing’ regions of necrotic tumour tissue, however gadolinium is contra-indicated for patients with renal failure5. Our aim was to separate necrotic and viable tissue without gadolinium injections using DWI, and to investigate if in-vivo identification of WT subtypes is improved by limiting analysis to viable tumour tissue.Methods:
Patients: 27 WT patients from Great Ormond Street Hospital (London, UK) received MRI scans (January 2006-October 2013). The WT subtypes: 5 Blastemal, 4 Epithelial, 10 Mixed, 5 Stromal, 3 Regressive.
MRI: A 1.5T Siemens Magnetom Avanto scanner equipped with 40 mT/m gradients. The multichannel body coil was based on patient size. DWI was acquired during free breathing, using 7 b values (0 50 100 250 500 750 1000), 3 directions. 20 patients received T1w MRI before and after injection of a gadolinium-based contrast.
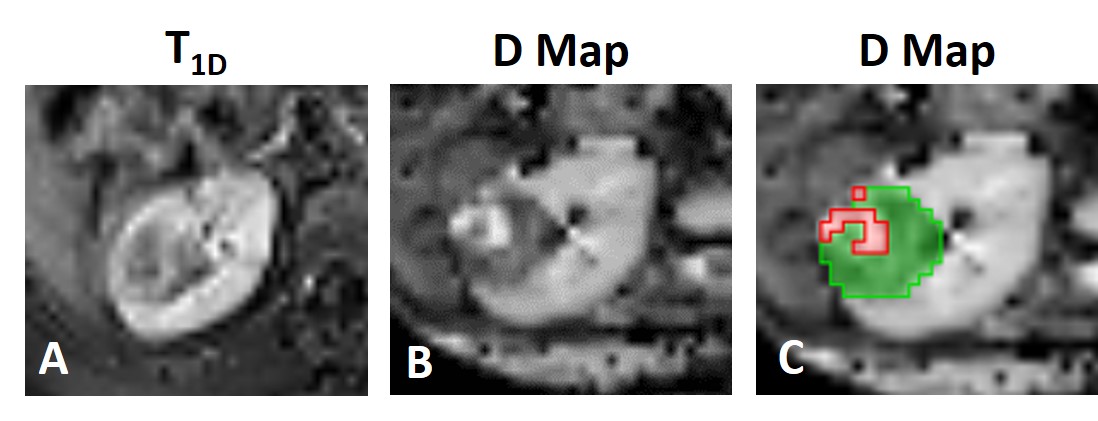
Post-Processing: Diffusion data was fit to the Intravoxel Incoherent Motion6 model to produce maps of D (tissue diffusivity). Difference T1 maps (T1D) were created by subtracting the pre-gadolinium T1w images from the post-gadolinium T1w images.
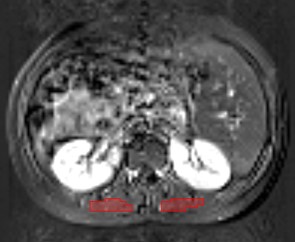
Analysis: For every patient with a T1D map: Regions of Interest (ROIs) were placed on the erector spinae muscles (Figure 1). Mean T1D values in these ROIs were calculated to provide the minimum level of enhancement in viable tissue7 (T1Dviable). ROIs encompassing the entire tumour were then placed on T1D maps. Every voxel within this ROI with T1D ≥ T1Dviable was defined as viable tumour tissue, and voxels with T1D < T1Dviable as necrotic.
Viable/necrotic tumour masks were transferred to each patient’s D map, and values of D across all viable/necrotic tumour regions were compared to examine if D could be a surrogate biomarker to differentiate viable/necrotic tissue. ROC analysis determined which D threshold distinguished viable and necrotic tissue with the highest sensitivity and specificity (Dviable). This threshold was used to generate new viable and necrotic masks for all 27 patients (Figure 2C). Mean D values in the whole tumour and viable tumour were measured for each WT subtype. One-way ANOVAs determined the difference in D between blastemal WT (high-risk) and the other WT subtypes, using both masks.
Results:
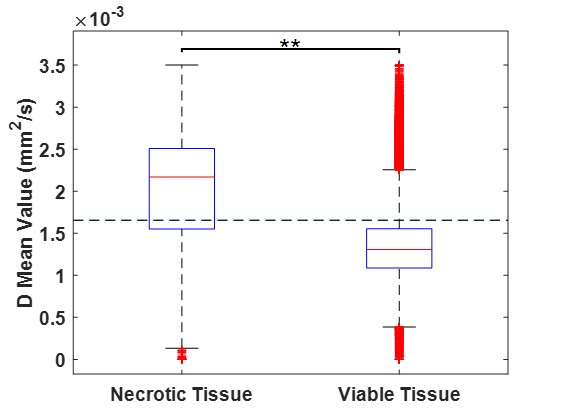
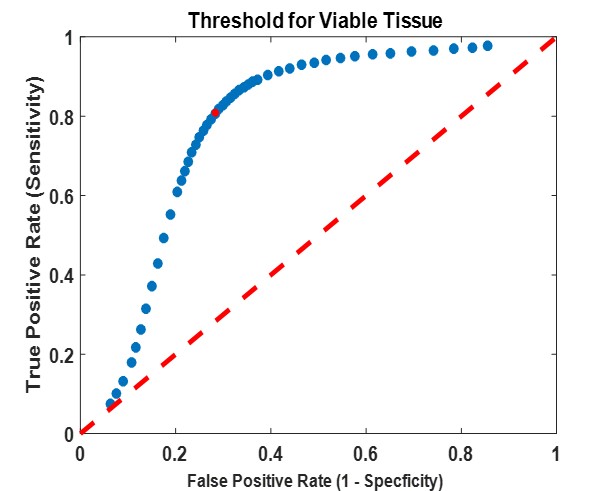
Figure 3 shows a boxplot of D values in viable/necrotic tumour tissue, across all patients’ with T1D maps. D was significantly higher in necrotic tissue (1.999*10-3mm2/s) than viable (1.355*10-3mm2/s), t(117221) = -183.044, p <0.0001. ROC analysis provided an upper threshold of D in viable WT tissue: Dviable = 1.65*10-3mm2/s (Figure 4; all voxels with D > Dviable = necrotic). This threshold had the highest sensitivity (81%) and specificity (72%) for detecting viable tissue (as defined by gadolinium enhancement).
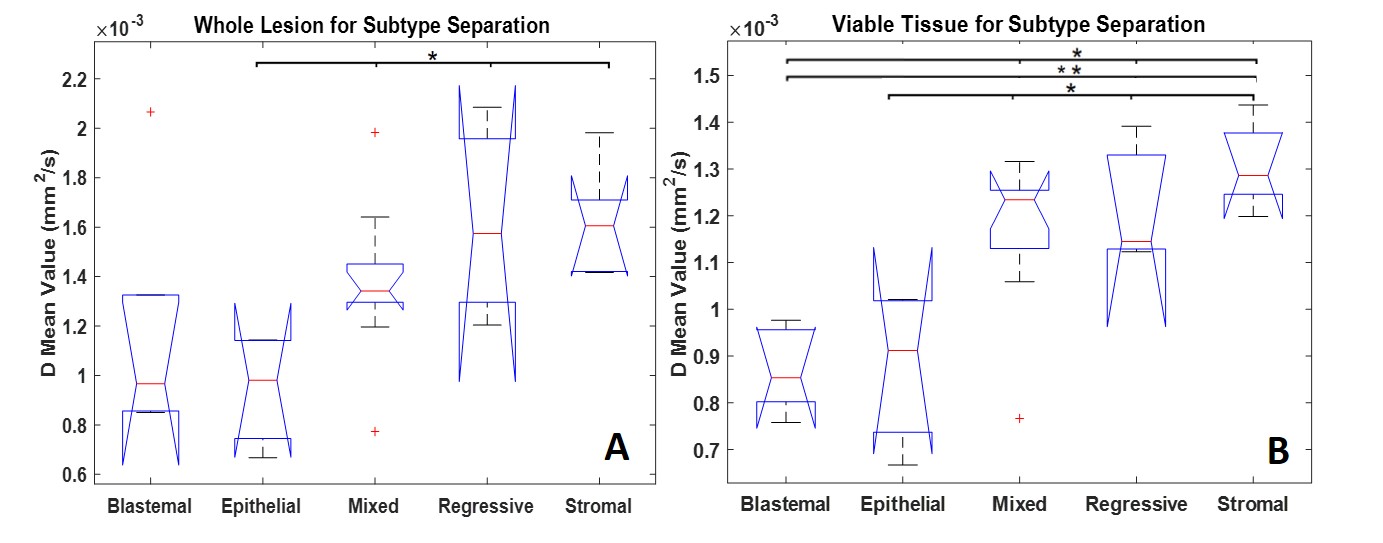
Figure 5 shows one-way ANOVAs for separating Blastemal from other WT subtypes. The mean D values from whole lesion ROIs could only significantly separate Epithelial from Mixed, Regressive and Stromal p < 0.05. Using viable ROIs Blastemal could be separated from Stromal p <0.001, Mixed and Regressive p <0.05. Epithelial could be separated from Mixed, Regressive, and Stromal p < 0.05.
Discussion:
DWI can non-invasively separate viable and necrotic tissue within WT. Identifying necrotic tissue is useful for identifying response to chemotherapy; it was found that 100% tumour necrosis (post-chemotherapy) = 100% patient survival across all tumour grades8. In-vivo identification of viable tumour tissue could guide biopsies to avoid samples being taken from necrotic tumour areas. Additionally, nephron sparing surgery used in bilateral patients would benefit from identifying viable tumour prior to surgery. Confining DWI analysis to viable tumour provides greater separation of subtypes compared to whole lesion. The ability to identify high-risk Blastemal-type WT early and non-invasively would be beneficial for determining treatment.Conclusion:
DWI provides a non-invasive method to separate necrotic and viable tissue with high sensitivity and specificity. This is important in WT as kidney function is often compromised thus gadolinium contrast agent is contra-indicated. By localising the lesion to viable tissue and removing the effects of necrosis it was possible to improve discrimination between Blastemal and the other four possible cell types in WT. Therefore separation of necrotic and viable tissue is beneficial for predicting outcome, response to chemotherapy, guiding biopsies and surgery in WT.Acknowledgements
Ramneek Jouhal provided invaluable assistance with collecting and identifying patient scans. Financial support was provided by Children with Cancer UK.References
[1] Pastore G, Znaor A, Spreafico F, et al. Malignant renal tumours incidence and survival in European children (1978-1997): report from the Automated Childhood Cancer Information System project. Eur. J. Cancer. 2006; 42(13): 2103-2114.
[2] Graf N, Tournade MF, & de Kraker J. The role of preoperative chemotherapy in the management of Wilms' tumor. The SIOP studies. International Society of Pediatric Oncology. Urol Clin North Am. 2000; 27(3): 443-454.
[3] Kinoshita Y1, Suminoe A, Inada H, et al. The prognostic significance of blastemal predominant histology in initially resected Wilms' tumors: a report from the Study Group for Pediatric Solid Tumors in the Kyushu Area, Japan. J Pediatr Surg. 2012; 47(12):2205-2209.
[4] Hales PW, Olsen ØE, Sebire NJ, et al. A multi-Gaussian model for apparent diffusion coefficient histogram analysis of Wilms’ tumour subtype and response to chemotherapy. NMR Biomed. 2015; 28(8): 948-957.
[5] Perazella MA. Gadolinium-contrast toxicity in patients with kidney disease: nephrotoxicity and nephrogenic systemic fibrosis. Curr Drug Saf. 2008; 3(1): 67-75.
[6] Le Bihan D, Breton E, Lallemand D, et al. Separation of diffusion and perfusion in intravoxel incoherent motion MR imaging. Radiology. 1988; 168(2): 497-505.
[7] Littooij AS, Humphries PD, & Olsen ØE. Intra- and interobserver variability of whole-tumour apparent diffusion coefficient measurements in nephroblastoma: a pilot study. Pediatr Radiol. 2015; 45: 1651-1660.
[8] Boccon-Gibod et al. Complete Necrosis Induced by Preoperative Chemotherapy in Wilms Tumor as an Indicator of Low Risk: Report of the International Society of Paediatric Oncology (SIOP) Nephroblastoma Trial and Study 9. Med Pediatr Oncol. 2000; 34(3):183-190.
Figures