0866
An assessment of Intravoxel Incoherent Motion (IVIM) imaging in Detection of Acute Kidney Injury in Rodents1Advanced Imaging Researh Center, UT Southwestern Medical Center, Dallas, TX, United States, 2Department of Internal Medicine / Charles and Jane Pak Center of Mineral Metabolism and Clinical Research, UT Southwestern Medical Center, Dallas, TX, United States
Synopsis
The objective is to investigate the concept of intravoxel incoherent motion (IVIM) for diffusion weight imaging (DWI) in the kidney. We first compared the variability of three methods for bi-exponential fitting applied to the five data sets of DWI obtained in a mouse kidney. Subsequently these three methods were compared with an arterial spin labeling (ASL) in detection of acute kidney injury (AKI) in a rat model. The IVIM imaging did not detect any changes in the AKI model although the ASL clearly demonstrated the reduction of the perfusion.
Purpose
The concept of intravoxel incoherent motion (IVIM), which applies a bi-exponential model to the signal decay in MR diffusion weighted imaging (DWI), is thought to designate both water molecular diffusion (true-diffusion) and microcirculation in the capillary network (pseudo-diffusion)1. However, the argument still remains in which method is appropriate to apply bi-exponential model to quantify these motions in the kidney2,3. Our purposes are to investigate 1) the variability of three methods for bi-exponential fitting and 2) whether the pseudo-diffusion generated in IVIM is useful to detect acute kidney injury (AKI) in rodents.Materials and Methods
Study I: All MRI sessions were conducted in a 7T experimental system (Agilent). On an anesthetized healthy normal mouse (C57BL/6, 12-week-old), a localizer scan was firstly performed to select a single 1.5-mm coronal slab delineating the both kidneys. On the selected imaging slab, a series of DW single shot echo-planar imaging (EPI) with 10 b-values (0, 50, 100, 200, 300, 400, 500, 600, 800 and 1000 s/mm2 in random order) was conducted 5 times within ~20 min. The other parameters were: TR/TE = 3000/38 ms, FOV = 32×32 mm; matrix size = 64×64, NEX = 1 and the motion probe gradients were applied concurrently on the three orthogonal directions. For the acquired 5 sets of diffusion data, we applied 3 methods for bi-exponential fitting via nonlinear regression algorithm: Method-I; using all 10 b-values, Method-II; using 6 b-values excluding the b-values near the inflection point, and Method-III; using all 10 b-values with a fixed true diffusion. To assess the appropriate fixed true diffusion, a mono-exponential fitting was applied to each diffusion data set with 3 to 10 highest b-values in turn. In all methods, the IVIM parameters were defined as follows: the true diffusion coefficient (D; ×10-3 mm2/s), pseudo-diffusion coefficient (D*; ×10-3 mm2/s) and pseudo-diffusion fraction (f; %); S(b)/S(0) = (1- f) × exp(-bD) + f × exp(-bD*), where S(0) and S(b) are the signal intensity (SI) without/with diffusion weighting.
Study II: Four rats (Sprague Dawley rat, 8-week-old) were subjected to the MRI session before (Pre) and 2 weeks after (Post) AKI which was induced by single intraperitoneal injection of cisplatin (10 mg/kg). After T2WI and DW EPI with similar imaging parameters in Study I, an arterial spin labeling (ASL) was performed to measure renal perfusion in the same slab using the flow-sensitive alternating inversion recovery (FAIR) technique4, 5 with 8 TIs (250 - 4000 ms). Single shot EPI was used for data acquisition with the following parameters: TR/TE = 10000/38 ms, FOV = 64×64 mm; matrix size = 64×64, NEX = 1. A selective inversion slice thickness was 6.5 mm. Data were averaged of 10 pairs of control and labeled images for each TI, and then a perfusion-weighted image was generated by subtraction in each pair. A T1 map was also acquired using an inversion recovery EPI. To calculate renal perfusion (mL/100 g/min), the perfusion-weighted signals at different TIs were fitted to the kinetic function by a nonlinear least-squares routine as reported6. The regions of interest (ROIs) were placed on entire renal cortex avoiding partial volume effect.
Results and Discussion
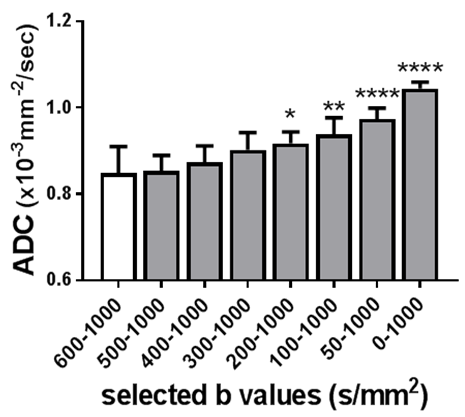
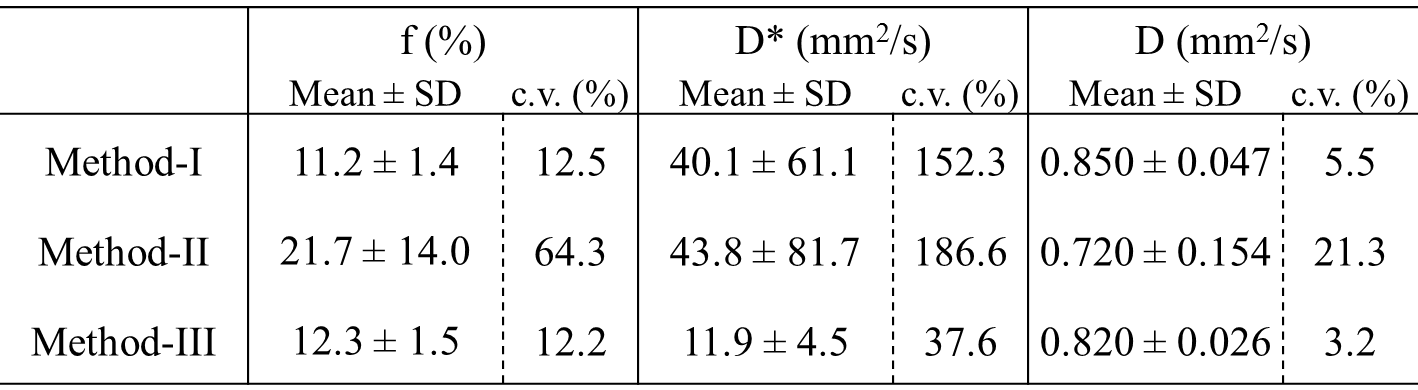
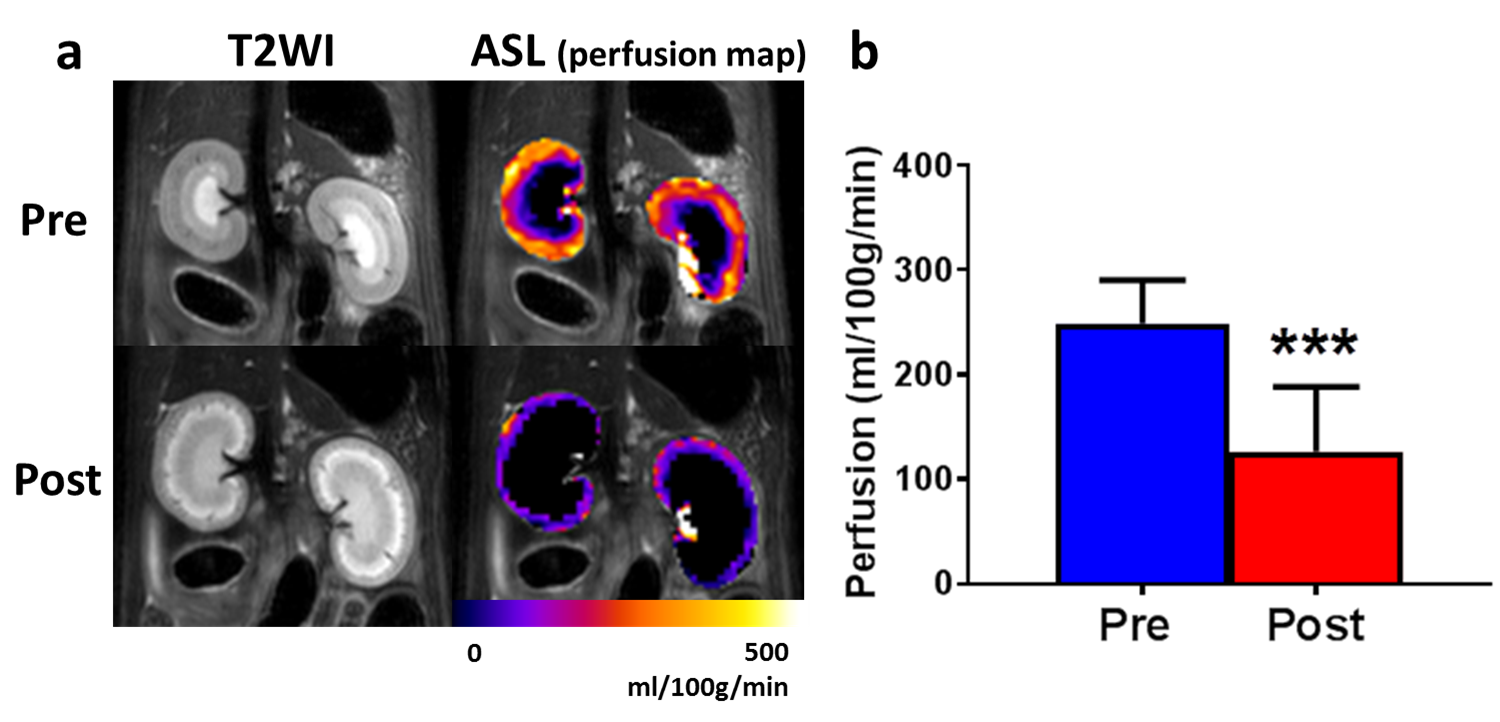
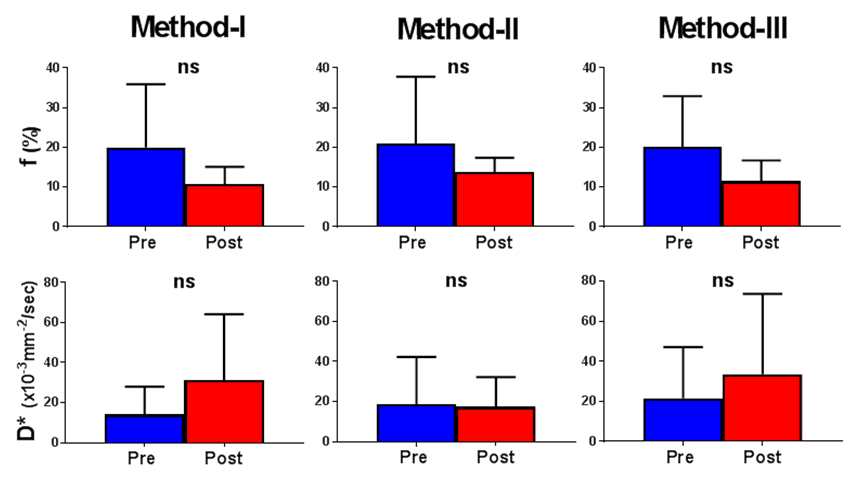
The calculated true diffusion in a mono-exponential fitting using the b-value (s/mm2) of higher than 600 tended to increase according as it was calculated using the next lower b-value in turn (Fig. 1). Since it became significantly higher when using b-values lower than 300, we used b-values of 400 and above for the appropriate fixed true diffusion (D) in the Method-III. In the bi-exponential analysis, the Method-III demonstrated the lowest variability (coefficients variation; c.v.) in all calculated IVIM parameters (Table 1). Further, the D and D* derived in the Methods-I and -II demonstrated a significant correlation (R2 = 0.43 and 0.31), implying that the D and D* might bias to calculate each other. For these reasons, we concluded the Method-III is the best. Figure 2a shows the typical T2WIs and perfusion maps before and after AKI induction. The renal perfusion measured in the ASL significantly reduced after AKI induction (Fig. 2b). On the other hand, the D, D* and f calculated in all 3 methods did not show any significant differences between Pre and Post (Fig. 3). Further, there were no correlation between the renal perfusion in the ASL and the f or D* in all 3 methods. The calculated fast component of diffusion in IVIM might reflect some perfusion but it was less reproducible and not sensitive enough to detect the pathologically reduced renal perfusion in a rat model of AKI.Acknowledgements
No acknowledgement found.References
1. Le Bihan D, Breton E, Lallemand D et al. Separation of diffusion and perfusion in intravoxel incoherent motion MR imaging. Radiology. 1988;168(2):497-505.
2. Rheinheimer S, Schneider F, Stieltjes B, et al. IVIM-DWI of transplanted kidneys: reduced diffusion and perfusion dependent on cold ischemia time. Eur J Radiol. 2012;81(9):e951-956.
3. Sigmund EE, Vivier PH, Sui D, Lamparello NA, et al. Intravoxel incoherent motion and diffusion-tensor imaging in renal tissue under hydration and furosemide flow challenges. Radiology. 2012;263(3):758-769
4. Kim SG. Quantification of relative cerebral blood flow change by flow-sensitive alternating inversion recovery (FAIR) technique: application to functional mapping. Magn Reson Med. 1995;34(3):293-301.
5. Kwong KK, Chesler DA, Weisskoff RM, et al. MR perfusion studies with T1-weighted echo planar imaging. Magn Reson Med. 1995;34(6):878-887.
6. Pell GS, Thomas DL, Lythgoe MF, et al. Implementation of quantitative FAIR perfusion imaging with a short repetition time in time-course studies. Magn Reson Med. 1999;41(4):829-840.
Figures