0865
Diffusion-weighted MRI and coherent flow in the kidney1Department of Diagnostic and Interventional Radiology, University Hospital of Würzburg, Würzburg, Germany
Synopsis
The IVIM model and typical DWI-evaluations assume flow in tissue to be incoherent. However, there is evidence that in some tissues flow might be coherent and thus, the DWI-signal might be influenced by the applied first gradient moment m1. A gradient scheme was implemented that allows applying different m1 for a constant b-value. Moreover, the IVIM model was extended to also include coherent flow in the modeling process of DWI data. It was found that flow in the human kidney is, at least in part, coherent and that the proposed model is able to fit that data very robustly.
Purpose
Using the Intravoxel Incoherent Motion (IVIM) model [1]
the impact of tissue perfusion can be taken into account for diffusion-weighted
imaging (DWI). However, IVIM assumes this flow to be incoherent, i.e. moving
spins change their direction of motion during flow encoding. Consequently, the
effect of flowing spins on the DWI signal is supposed to be independent from
the applied flow encoding m1 (or velocity encoding VENC=π/γm1).
Since here is evidence that coherent flow influences the signal of DWI
experiments and first studies showed coherent flow in the liver and the
pancreas [2], it was the aim of the present study to examine whether there is
coherent flow in the human kidneys and to find a model that describes DWI data
in the kidneys more precisely.Methods
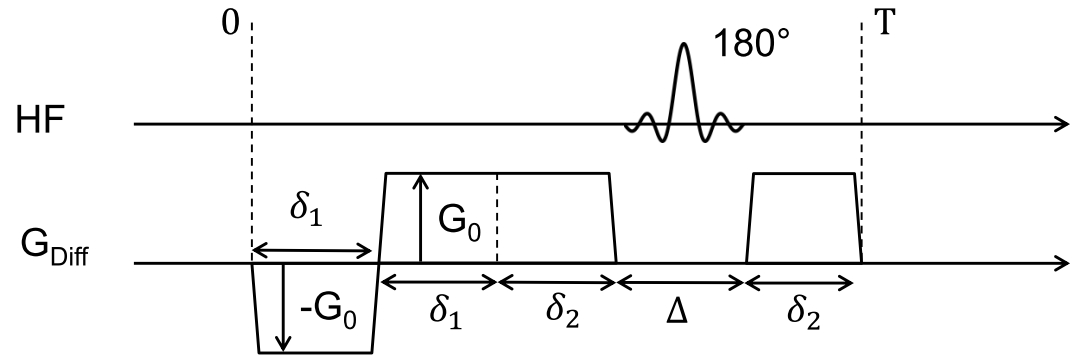
A gradient scheme was implemented that allows to change m1 while keeping the b-value constant (figure 1). This can be achieved via shortening of δ1 and prolongation of δ2 and vice versa. We extended the IVIM model to be able to distinguish between incoherent and coherent flow for high b-values (≥200 s/mm2):
$$S_{b,m_{1}} = S_{0}e^{-b{\underline{\underline{D}}}}[(1-f)-([\beta_{||}cos^{2}(\theta)+\beta_{\bot}sin^{2}(\theta]m_{1}^{2})$$
Sb,m1 is the signal at a certain b-value with a certain m1. D is the diffusion tensor from which the main direction of diffusion can be derived. f is the fraction of incoherent flow and ϴ the angle between the diffusion gradient and the main direction of diffusion. β|| and β⊥ represent the fraction of coherent flow parallel and orthogonal to the main direction of diffusion.
We examined the kidneys of eight healthy volunteers in coronary orientation (FOV 330x330mm2, Matrix 140x140, slice thickness 5mm, partial Fourier 6/8, TR 2700ms, TE 89ms, b-Values 0, 250 and 600s/mm2). Every b-value was acquired with 10 different m1, 2 averages and 20 directions. Values for m1 were equally distributed between flow compensated (m1=0) and maximal flow encoding (m1=m1,max; achieved at a VENC of 1.4s/mm2 (b=250s/mm2) and 0.9s/mm2 (b=600s/mm2)).
Results
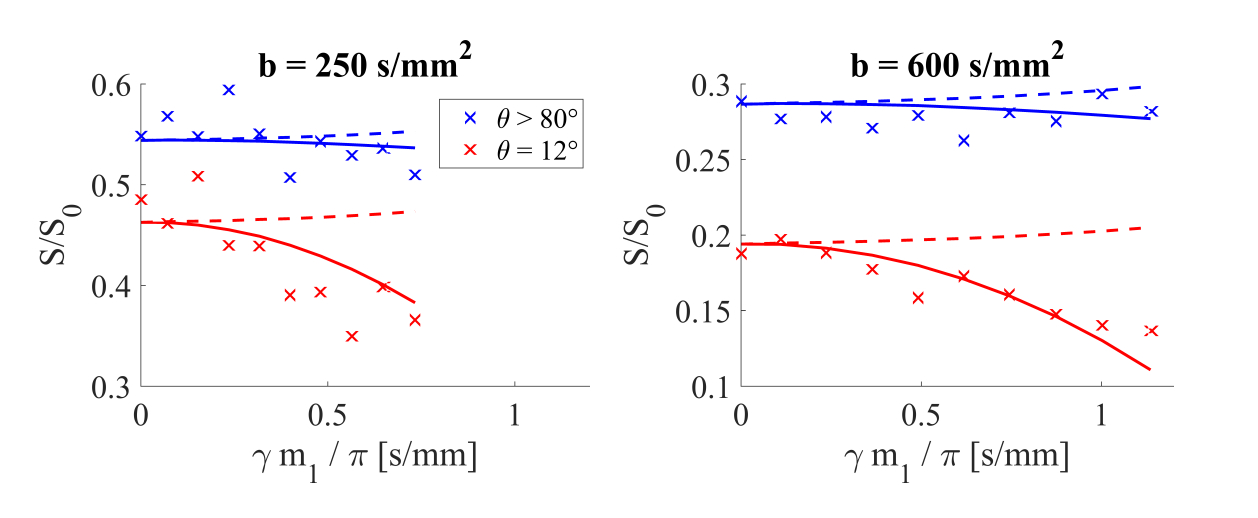
Figure 2 shows the data for ϴ>80° (orthogonal) and ϴ=12° (parallel) to the main diffusion direction of one voxel in the medulla. The signal decreased with increasing m1 when the diffusion gradient was almost parallel to the main diffusion direction (red crosses). However, this effect was not observed when the gradient was orthogonal to the main diffusion direction in the medulla (blue crosses). Solid lines represent the quadratic fit. Dashed lines represent the expected course when completely incoherent flow is assumed (β||=β⊥=0).
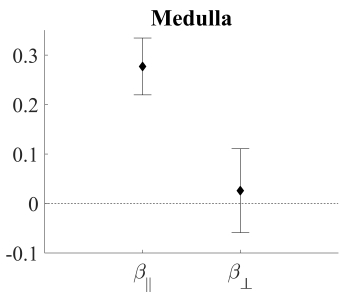
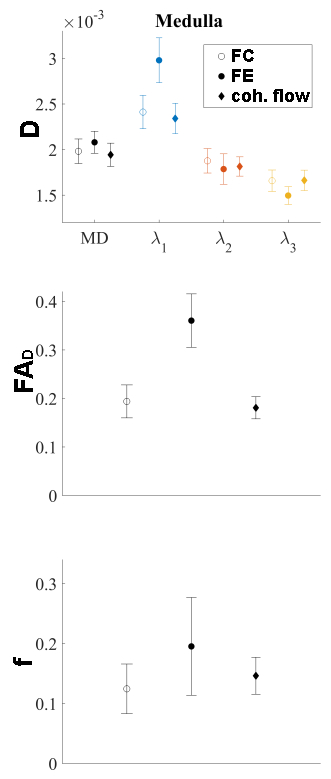
In figure 3 and 4 the data of all voxels in all volunteers is presented as mean ± SD. A fit of all acquired data (0≤m1≤m1,max, all gradient directions, all volunteers) to equation (1) resulted in a mean fraction of coherent flow parallel (β||) to the main direction of diffusion of 0.28 in the medulla (figure 3). However, the fraction of coherent flow orthogonal (β⊥) to the main diffusion direction did not differ significantly from zero. The resultant parameters of the diffusion tensor D (mean diffusion (MD) and three eigenvalues λ), the fractional anisotropy (FAD) and the incoherent perfusion fraction (f) of these fits are shown in figure 4 (coh. flow). These findings are compared to results of a fit to either only the flow compensated data (FC) or only the data from maximal flow encoding (FE) to an extended IVIM model (diffusion tensor D and a perfusion fraction f). Results from flow compensated measurements and the evaluation using the coherent flow model matched well, while the results from flow encoded measurements overestimate λ1, the fractional anisotropy and the perfusion fraction.
Discussion
Our results clearly show that the signal acquired in DWI experiments is dependent on the first gradient moment when coherent flow is present. Our proposed model to fit DWI data is able to fit the fractions of parallel and orthogonal coherent flow using differently flow encoded data. All our findings concerning coherent flow can be explained with the complex anatomy of the kidneys.Conclusion
From our study we can conclude that there is coherent flow in the human kidneys and thus one is well advised to control the effects of m1 in the sequence used to be able to perform reliable DWI evaluations. This can be done by measuring only with m1=0 via a modified gradient scheme or by applying an adequate model for evaluation.Acknowledgements
Grant sponsor: Siemens HealthcareReferences
[1] Le Bihan et al.,
Radiology, 168(2):497–505, 1988.
[2] Wetscherek et al.,
Magnetic Resonance in Medicine, 74(2):410–419, 2015.
Figures