0864
Intravoxel incoherent motion MR imaging for staging liver fibrosis and monitoring anti-fibrotic response to losartan: an experimental study in rat model1Radiology, Xinhua Hospital, Shanghai Jiao Tong University School of Medicine, Shanghai, People's Republic of China, 2MR Research China, GE Healthcare, Shanghai, China, Shanghai, People's Republic of China
Synopsis
To evaluate the feasibility of intravoxel incoherent motion (IVIM) MR imaging to stage liver fibrosis and its capability for monitoring anti-fibrotic response to treatment, we performed IVIM MR imaging for rats model induced by carbon tetrachloride and for rats treated with losartan. Our studies demonstrated that D* is helpful to stage early and moderate fibrosis, and f is beneficial to discriminate advanced liver fibrosis and cirrhosis. In losartan treated rats, D* and f showed statistical significance compared with CCl4 alone. We concluded that perfusion parameters derived from IVIM have potential to monitor fibrosis progression and evaluate anti-fibrosis response to treatment.
Purpose
To
evaluate the feasibility of intravoxel incoherent motion (IVIM) magnetic
resonance imaging (MRI) for noninvasively staging liver fibrosis and monitoring
its therapeutic response to losartan.
Methods
Forty-one rats were induced by carbon tetrachloride (CCl4) for 0, 2, 4, and 6 weeks. Among them, twenty-four rats were simultaneously treated with losartan for 4 and 6 weeks. IVIM diffusion weighted imaging was performed with 3.0T MRI unit by using thirteen b-values from 0 to 1000 sec/mm2. True diffusion coefficient (D), perfusion fraction (f), pseudodiffusion coefficient (D*), and apparent diffusion coefficient (ADC) at different time point were compared among individual fibrotic groups by analysis of variants and between anti-fibrotic and fibrotic group by student’s t test. The correlation between histological features (fibrosis, inflammation, steatosis, and hepatocellular ballooning) and each parameter was evaluated by Spearman’s ranked correlation, and diagnostic performance for staging liver fibrosis were determined by receiver operation curves (ROC) analysis.Results
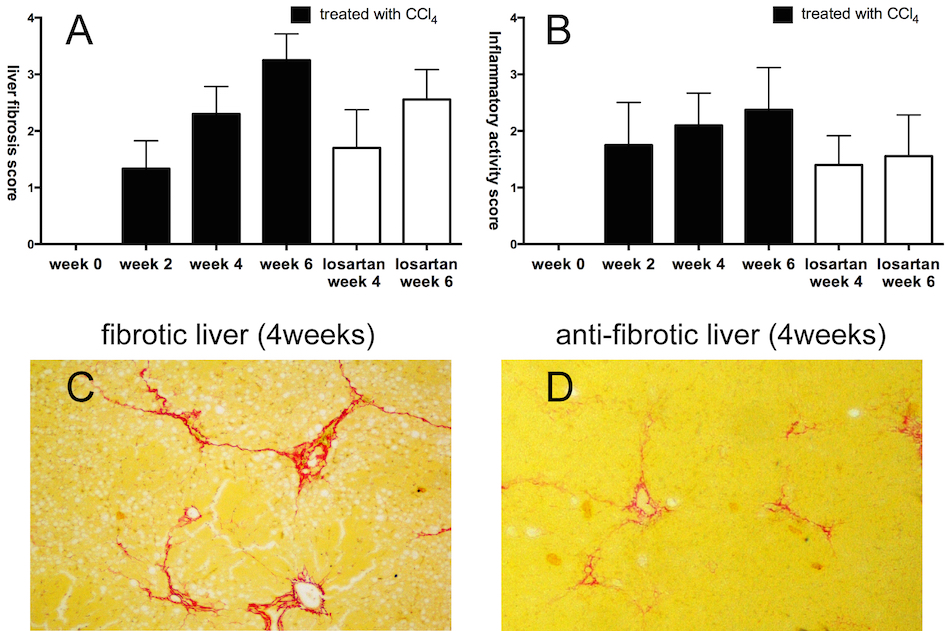
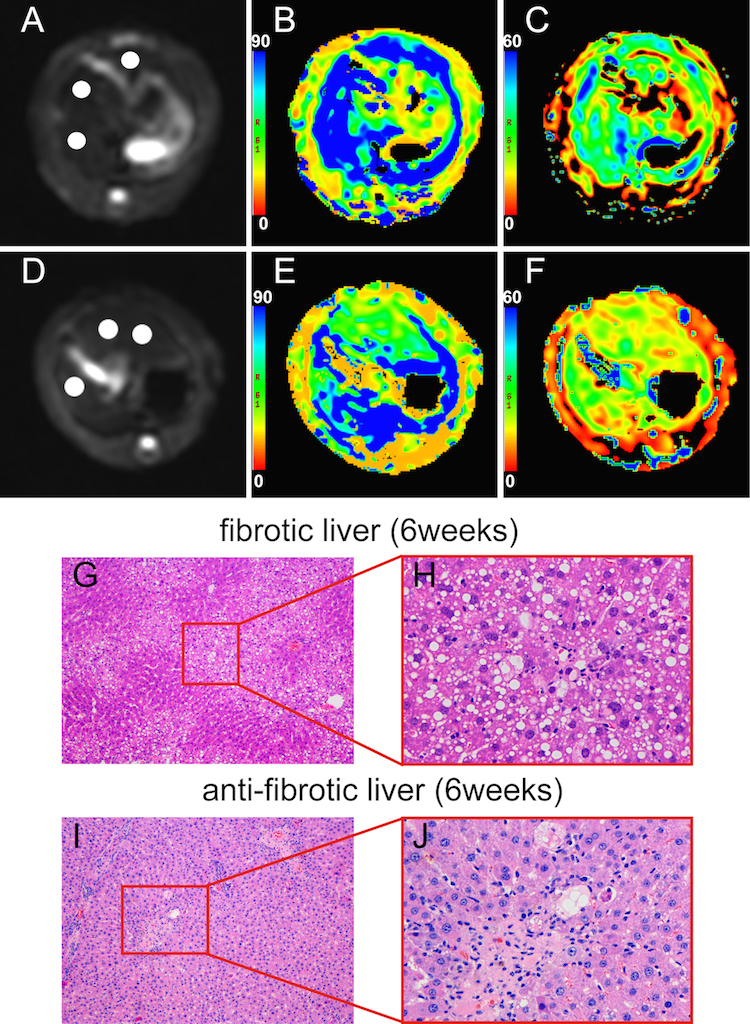
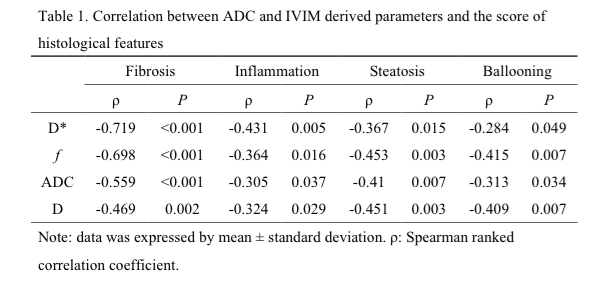
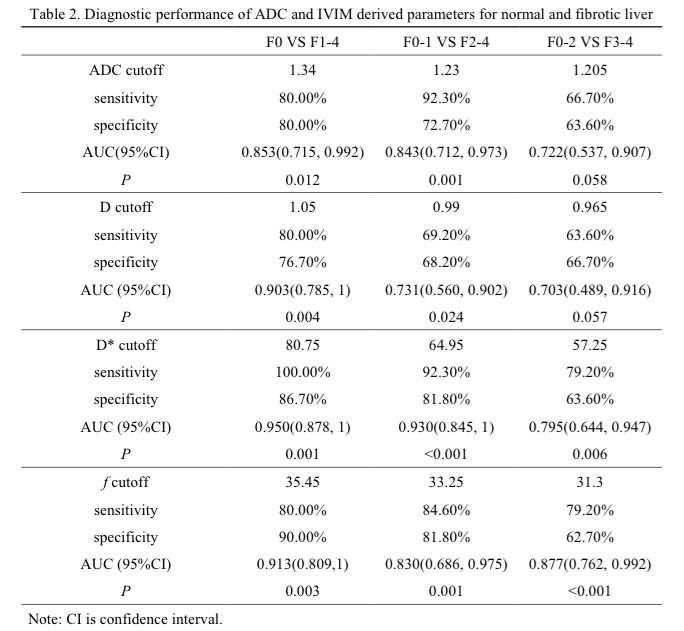
Although D*, f, ADC, and D were significant lower in fibrotic liver than normal liver, D*, f, and ADC showed moderate correlation with progression of liver fibrosis (ρ=-0.719, ρ=-0.698, ρ=-0.559, P<0.001) (Table 1). D* could be superior to detect the early and moderate liver fibrosis (AUC=0.950, 0.930, respectively). f might be beneficial to predict the presence of advanced liver fibrosis and cirrhosis (AUC=0.877)(Table 2). In losartan treated rats, D* and f showed statistical significance compared with CCl4 alone (P<0.05) (Figure 1 and 2).Discussion
Perfusion related parameters (D* and
f) in the rat model of liver fibrosis
were decreased along with its progression. It is worth noting that D* was more sensitive
than f in prediction of early and moderate stage of liver fibrosis. This
difference could be attribute to some factors. First, in concept of IVIM
theory, D* is related to the velocity of blood flow, and f represents the blood
volume 1. Second, as previous
study reported that hepatic artery was dilated to compensate the decreased
blood volume in the early stage of liver fibrosis, known as arterial buffer
effect 2. In other words, the
hepatic blood volume was maintained until late stage of liver fibrosis, whereas
blood flow may decrease in the early stage. In our study, f shows superior
diagnostic performance than D* to predict advanced stage of liver fibrosis and
cirrhosis. This could be explained by the fact that with the further
progression of liver fibrosis, the increase in hepatic artery blood flow is
insufficient to compensate the decreased blood volume, and eventually the
entire hepatic blood volume was significant decreased 3.
In our study, ADC and D show
significantly lower value in normal liver than in moderate liver fibrosis
(Stage 2) or advanced liver fibrosis and cirrhosis (Stage 3-4), but no
significant differences in ADC and D among individual liver fibrosis, but D*
shows significant decrease in early liver fibrosis in comparison with moderate
liver fibrosis or advance liver fibrosis. Note that D reflects pure water
molecular diffusion and its decrease during progression of liver fibrosis was
affected by excessive collagen deposition, intracellular fat droplets, and
hepatocellular ballooning which restricted the extracellular water diffusivity,
whereas necrosis and apoptosis affect D measurement in the opposite direction
and may result in the weak correlation between D and progression of liver
fibrosis. Therefore, the reduction in microcirculation perfusion is likely more
predominant pathophysiological change than restricted water diffusion in
progression of liver fibrosis, suggesting potential of D* as a sensitive
biomarker in staging liver fibrosis and monitoring anti-fibrotic response 4,5.
Our results showed that perfusion
related parameters (D* and f) could successfully allow to non-invasively
identify the regression of liver fibrosis in rats model treated with losartan.
After losartan treatment for both 4 and 6 weeks, D* and f showed statistical
difference in comparison with rats treated with CCl4 alone for the
corresponding time point. The alteration of microcirculation perfusion and
water diffusion after losartan treatment reveal by IVIM DW imaging can be
explained by histologic changes. The antifibrotic effect of losartan on liver
fibrosis model of rat induced by CCl4 was pathologically confirmed, the METAVIR
score was attenuated to 1.7±0.67 for week 4 rats and to 2.56±0.53 for week 6
rats, respectively. Similarly, losartan also reduced the inflammatory cells
infiltration and the grade of steatosis and hepatocellular ballooning6. However, ADC does not show statistical
significance in rats treated with and without losartan for 6 weeks, indicating
that ADC is likely less sensitive than D* and f in detecting antifibrotic efficacy.
Conclsion
Perfusion related parameters derived from IVIM show potential to non-invasively stage liver fibrosis and assess antifibrotic response to losartan.Acknowledgements
No acknowledgement found.References
1.Le Bihan, D. & Turner, R. The capillary network: a link between IVIM and classical perfusion. Magnetic resonance in medicine : official journal of the Society of Magnetic Resonance in Medicine / Society of Magnetic Resonance in Medicine 27, 171-178 (1992).
2. Lautt, W. W. Hepatic Circulation in Health and Disease. P203–226 (Raven Press, 1981).
3. Richter, S., Mucke, I., Menger, M. D. & Vollmar, B. Impact of intrinsic blood flow regulation in cirrhosis: maintenance of hepatic arterial buffer response. American journal of physiology. Gastrointestinal and liver physiology 279, G454-462 (2000).
4. Yoon, J. H. et al. Evaluation of hepatic fibrosis using intravoxel incoherent motion in diffusion-weighted liver MRI. Journal of computer assisted tomography 38, 110-116, doi:10.1097/RCT.0b013e3182a589be (2014).
5. Chow, A. M. et al. Liver fibrosis: an intravoxel incoherent motion (IVIM) study. Journal of magnetic resonance imaging : JMRI 36, 159-167, doi:10.1002/jmri.23607 (2012).
6. Croquet, V. et al. Hemodynamic and antifibrotic effects of losartan in rats with liver fibrosis and/or portal hypertension. Journal of hepatology 37, 773-780 (2002).
Figures