0863
In vivo imaging of mean cell size and density of human breast tumors1Institute of Imaging Science, Vanderbilt University, Nashville, TN, United States, 2Department of Radiology and Radiological Sciences, Vanderbilt University, Nashville, TN, United States, 3Department of Radiation Onology, Vanderbilt University, Nashville, TN, United States
Synopsis
We report a new MRI method termed IMPULSED (Imaging Microstructural Parameters Using Limited Spectrally Edited Diffusion) to quantitatively characterize mean cell size and density in solid tumors simultaneously and the first application of this method in breast cancer patients.
Purpose
Diffusion MRI has previously been used to evaluate tumor status and assess tumor early therapeutic response prior to measurable tumor volume changes. The apparent diffusion coefficient (ADC) is usually inversely correlated with tumor cellularity. However, variations in ADC may be influenced by multiple factors and the interpretation of imaging results is often unclear. Here we describe how the MRI diffusion method termed IMPULSED (Imaging Microstructural Parameters Using Limited Spectrally Edited Diffusion) may be used to quantitatively characterize mean cell size and density in solid tumors simultaneously, and report the first application of this method in breast cancer patients.Methods
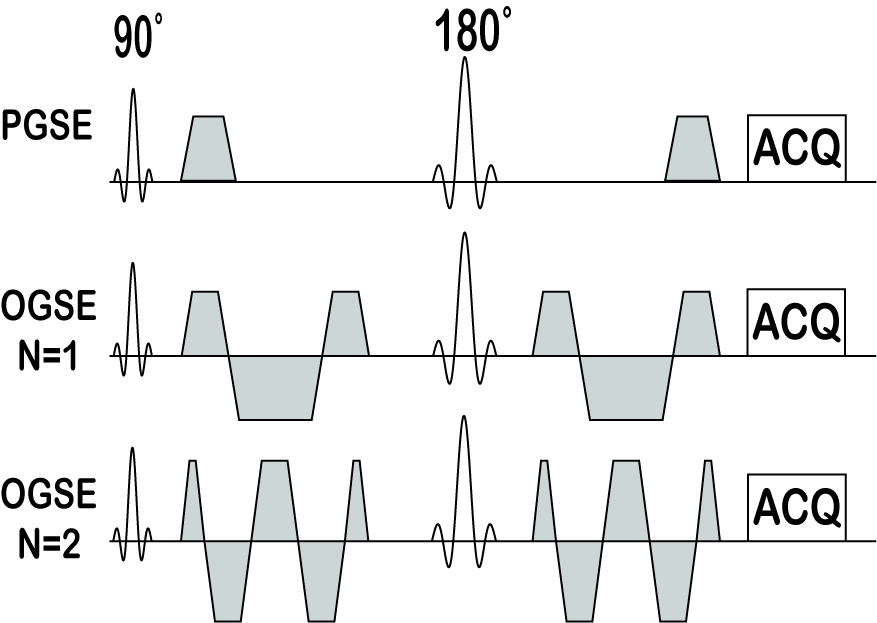
Theory: Fig. 1 shows the pulse sequences used to acquire diffusion data over a range of length scales. In addition to conventional pulsed gradient spin echo (PGSE) acquisitions for probing long length scales, the IMPULSED method also uses oscillating gradient spin echo (OGSE) acquisitions to sample short length scales. This combination enables detection and separation of restricted diffusion effects from sub- to supra-cellular length scales, providing more comprehensive information on tissue microstructure than single measurements of ADC. The diffusion weighted signals are modeled as S=vinSin+(1-vin)Sex, where vin is the water volume fraction of intracellular space, and Sin and Sex are the signal magnitudes per volume from the intra- and extracellular spaces, respectively. We have derived and validated analytical expressions of Sin by assuming spherical cancer cells, and the extracellular hindered diffusion coefficient Dex= $$$ \sqrt{1-v_{in}} $$$ Din for long diffusion times and randomly packed spherical cells [1]. All signals were fit to analytical equations pixel wise [2], so that parametric maps of mean cell size d, cell density ρ, and intracellular diffusion coefficient Din of tumors could be obtained.
Human imaging: IMPULSED imaging was performed on breast cancer patients prior to surgery using a Philips Achieva 3T scanner with a 16-channel breast coil. TR/TE=4000/103ms; FOV=192×192mm; reconstructed in-plane resolution = 1.3×1.3 mm; 10 slices; slice thickness=5 mm; NEX=4; single shot EPI; SENSE factor=3; fat suppression with SPAIR and other imaging parameters are provided in Table 1. Note that the maximum gradient strength used was < 60 mT/m, which is available on most clinical scanners. The total scan time ≈ 5 mins. In addition, ADC measurements using PGSE acquisitions with Δ = 50 and 30 ms were performed to further investigate the ADC dependence on diffusion times.
Results
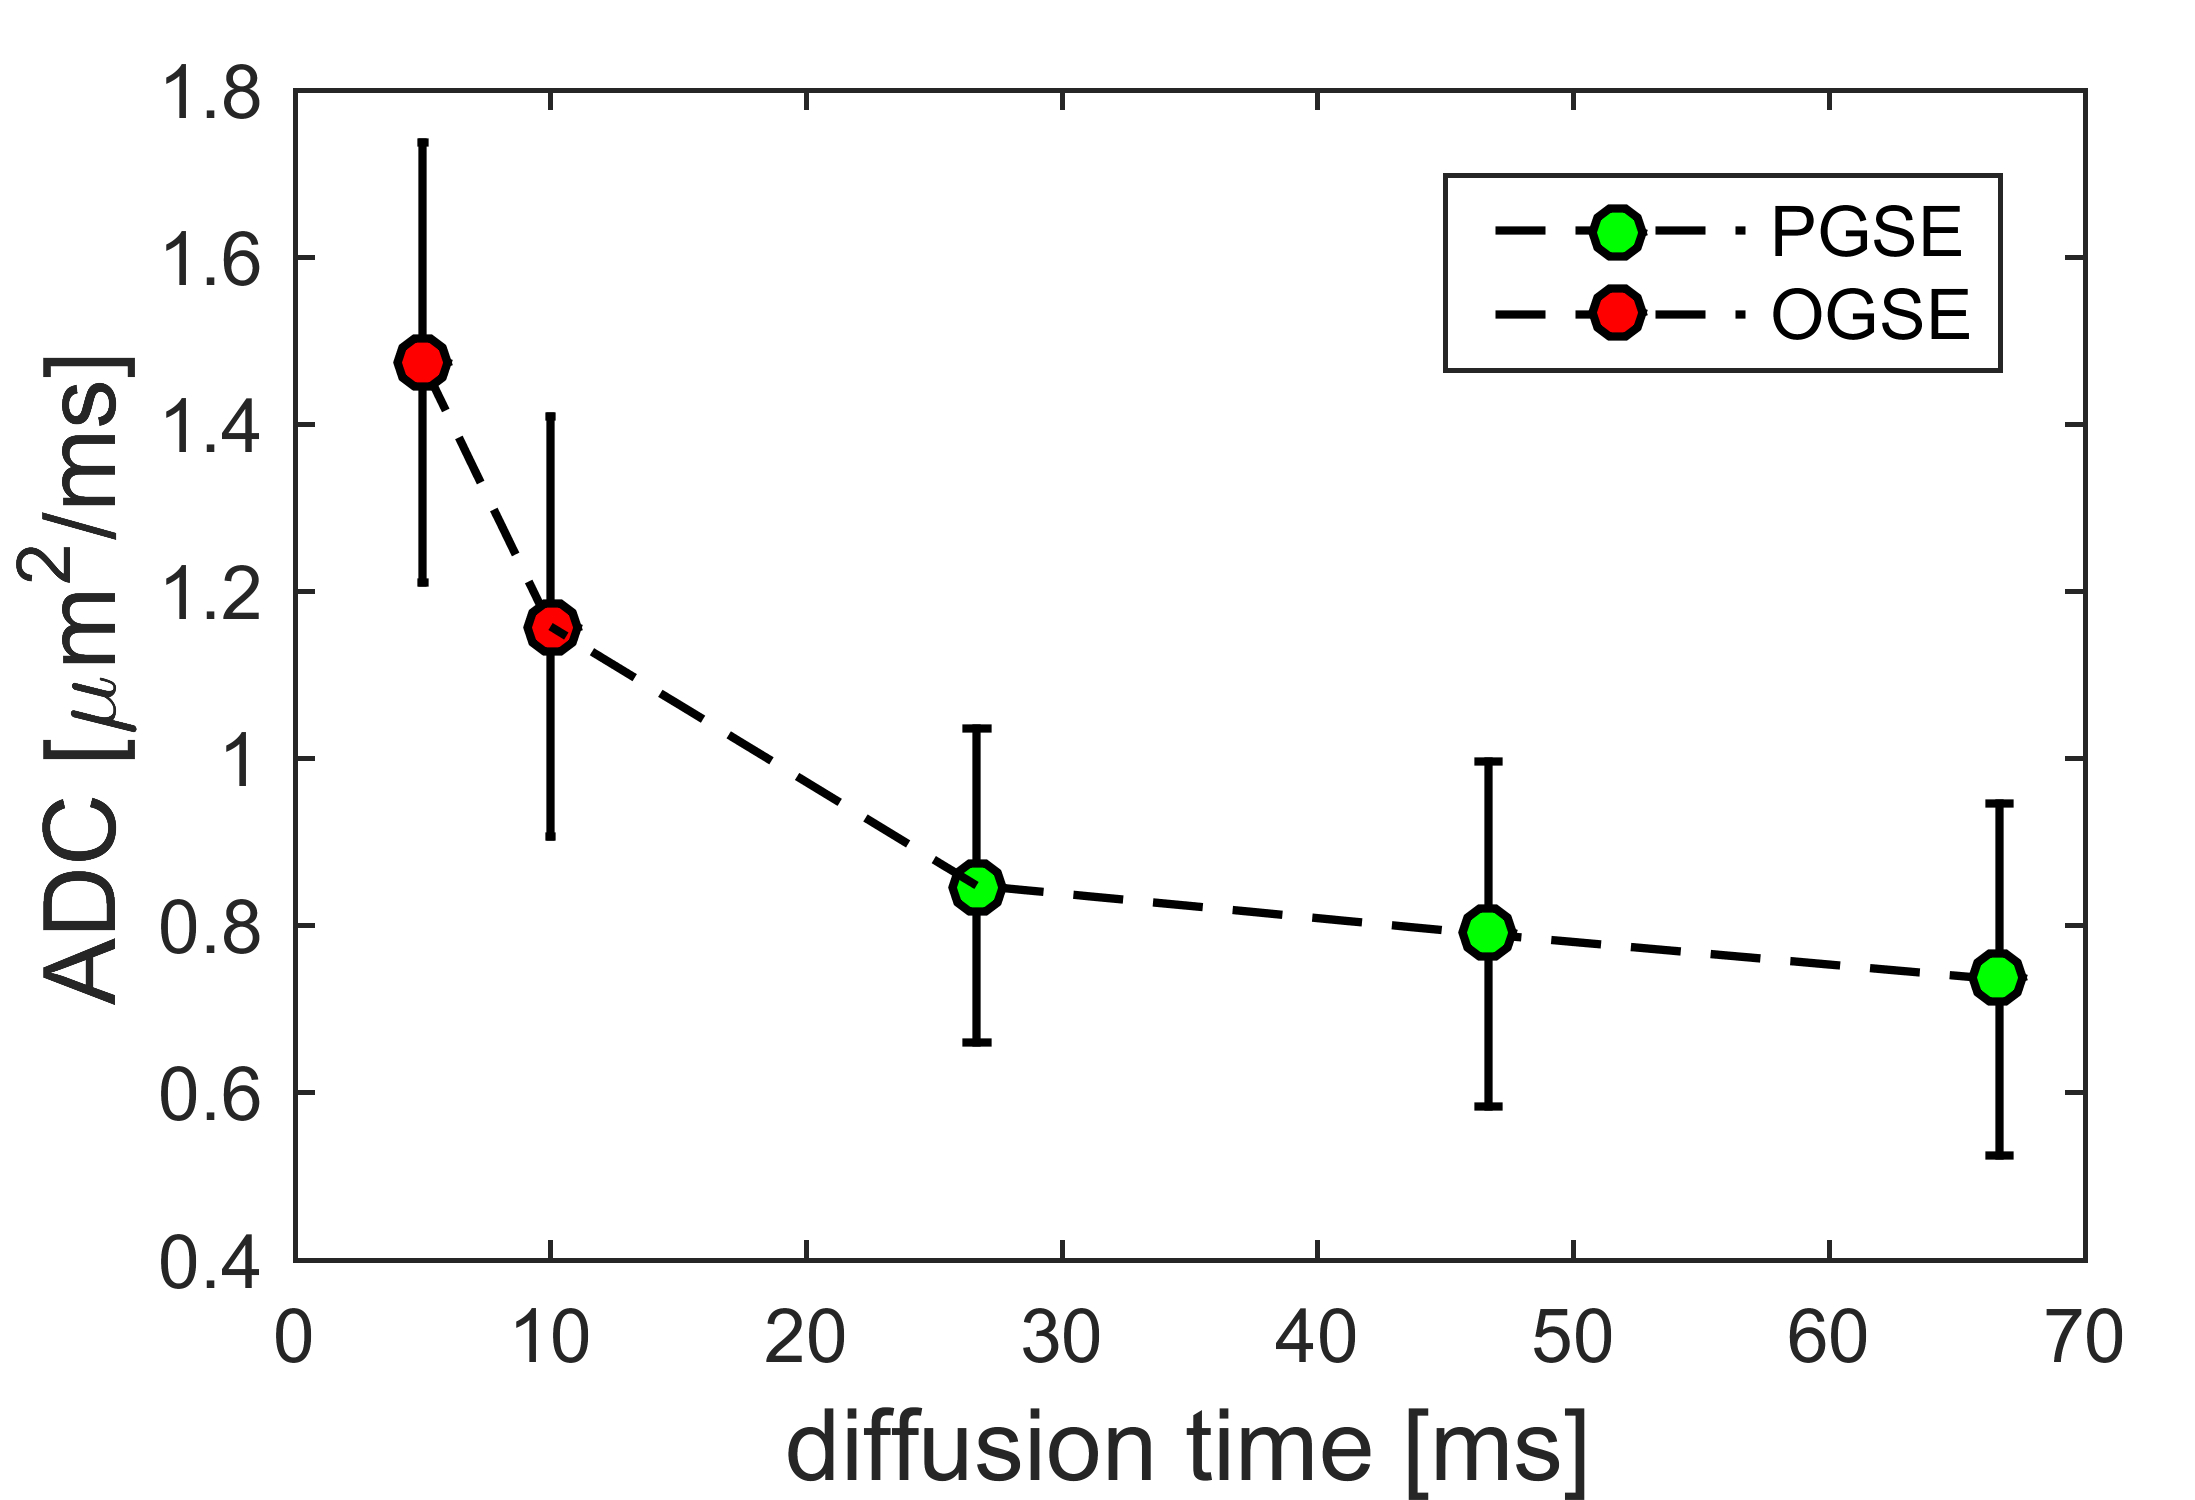
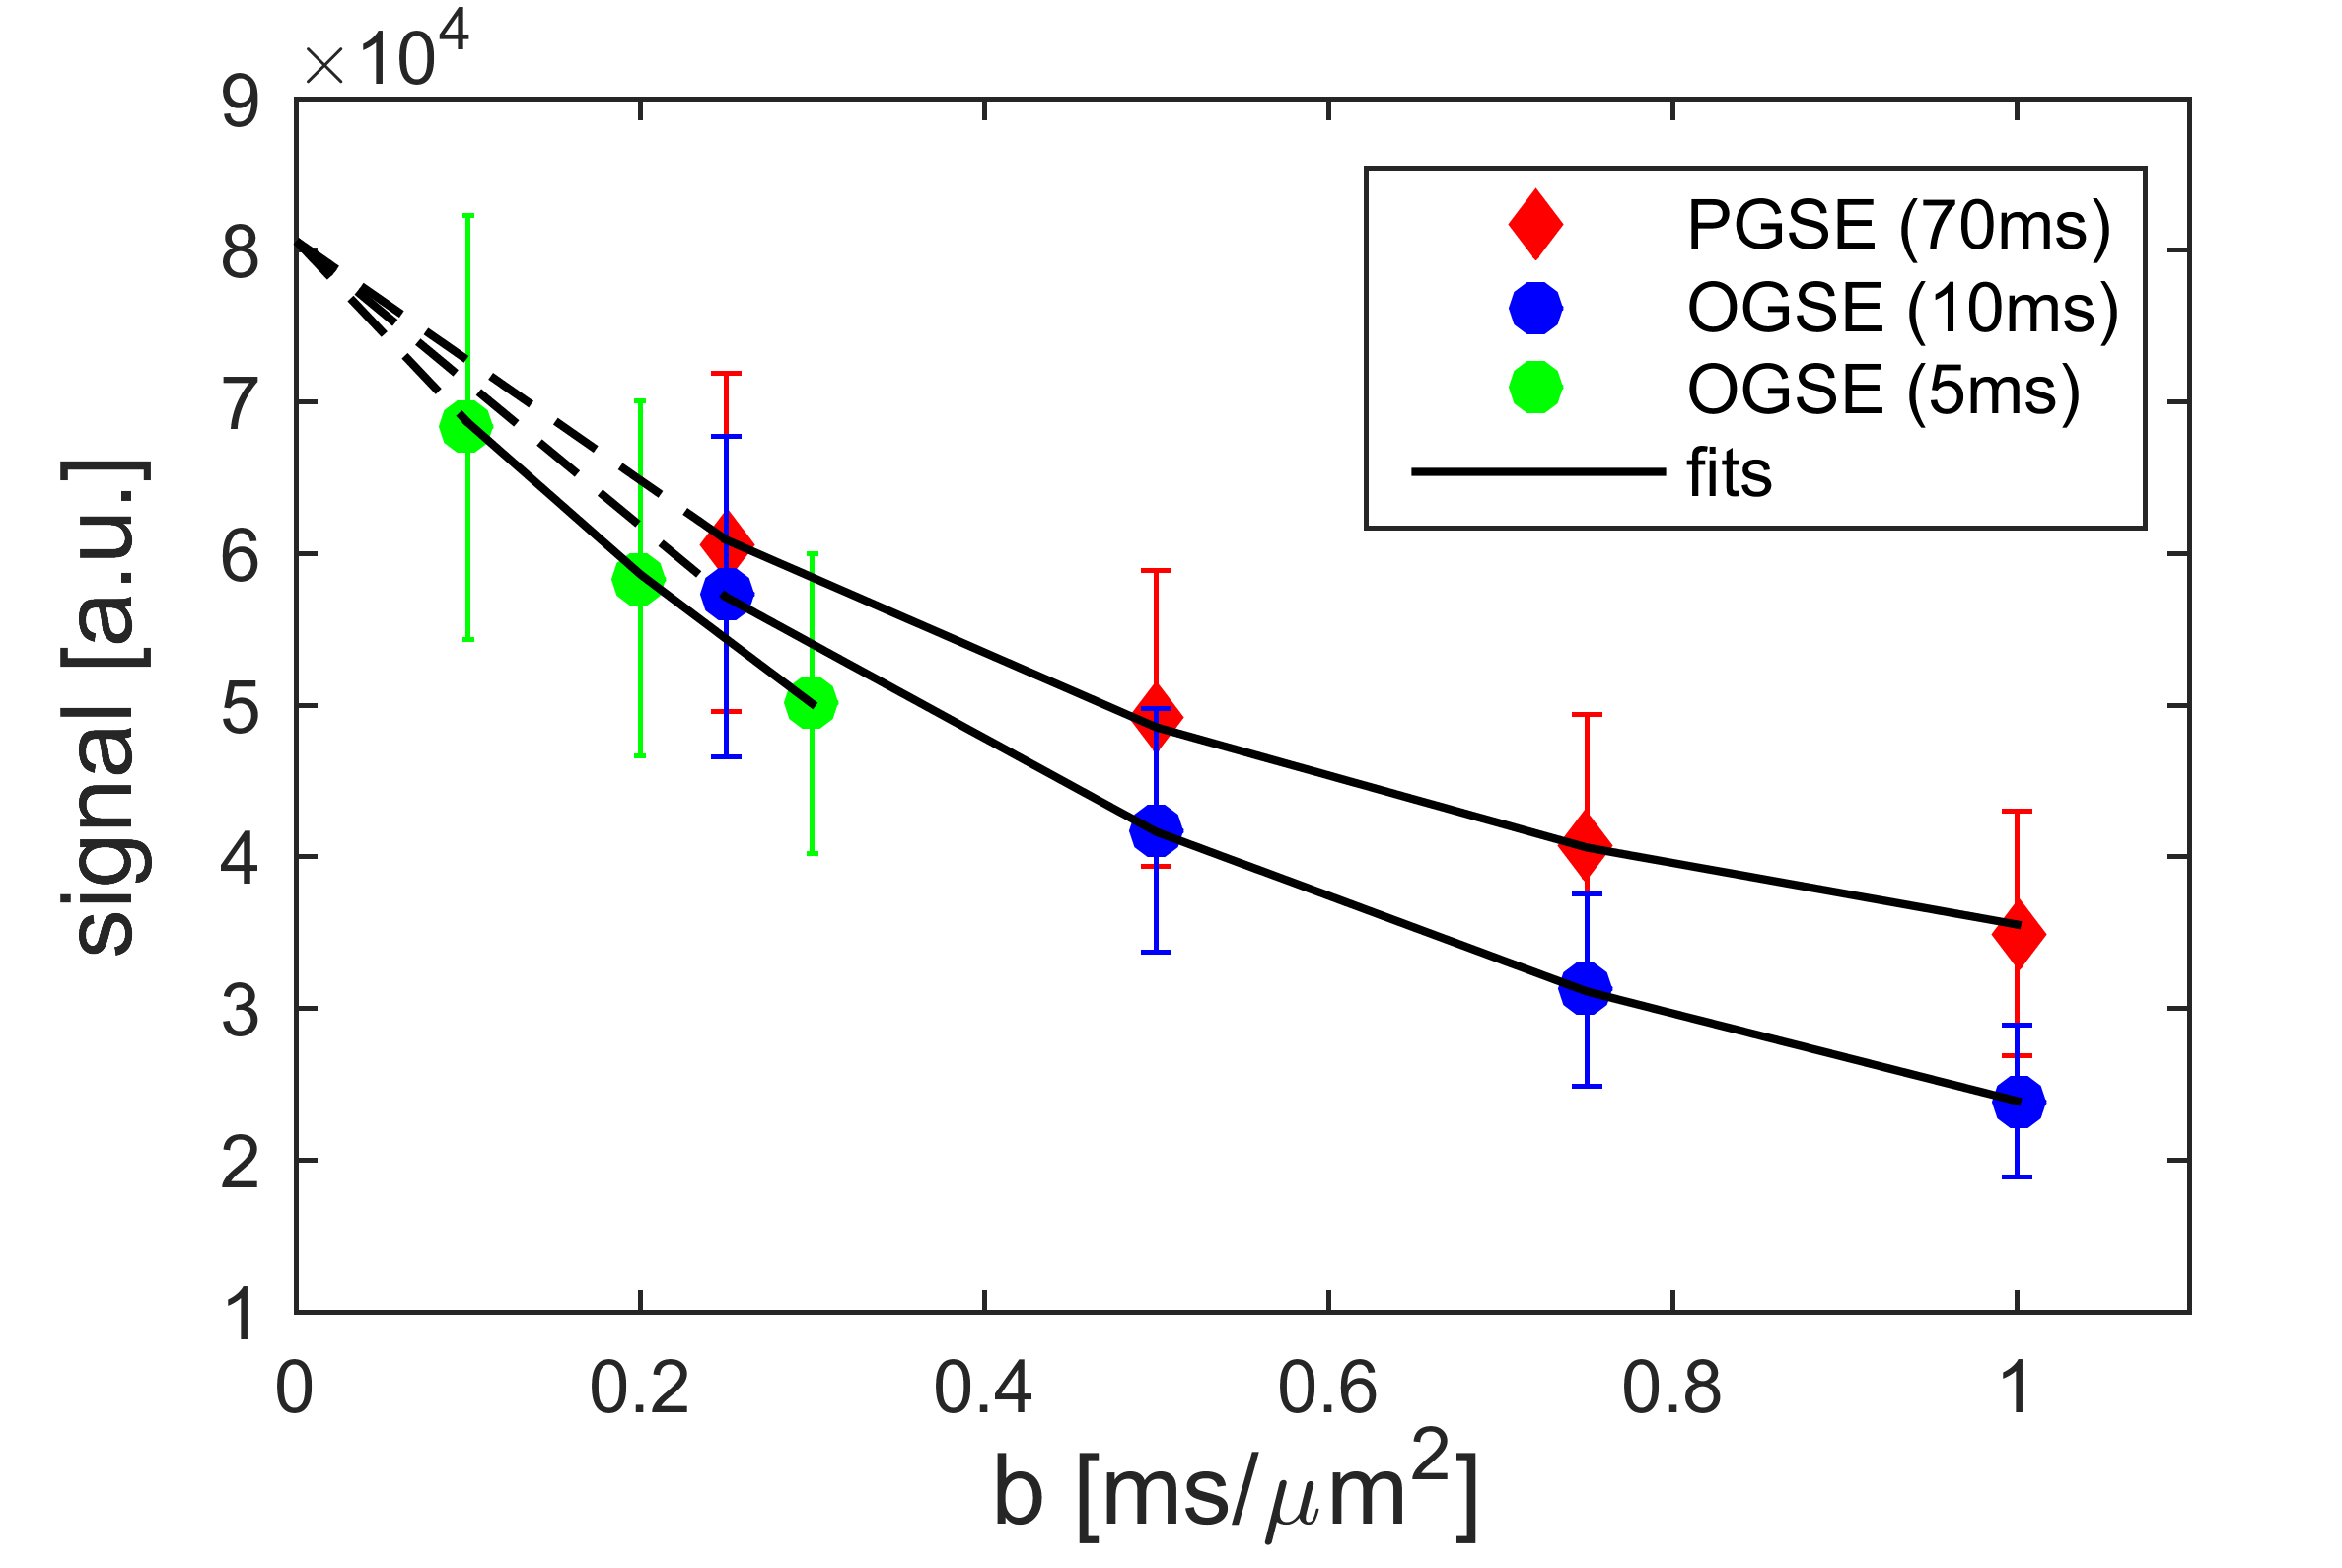
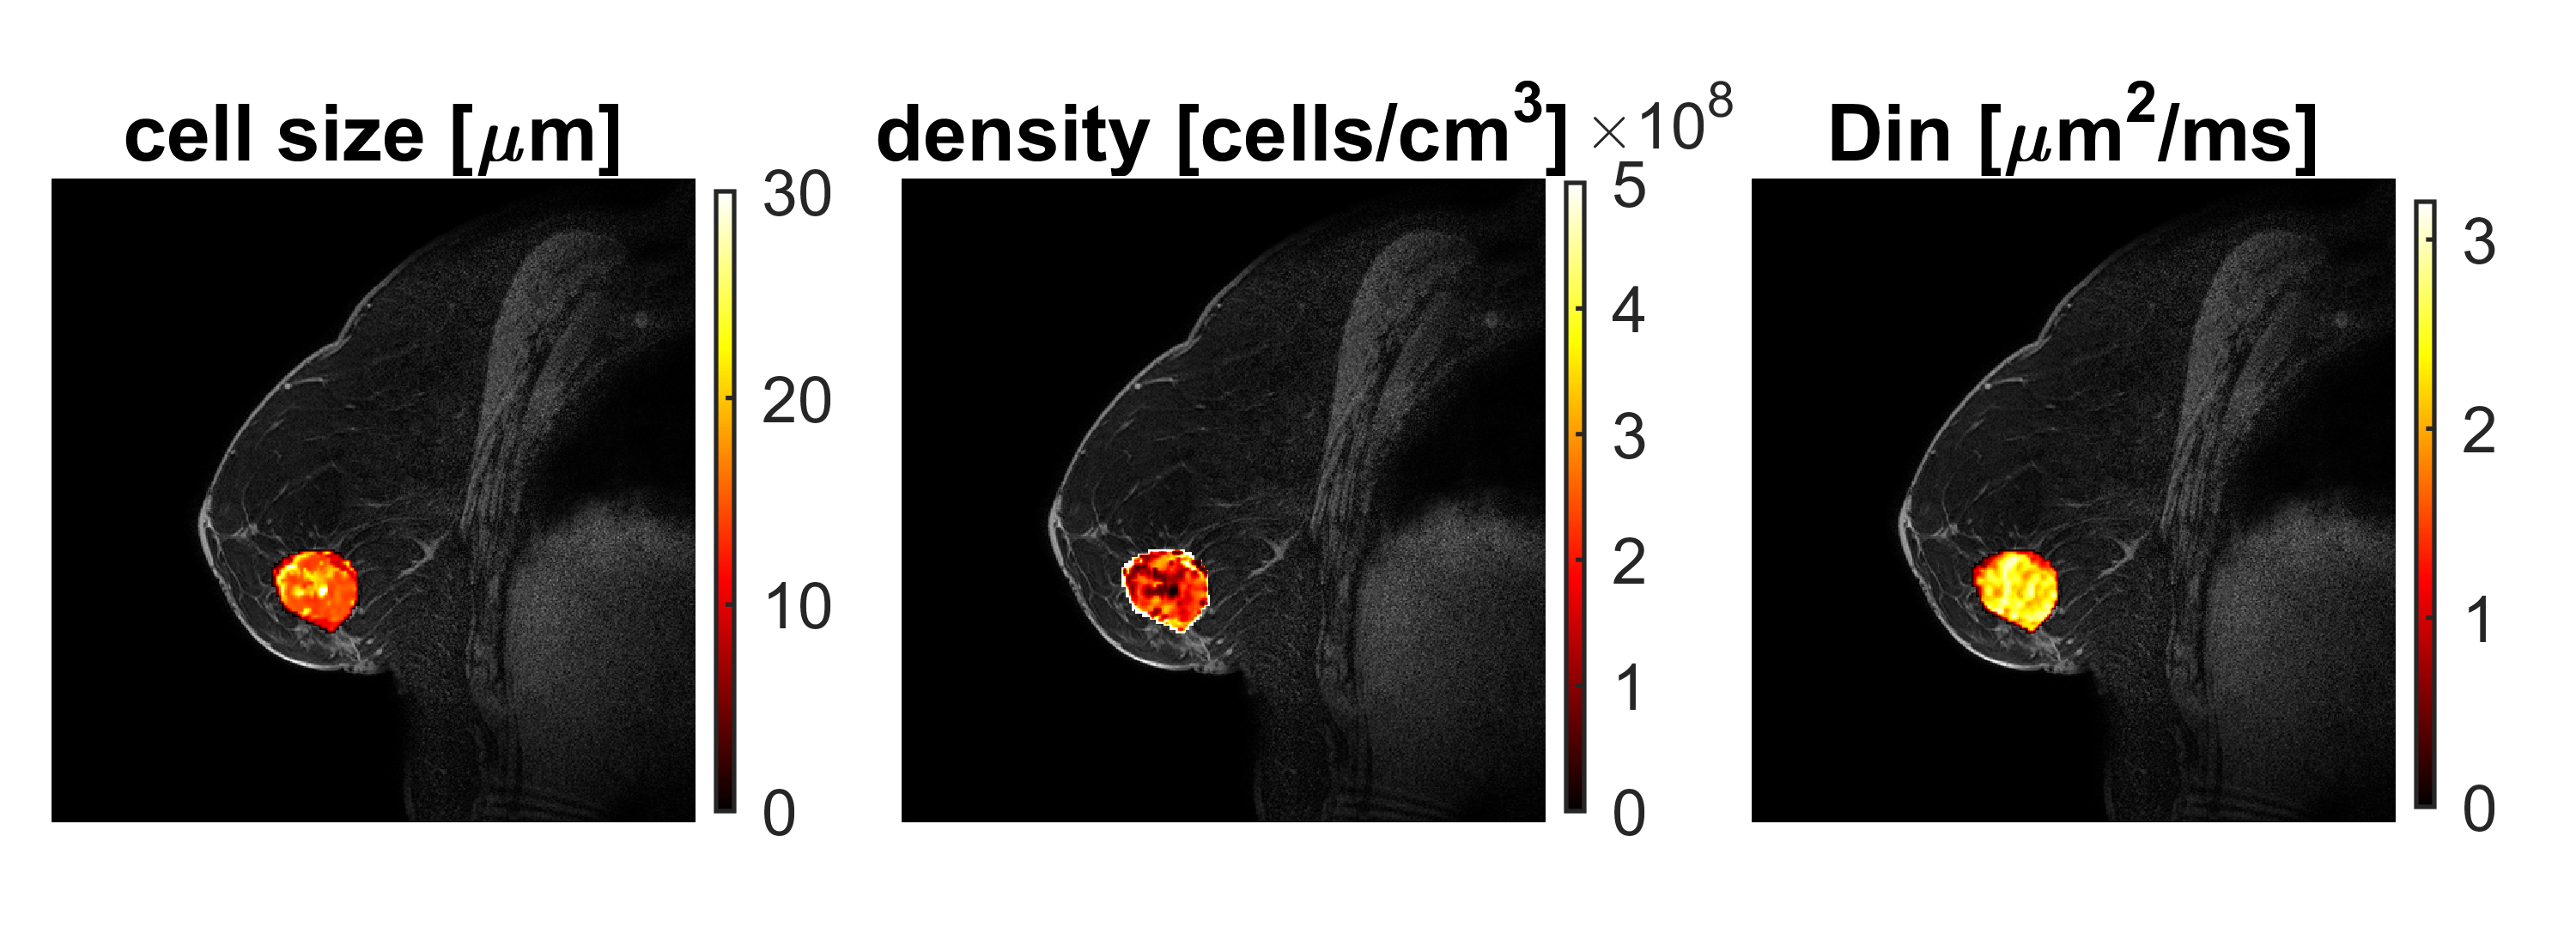
Fig. 2 shows the dependence of ADC of breast tumors on diffusion times. It is evident that ADC increases with decreasing diffusion time under 10 ms, but ADC does not vary significantly in the Δ range of 30 to 70 ms. This suggests that PGSE measurements with long diffusion times cannot distinguish structural differences at small scale, while OGSE measurements with shorter diffusion times are sensitive to the specific sizes of restricting distances (i.e., cell size). Therefore, only PGSE measurements with Δ = 70 ms were used in the fitting. Fig. 3 shows tumor ROI-based IMPULSED signals (markers) and fits (solid lines). Note b = 0 was excluded (dash lines) from data fittings to avoid possible IVIM effects. The fitted overall averaged cell size = 15.32 ± 3.01 μm and cell density = 2.52 ± 1.04 × 10⁸ cells/cm3, consistent with previous reports of ~108 cells/cm3 for tumors of epithelial origin (such as breast tumors) [3]. Fig. 4 shows an example of IMPULSED-derived parametric maps of cancer cell size, density, and intracellular diffusion coefficient of a human breast tumor overlaid on a high resolution anatomical image. Note the significant inhomogeneity of IMPULSED-derived metrics within the tumor. All the values of cell sizes and densities are within reasonable ranges. Histological validation is currently under development.Conclusion
A novel and fast IMPULSED imaging method has been successfully developed on clinical MRI scanners for in vivo imaging of cell size and density of solid tumors in breast cancer patients. To the best of our knowledge, this is the first clinical study that uses a non-invasive imaging method for spatially mapping distributions of cancer cell size and density of heterogeneous human breast tumors in vivo.Acknowledgements
NIH R01CA109106, R01CA173593, and K25CA168936 for funding.References
[1] A. Szafer, J. Zhong, J.C. Gore, Theoretical model for water diffusion in tissues, Magn Reson Med, 33 (1995) 697-712.
[2] X. Jiang, H. Li, J. Xie, E.T. McKinley, P. Zhao, J.C. Gore, J. Xu, In vivo imaging of cancer cell size and cellularity using temporal diffusion spectroscopy, Magn Reson Med, (2016).
[3] U. Del Monte, Does the cell number 10(9) still really fit one gram of tumor tissue?, Cell Cycle, 8 (2009) 505-506.
[4] A.T. Van, S.J. Holdsworth, R. Bammer, In vivo investigation of restricted diffusion in the human brain with optimized oscillating diffusion gradient encoding, Magn Reson Med, 71 (2014) 83-94.
Figures