0862
Analysis of abdominal movement with Phase Optical Flow: Application to Diffusion imaging.1Laboratories of Image, Signal processing and Acoustics, ULB, Brussels, Belgium, 2MRI Clinics&Radiology, Hôpital Erasme, Brussels, Belgium
Synopsis
We present a new method, the Phase Optical Flow, which provides an automatic determination of abdominal regional movements along the cardiac cycle and allows a real time determination of the optimal cardiac trigger time to be used in quantitative liver DWI. A phase based motion amplification was applied to real-time BTFE images acquired at 20 images/s. Then optical flow was used to derive the velocity vector field. The optimal cardiac time window was defined as the 100ms-period with minimal absolute vertical velocity. Validation was provided by liver DWI obtained at several cardiac trigger times.
Purpose
Diffusion-weighted imaging (DWI) is widely used to quantify the apparent diffusion coefficient (ADC) in the liver. Nonetheless severe signal losses are observed in the left lobe DWI due to the propagation of a mechanical wave arising from the heart movement. A previous study suggested the existence of an optimal cardiac time window minimizing signal voids in cardiac-triggered liver DWI, corresponding to the cardiac phase with the lowest absolute velocity of the left liver lobe1. However this timing might not be ideal for all liver regions or for other abdominal organs. Here, we develop a new method, the Phase Optical Flow, similar to the recently proposed amplified-MRI2, however based on phase motion amplification3 followed by a dense optical flow algorithm aiming at the automatic determination of organ movement patterns along the cardiac cycle.METHODS
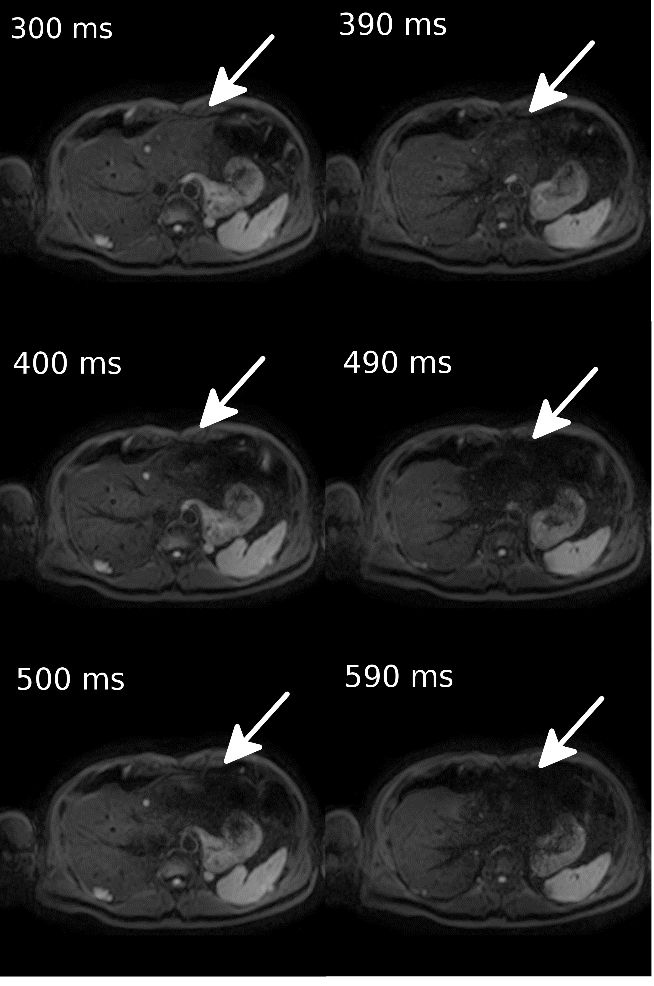
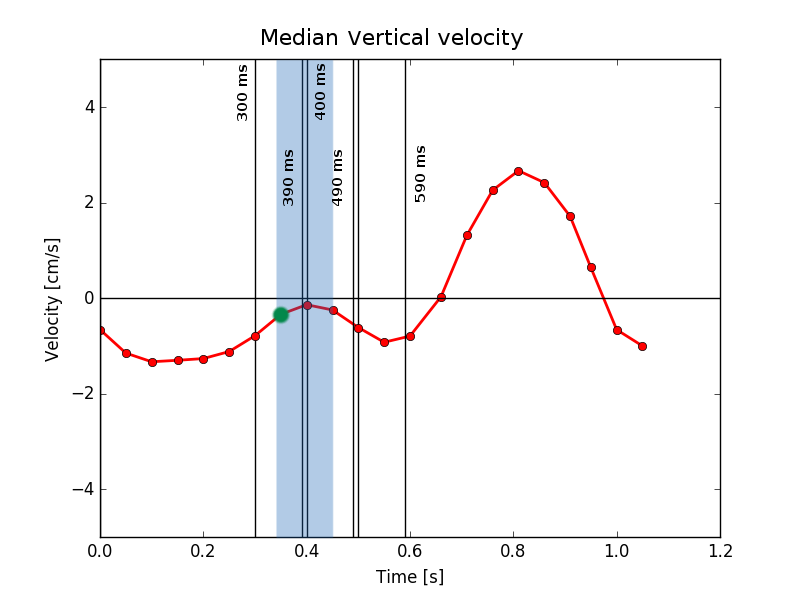
After Institutional Review Board approval and written informed consent, seven healthy volunteers underwent 3T MR imaging (Ingenia, Philips) of a single slice real time dynamic series with a temporal resolution of 20 images/s (16-seconds breath-hold BalancedTurboFieldEcho (BTFE) acquired in the coronal orientation,TR/TE/angle/FOV/Matrix/Sense factor: 2.3/1.08/40°/392/108/5.6). Concomitantly a PPU signal was recorded. Additionally, PPU cardiac-triggered DWI (b:0,500 s/mm2) axial sections were acquired after six PPU delays: 300,390,400,490,500 and 590 ms (Fig 1). A phase based motion amplification was applied to the BTFE images to increase small movements by a factor of three, with a pass band around the cardiac frequency (0.5 – 3 Hz). The method consisted in decomposing a video sequence into complex steerable pyramids frame by frame. The temporal phase variation in this space is correlated to movements that are amplified around the frequency pass band, followed by a reconstruction step. For each voxel, horizontal and vertical velocities were measured with a dense optical flow method applied on the amplified images. At each time point a median velocity vector (averaged over 15 cardiac cycles) was extracted in a ROI located in the left liver lobe. The best timing period was determined by selecting a continuous period of 100 ms during which the absolute vertical velocity is close to zero (Fig 2).RESULTS
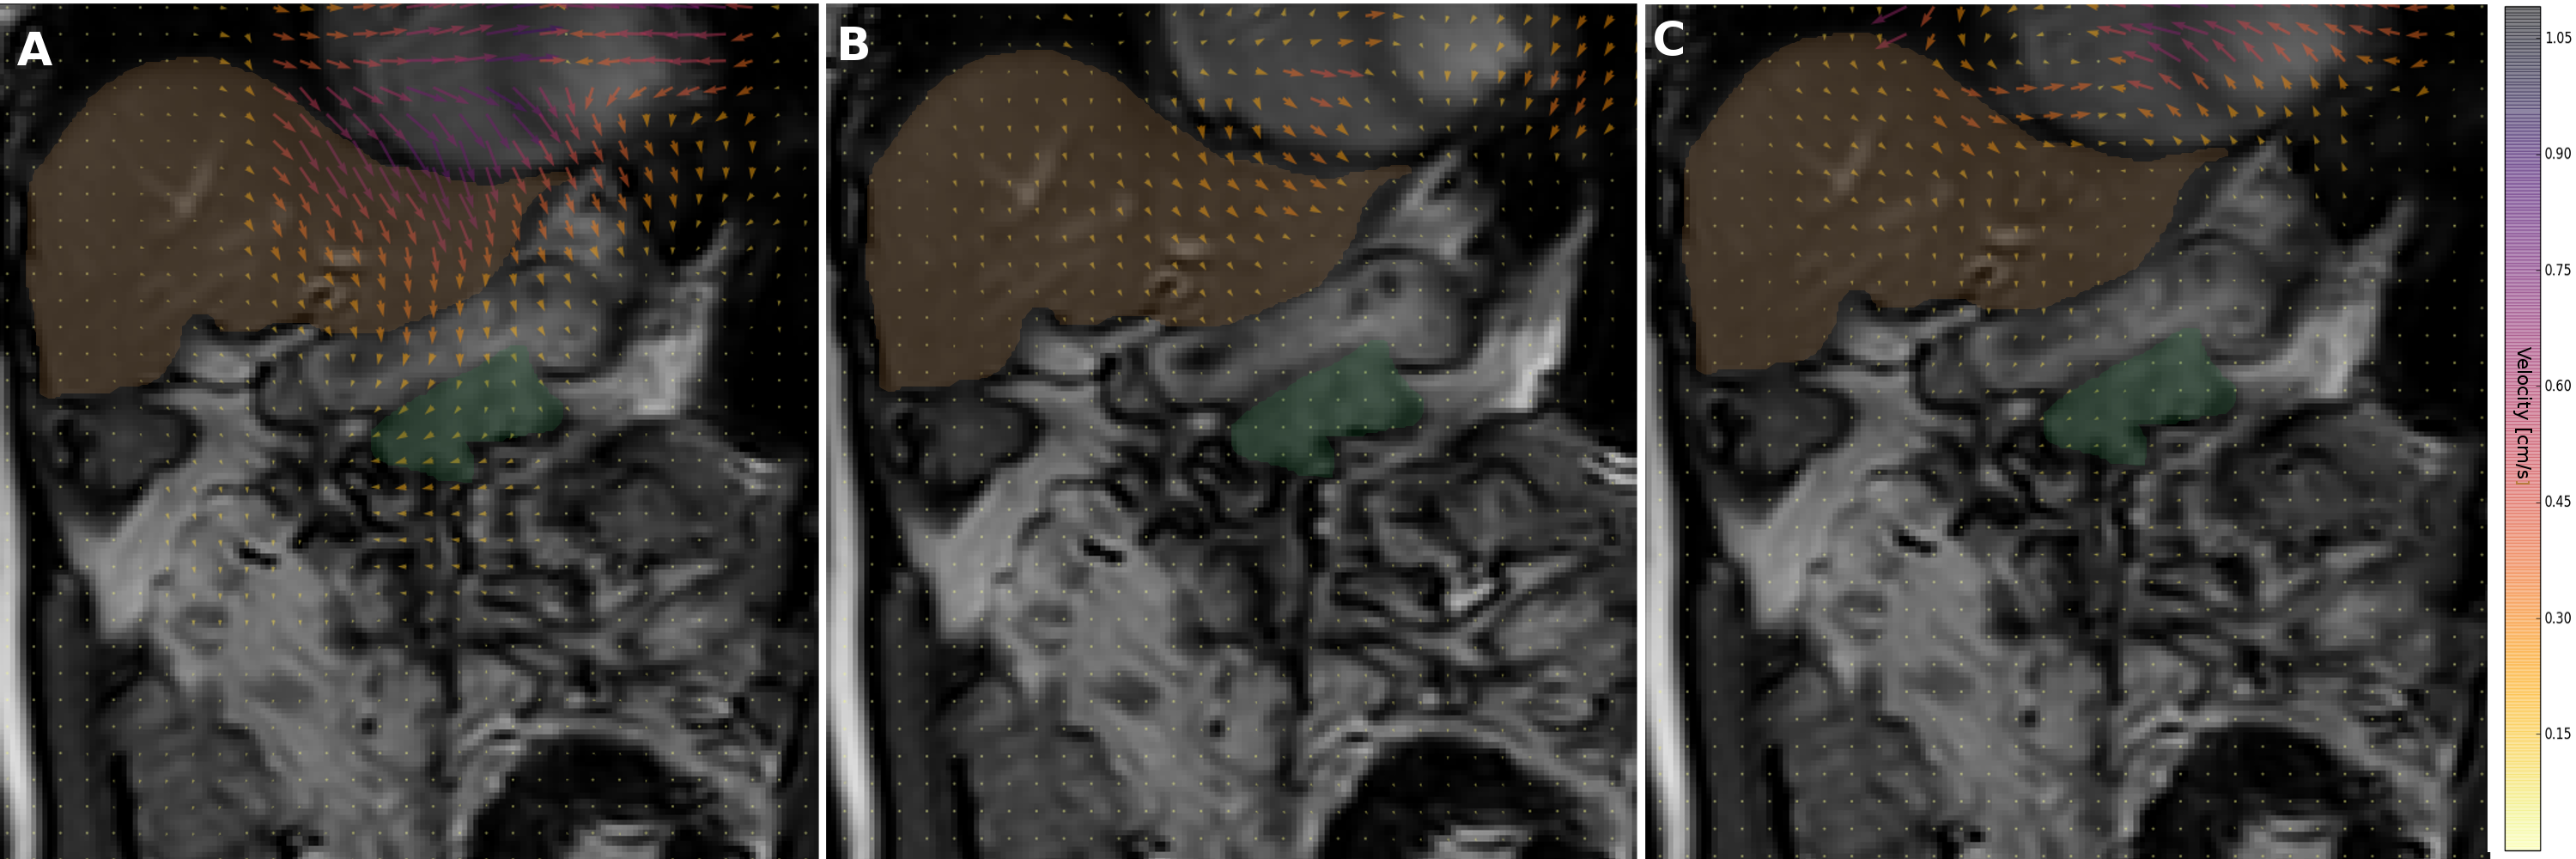
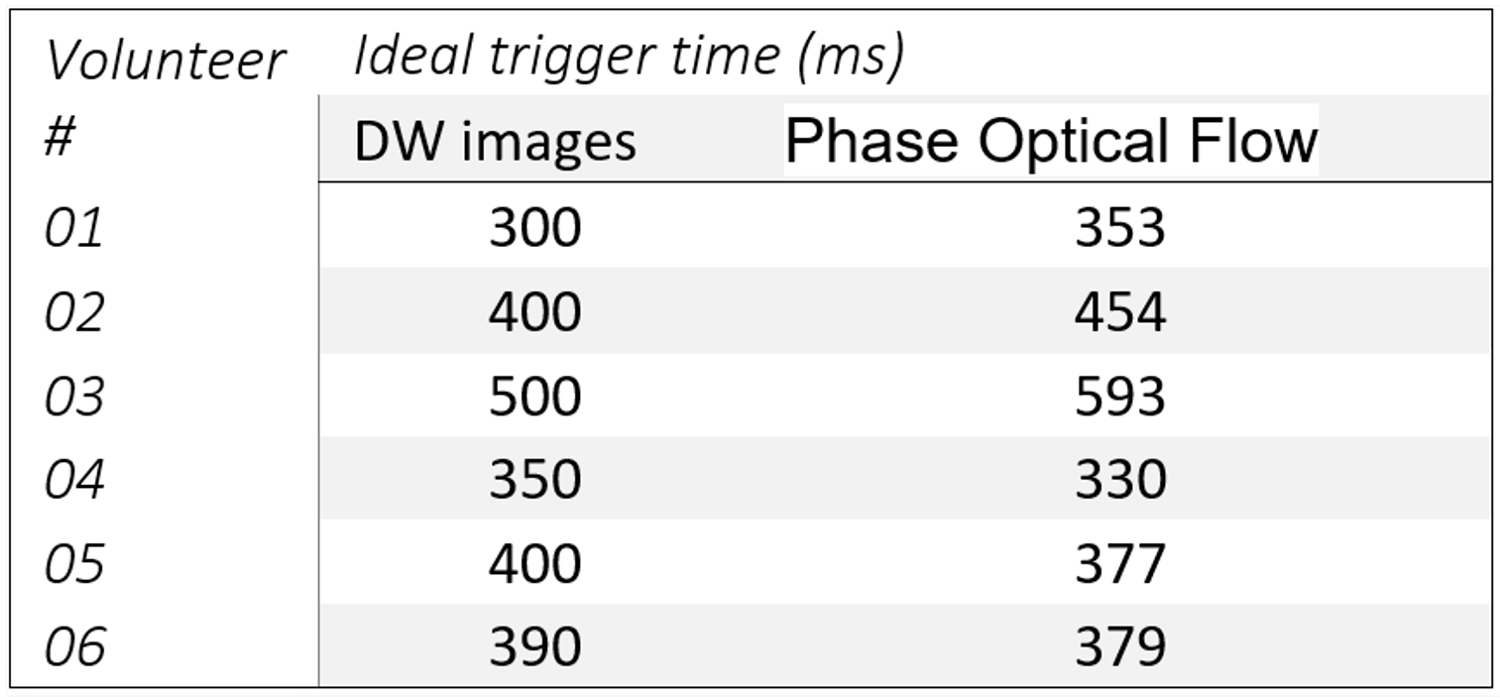
For each volunteer, the cardiac trigger timing obtained by Phase Optical Flow was close to the trigger time corresponding to the best DW image (Table 1). This ideal timing has been consistently found at the end of the diastole (Fig 2). Another acceptable however shorter time period was found at the end of the systole. We observe that the best timing in the left lobe of the liver can be different of the best timing of the pancreas (Fig 3). The computation time of the whole analysis is lower than 1 minute, and can be performed during patient examination.DISCUSSION
The Phase Optical Flow provides an automatic determination of the ideal PPU cardiac trigger time for left lobe DWI. The advantage of the method is that it can apply to an arbitrary region of any abdominal organ to provide the cardiac timing for which the regional movement is minimum. Recently amplified-MRI demonstrated very subtle brain movements following Eulerian motion amplification2. In comparison, the amplitude of cardiac-related abdominal movements is larger and respiration effects need to be decoupled via breath hold sequences of limited duration (< 20 s compared to 2min in the brain); in addition optical flow was used here to determine velocities. We focused on cardiac effects because the credible use of ADC in longitudinal tumor treatment response assessment is conditioned to the minimization of ADC variability due to cardiac bulk motion1. More generally the Phase Optical Flow method could be extended to the study of tumor displacement linked to both respiratory and cardiac movements and provides useful information for therapy guidance in liver or pancreas tumors.CONCLUSION
The phase based motion amplification followed by a dense optical flow algorithm provides an automatic determination of abdominal regional movements along the cardiac cycle and allows a real time individual determination of the optimal cardiac trigger time to be used in quantitative liver DWI.Acknowledgements
No acknowledgement found.References
1. Metens T et al Liver apparent diffusion coefficient repeatability with individually predetermined optimal cardiac timing and artifact elimination by signal filtering. J Magn Reson Imaging. 2016 43(5):1100-1110
2. Holdsworth S et al Amplified Magnetic Resonance Imaging (aMRI) MRM 2016,75: 2245–2254.
3. Wadhwa N. et al. Phase-Based Video Motion Processing. ACM Trans Graph 2013;32:4.
Figures