0859
T1ρ-weighted Dynamic Glucose Enhanced MRI1German Cancer Research Center (DKFZ), Heidelberg, Germany, 2University Hospital Heidelberg, Heidelberg, Germany, 3Max-Planck-Institute for Biological Cybernetics, Tuebingen, Germany
Synopsis
Natural D-glucose can serve as a biodegradable contrast agent for the detection of tumors by means of Chemical Exchange Saturation Transfer (CEST) or Chemical Exchange sensitive Spin-Lock (CESL) Dynamic Glucose Enhanced (DGE) MRI. For application of CESL-based DGE-MRI at a 7T whole-body scanner, we implemented an adiabatic CESL sequence and essentially increased the temporal resolution employing a T1ρ-weighted acquisition scheme. Further, we introduced a simple, robust and quantitative DGE contrast. First application of T1ρ-weighted DGE-MRI in a glioblastoma patient provided a substantial contrast between tumor and healthy brain tissue and showed the dynamic glucose enhancement after a glucose bolus injection.
Purpose
Glucose is the main energy source of cancer cells. Accordingly the demand for glucose and the rate of glycolysis are elevated in tumor compared with healthy tissue1,2. Recently, it was shown that natural D-glucose can serve as a biodegradable contrast agent for the detection of cancer in patients employing Chemical Exchange Saturation Transfer (CEST, glucoCEST)3,4 and Chemical Exchange sensitive Spin-Lock (CESL, glucoCESL)5. Our purpose was to develop a fast and robust glucoCESL technique, which enables quantitative Dynamic Glucose Enhanced MRI (DGE-MRI) at ultra-high field strengths with high temporal resolution.Theory
For a two-pool system, e.g. protons of water and glucose, the on-resonant relaxation rate in the rotating frame (R1ρ) is given by R1ρ = R2 + Rex. The exchange dependent relaxation rate (Rex) is a linear function of the relative glucose concentration (cGlc) and is given by6
$$ R_{ex} = c_{Glc}\cdot\frac{k\cdot\delta^2}{\delta^2+4\pi^2\omega_1^2+k^2} $$
For T1ρ-weighted MRI we could show that the difference in signal intensities between a voxel-of-interest and a reference voxel with different exchange-dependent relaxation can be approximated by5
$$ \Delta S =S_{ref}-S \approx \Delta R_{ex} \cdot TSL \cdot e^{-R_{1\rho} \cdot TSL} $$
assuming that ΔRex∙TSL << 1, where TSL is the spin-lock time. This formula also holds for the same voxel but different time points, e.g. in T1ρ-weighted DGE-MRI before and after administration of glucose. Dividing ΔS by the reference signal Sref yields the T1ρ-weighted dynamic glucose enhancement (DGEρ), which is independent of relaxation parameters of tissue and solely depends on the glucose concentration change for a given TSL:
$$ DGE_{\rho}=\frac{S_{ref}-S}{S_{ref}} \approx \Delta c_{glc} \cdot TSL $$
Methods
All MR measurements were performed on a 7T whole-body scanner (Siemens Healthineers, Germany). For T1ρ-weighted imaging an adiabatic spin-lock sequence as published in Schuenke et al5 was used. Two sets of glucose solutions ("phantoms") with different relaxation times were used for in vitro measurements. For in-vivo DGE-MRI about 180 individual T1ρ-weighted images (TSL = 50 ms, B1 = 5 µT) were obtained in time intervals of about 7 seconds. The first 18 acquisitions were performed before the intravenous injection of 100 ml of 20% D-glucose and serve as reference signal (Sref).Results
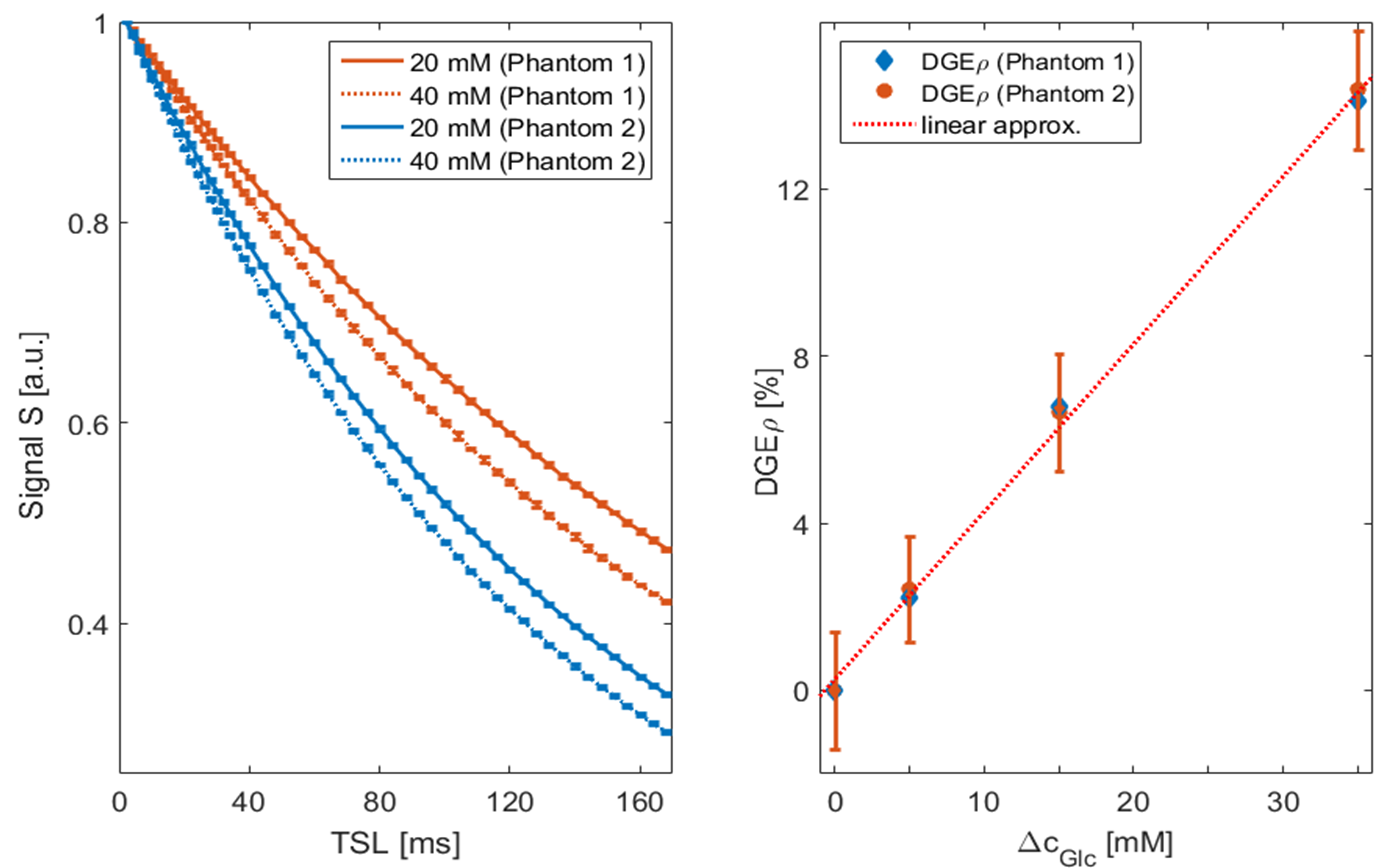
To confirm that DGEρ does not depend on the relaxation parameters of tissue we
performed measurements on aqueous model solutions with different
glucose concentrations and different relaxation rates. Despite
the different relaxation curves (Fig. 1a), DGEρ as a
function of ΔcGlc agrees well for both phantoms and shows the
linear dependence expected from theory (Fig 1b). Thus, DGEρ
reflects a quantitative contrast that solely depends on changes of the glucose concentration. This is similar to ΔR1ρ employing R1ρ mapping, which, however, suffers from a tenfold longer acquisition time if applied to studies in humans5.
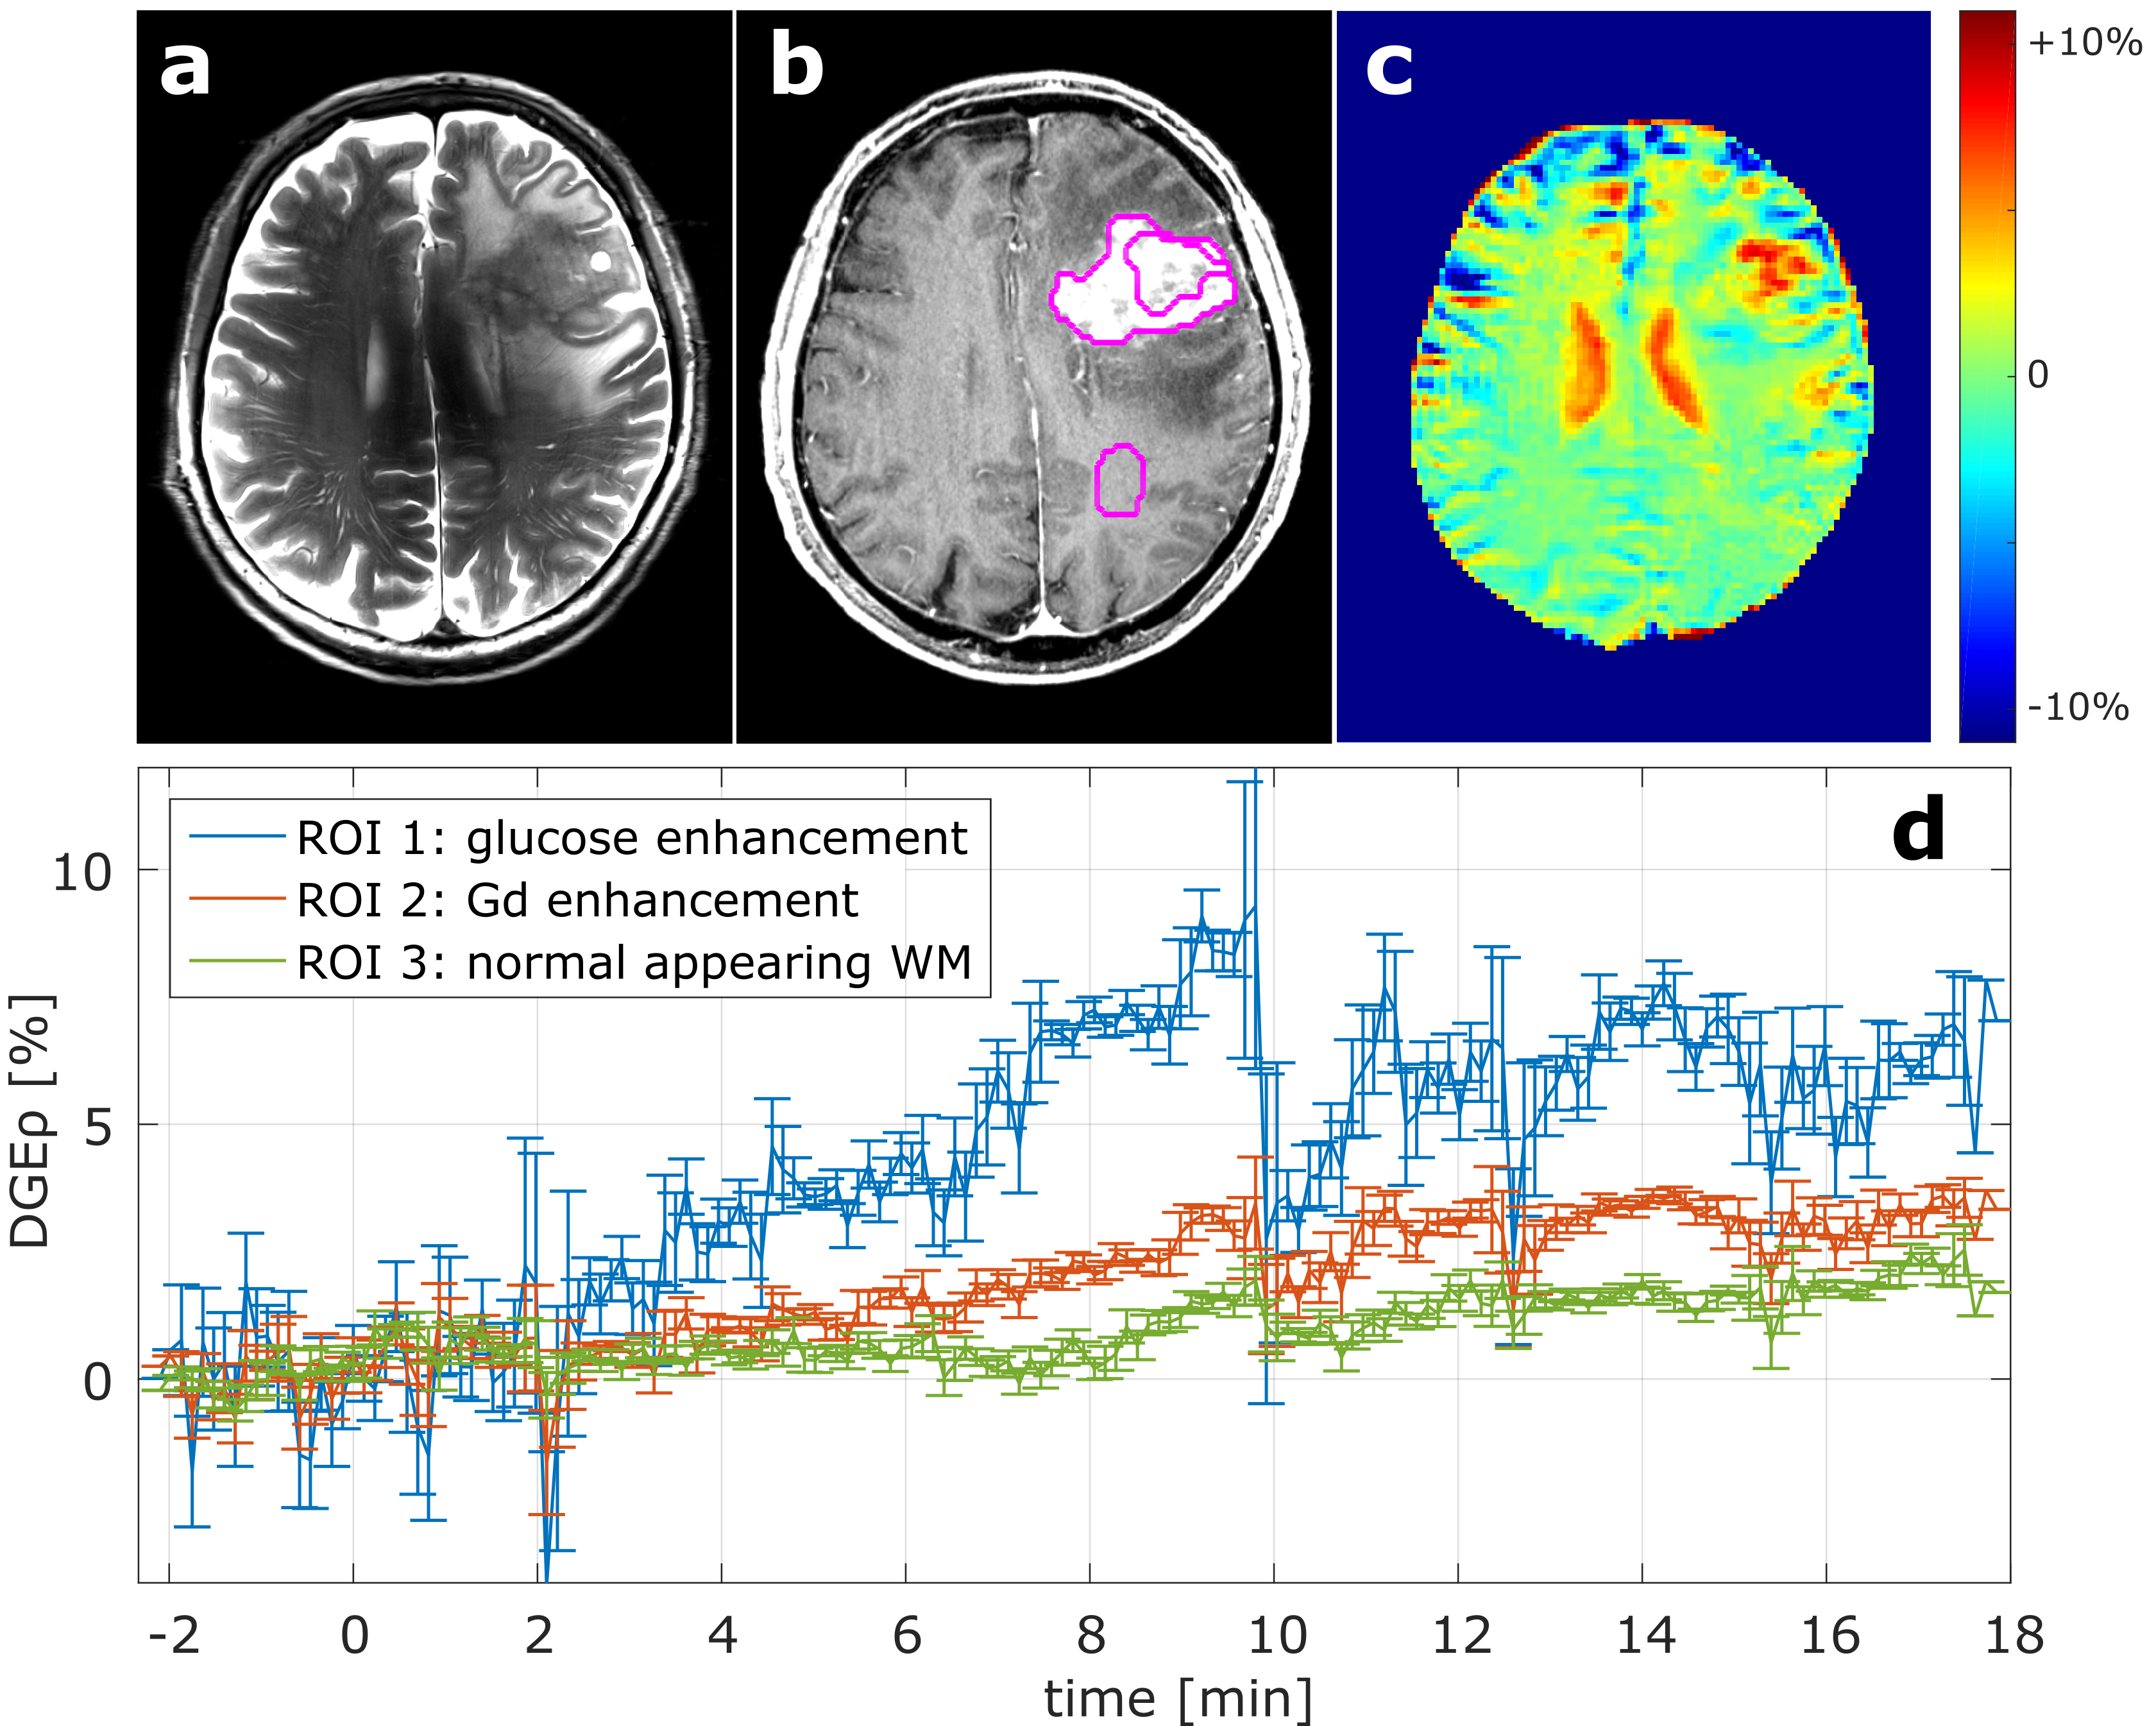
Figure 2 shows the results of a first examination of a brain tumor patient with T1ρ-weighted DGE-MRI. The DGEρ image obtained about 8 minutes after glucose injection (Fig. 2c) clearly highlights the tumor region consistent with the T2-weighted (Fig. 2a) and gadolinium enhanced T1-weighted images (Fig. 2b). An increased DGEρ contrast was also observed in the ventricular area and in another region at the bottom of the tumor area. T1ρ-weighted DGE-MRI allowed investigating the glucose contrast with a temporal resolution of less than seven seconds in three regions of interest: 1) the glucose enhancing region, 2) the gadolinium enhancing region and 3) normal appearing white matter (NAWM). The ROI-specific curves are displayed in figure 2d. After the start of the injection (t = 0 min) all curves increase. However, NAWM shows only a minor increase compared with the tumor ROIs. The highest DGEρ values were observed in the tumor region about 10 min after start of the injection; the subsequent signal drop most likely results from patient motion.
Conclusion
We showed that CESL-based
DGE-MRI can be accelerated essentially by employing T1ρ-weighted imaging instead of R1ρ mapping. When applied to a brain tumor patient, T1ρ-weighted DGE-MRI provided a
distinct contrast between tumor and healthy tissue.
The proposed contrast DGEρ was shown to be independent of relaxation parameters of tissue and directly
proportional to changes of the glucose concentration. Furthermore, the technique inherits all benefits
of the adiabatically prepared spin-lock approach like the
negligible
contribution from B1 dispersion5, and the higher glucose sensitivity
and enhanced robustness against B0 inhomogeneities compared to CEST6. In combination with the simple and quantitative evaluation this suggests adiabatically prepared T1ρ-weighted DGE-MRI to be a feasible tool for the translation of glucose enhanced MRI into the
clinics.Acknowledgements
No acknowledgement found.References
1. WARBURG, O. On the origin of cancer cells. Science 123, 309–14 (1956).
2. Gatenby, R. A. & Gillies, R. J. Why do cancers have high aerobic glycolysis? Nat. Rev. Cancer 4, 891–9 (2004).
3. Xu, X. et al. Dynamic Glucose-Enhanced (DGE) MRI: Translation to Human Scanning and First Results in Glioma Patients. Tomogr. a J. imaging Res. 1, 105–114 (2015).
4. Wang, J. et al. Magnetic Resonance Imaging of Glucose Uptake and Metabolism in Patients with Head and Neck Cancer. Sci. Rep. 6, 30618 (2016).
5. Schuenke, P. et al. Adiabatically prepared spin-lock approach for T1ρ-based dynamic glucose enhanced MRI at ultrahigh fields. Magn. Reson. Med. (2016). doi:10.1002/mrm.26370
6. Jin, T., Mehrens, H., Hendrich, K. S. & Kim, S.-G. Mapping brain glucose uptake with chemical exchange-sensitive spin-lock magnetic resonance imaging. J. Cereb. Blood Flow Metab. 34, 1402–10 (2014).
Figures