0858
Spatiotemporal quantification of reporter gene expression in the mouse heart using the Lysine Rich Protein and cardiac chemical exchange saturation transfer1Physiology, University of Kentucky, Lexington, KY, United States, 2Physiology, University of Kentucky, 3University of Kentucky, 4Radiology and Radiological Sciences, Johns Hopkins University, 5Bioengineering, U.C. Berkeley, Berkeley, CA, United States
Synopsis
We utilized cardiac chemical exchange saturation transfer MRI and an artificial reporter gene, the Lysine Rich Protein (LRP), to image gene transfer in the mouse heart using 2 routes of viral vector administration.
Purpose
Cardiac gene therapy is emerging as a potential avenue by which to prevent or treat adult heart failure without mechanical intervention (1, 2). In order to promote the development of such therapies it is necessary to correlate gene delivery and expression patterns with functional outcomes. Cardiac magnetic resonance is well suited for measurement of important outcome parameters including regional contractile function, fibrosis and perfusion in both mice and humans (3, 4). While pre-clinical research can utilize optical based reporter gene strategies for non-invasive measurement of gene expression, such methods are not clinically suitable. Chemical exchange saturation transfer (CEST) – MRI has been used in conjunction with the CEST-MRI reporter gene Lysine Rich Protein (LRP) for imaging of gene transfer and expression in tumors (5-7). In this study, we used cardiac CEST-MRI and LRP to quantify global and focal gene transfer and expression in two mouse models of cardiac gene therapy based on administration of adeno-associated viral vectors (AAV9).Methods
AAV9 preparation: AAV9 viral vectors contained LRP (AAV9-LRP) coupled to the V5 epitope tag (CMV promoter) and enhanced green fluorescent protein (eGFP). Empty AAV9 vectors (AAV9-Empty) were used for control studies.
Systemic Administration: Thirty male C57B6/J mice received a 100μL tail vein injection of AAV9-LRP (n = 13), AAV9-Empty (n = 10), or saline (n = 7). Imaging was performed at 1, 60, and 90 days post-injection after which hearts were excised, sectioned and flash frozen. Western blot and V5 co-immunoprecipitation were performed on tissue lysates.
Direct Injection: 100μL of AAV9-LRP (n = 9) or AAV9-Empty (n = 6) was directly injected into the inferior wall of the left ventricle using the pop-out technique described by Gao et al (8). Mice were imaged prior to and 15 and 45 days post AAV9 injection after which hearts were flash frozen sectioned, and immuno-stained for V5 with nuclear counter staining.
Imaging: In vivo imaging used a whole body cylindrical coil for excitation and a dedicated 4-channel phased array surface coil for detection in a 7T ClinScan (Bruker, Ettlingen, Germany). One midventricular slice was imaged using a CEST-encoded steady state cine gradient echo sequence described in Pumphrey et al (9). CEST-encoding used a 2.03s train of Gaussian pulses (total power 4.7μT). Cine gradient echo data (TR/TE = 10/2.3 ms, flip angle = 15°, readout time = 500ms, averages = 4) was acquired over 4 heart beats with inner loop averaging. Image pairs were acquired following CEST preparation at offsets of ±3.76ppm.
Analysis: Registration of end diastolic frames from both offsets in Matlab (Mathworks, Nattic, MA) enabled quantification of CEST contrast as MTRasym =(S-3.76ppm–S3.76ppm)/S3.76ppm*100 on a pixel-wise basis. For systemic administration MTRasym values were averaged over the entire left ventricle. MTRasym values for direct injection were measured in regions of interest defined by immunostaining patterns for AAV9-LRP, and regions of interest encompassing the inferior wall for AAV9-Empty.
Statistics: Differences in MTRasym between groups and over time were assessed via repeated measures ANOVA.
Results
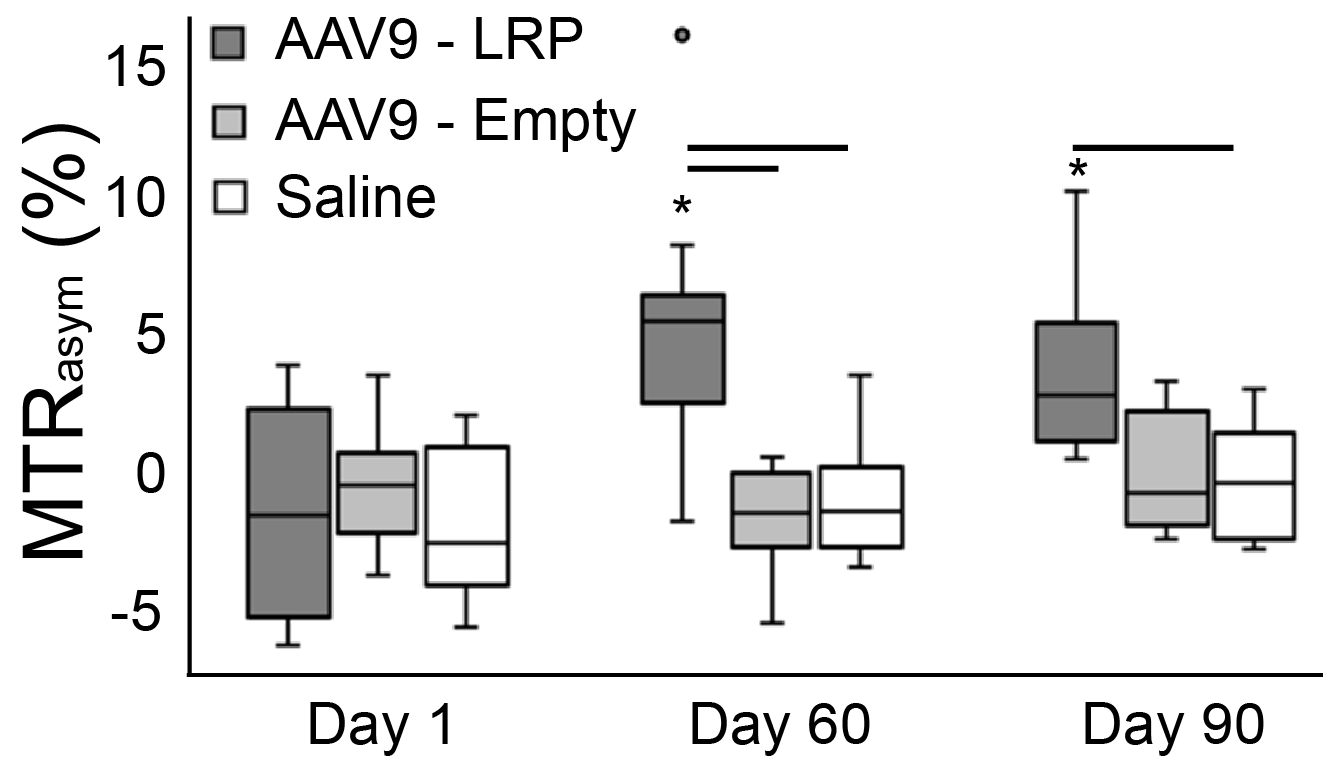
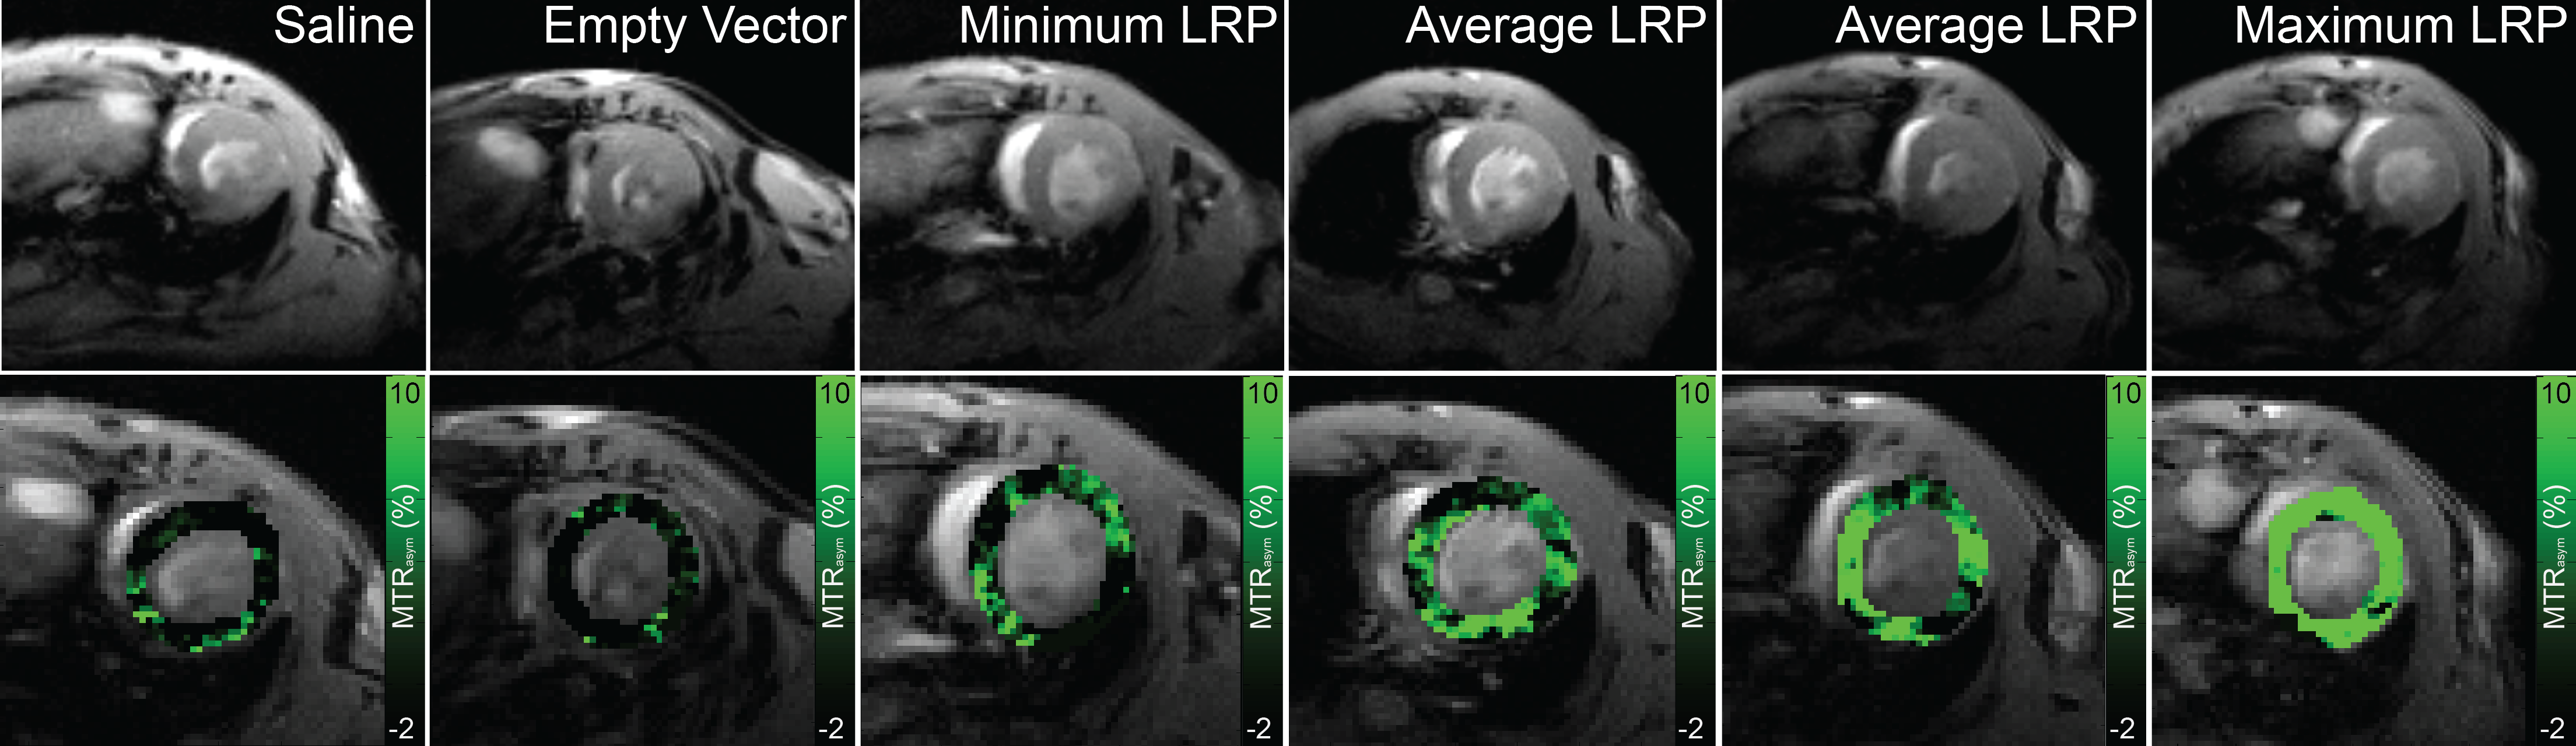
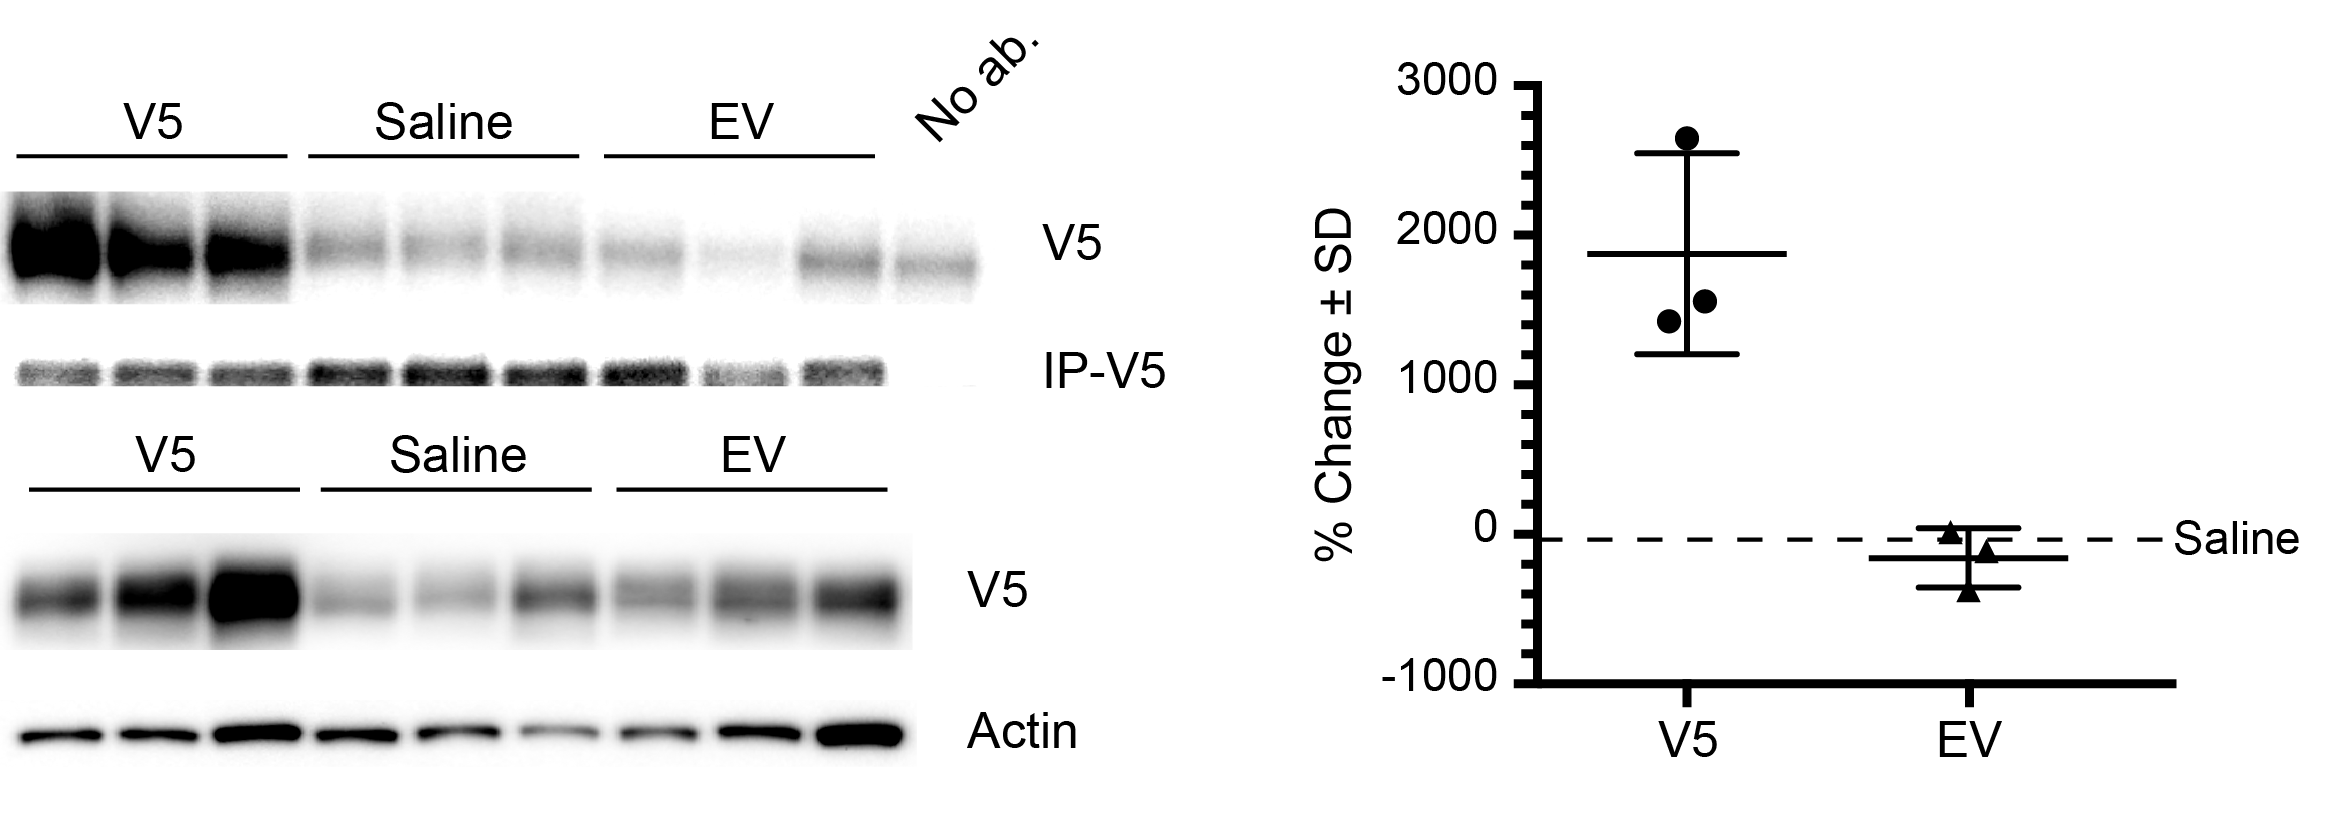
Systemic Injection: Cardiac MTRasym values were similar among all mice at 1-day post injection (Figure 1). In mice receiving AAV9-LRP, cardiac MTRasym values were significantly heightened by 60 days (Figure 1) when compared to day 1 values and other groups, and remained elevated at 90 days (Figure 1). Representative maps of MTRasym are shown in Figure 2. Co-immunoprecipitation assays confirmed robust expression of LRP-V5 in mice exposed to AAV9-LRP (Figure 3).
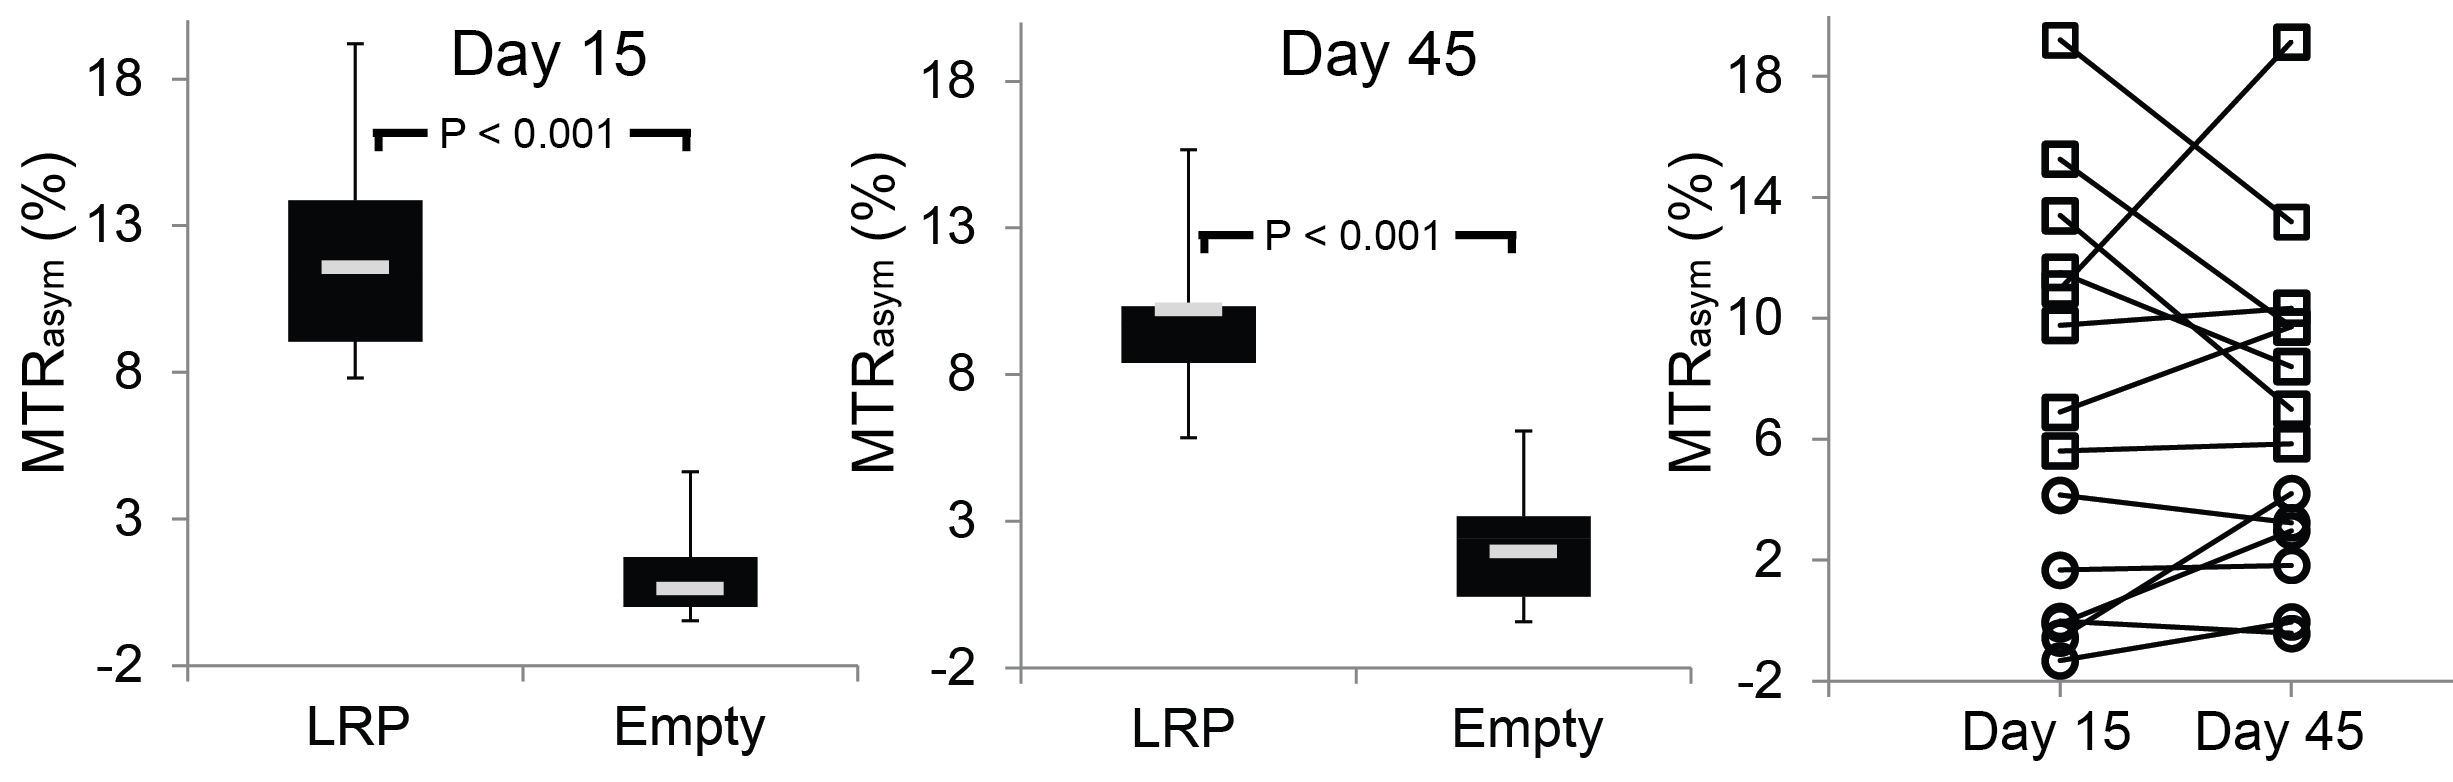
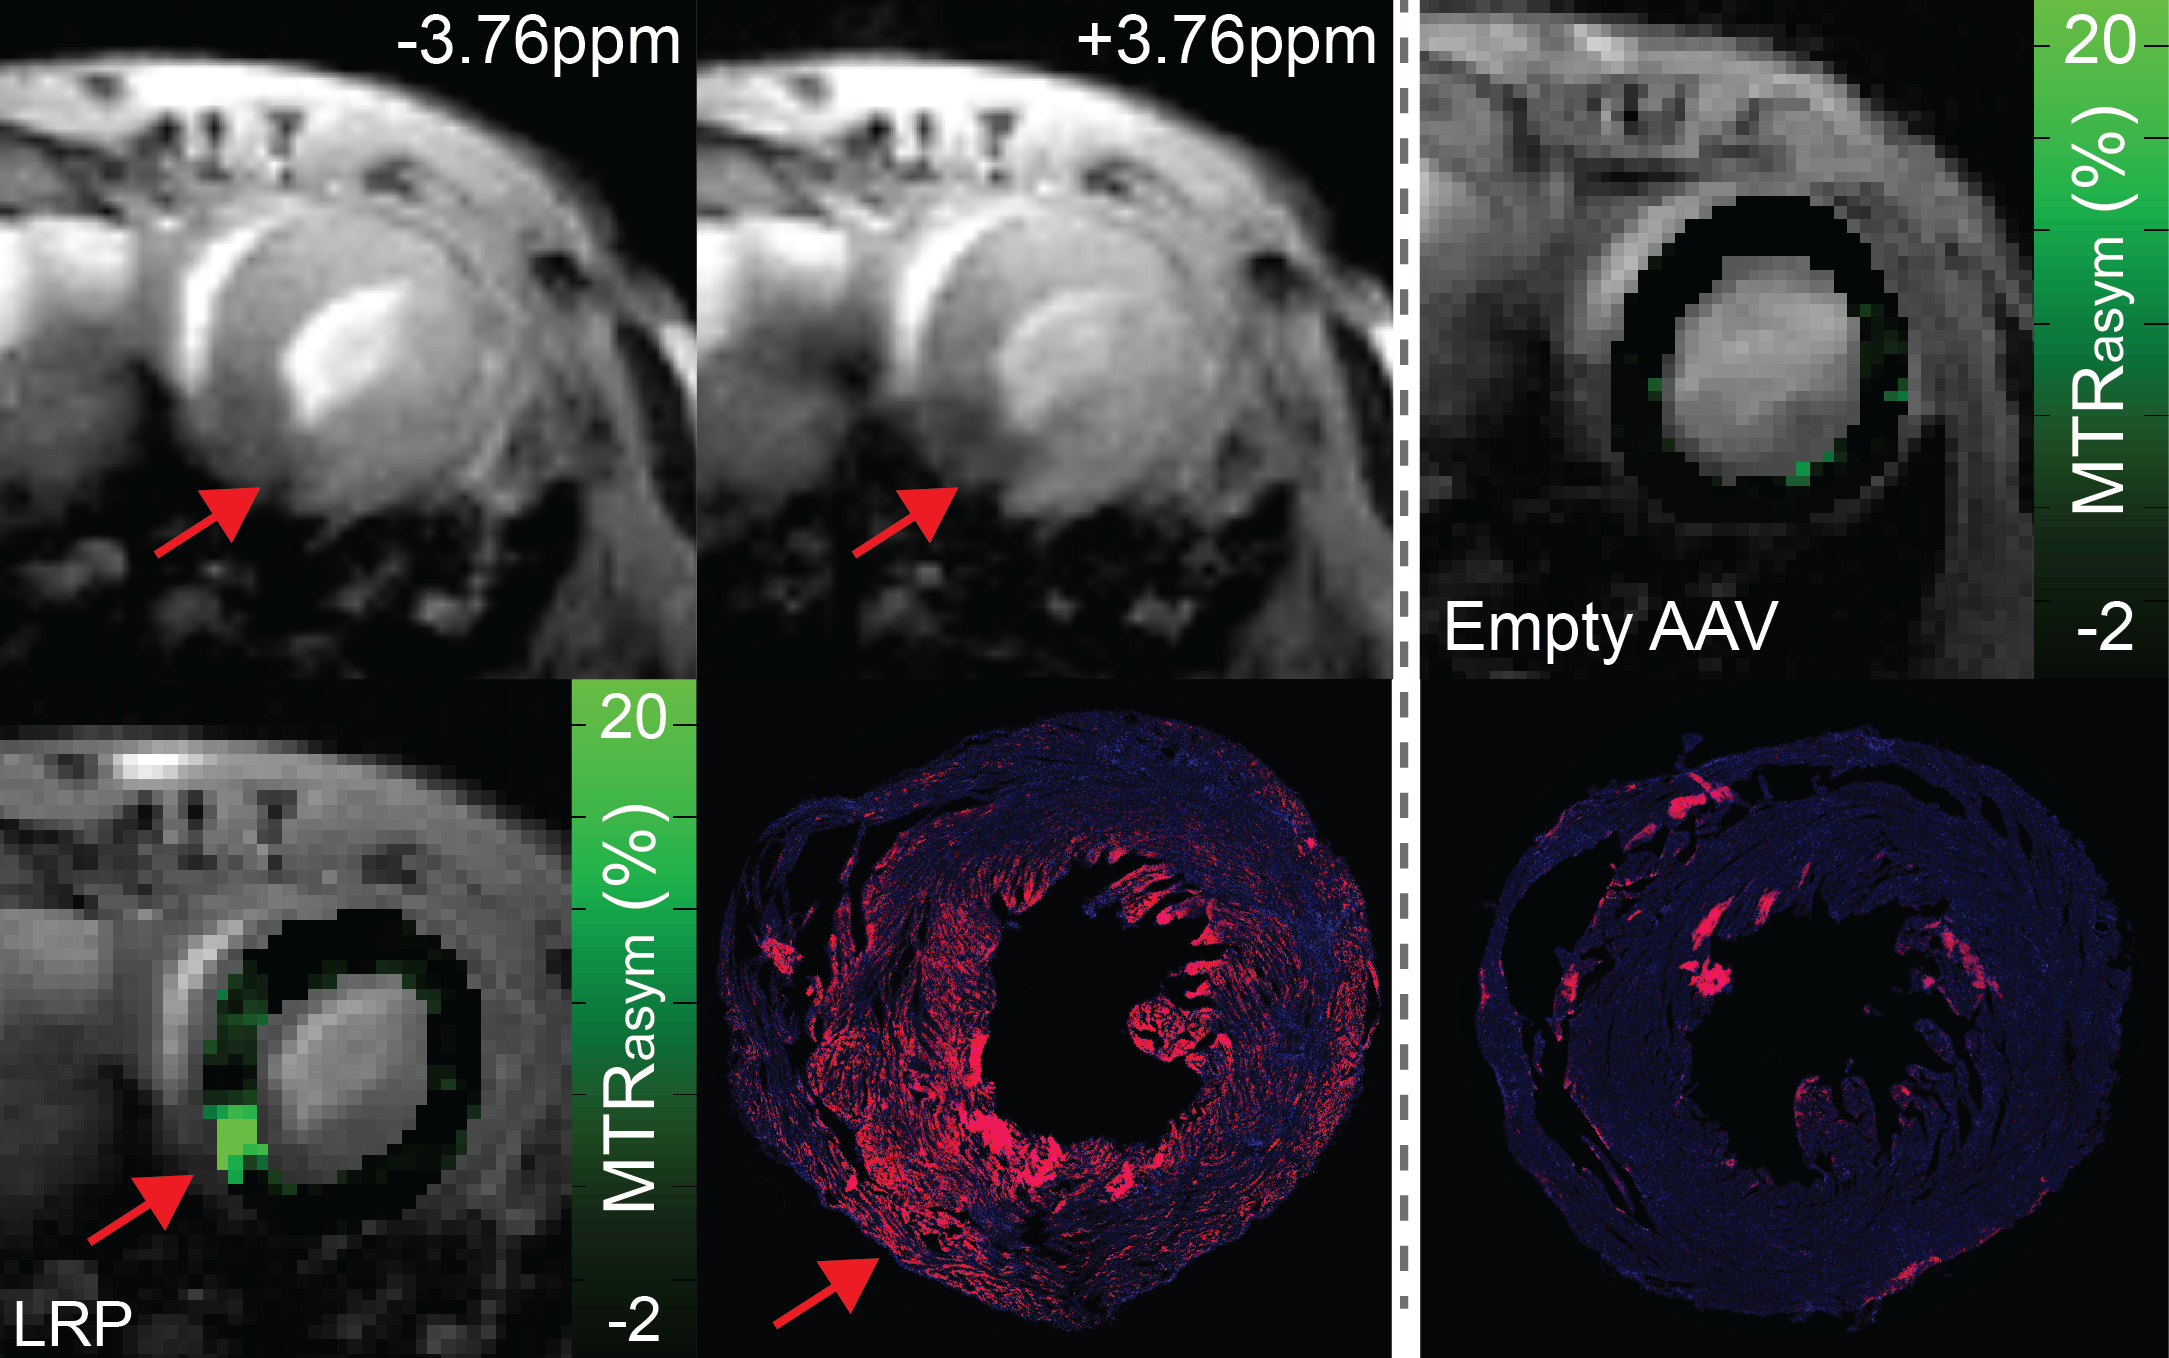
Direct Injection: MTRasym values were similarly significantly elevated in regions of LRP expression at 15 and 45 days post-injection when compared to AAV9-Empty (Figure 4). However, repeated measurement revealed temporal heterogeneity in the magnitude of CEST contrast within individual mice (Figure 4). Representative images, MTRasym maps, and immuno-fluorescence images are shown in Figure 5.
Discussion
We used cardiac CEST-MRI to quantify spatio-temporal patterns of LRP expression in two mouse models of gene transfer. When AAV9-LRP was administered systemically, CEST contrast generated by LRP was observed throughout the myocardium. In juxtaposition, when AAV9-LRP was directly injected into specific myocardial regions CEST contrast was observed only in regions of LRP expression as confirmed with immunofluorescence. The ability to quantify temporally varying and regionally specific gene expression patterns will be useful for optimizing methods of delivery and viral dosage for emerging gene therapy strategies. Further, combined imaging of gene expression and quantitation of functional outcomes including regional contractile function, perfusion, and fibrosis will enable more robust examination of emerging gene therapies for heart failure.Acknowledgements
No acknowledgement found.References
1. Matkar PN, Leong-Poi H and Singh KK. Cardiac gene therapy: are we there yet[quest]. Gene Ther. 2016;23:635-648. 2. Räsänen M, Degerman J, Nissinen TA, Miinalainen I, Kerkelä R, Siltanen A, Backman JT, Mervaala E, Hulmi JJ, Kivelä R and Alitalo K. VEGF-B gene therapy inhibits doxorubicin-induced cardiotoxicity by endothelial protection. Proceedings of the National Academy of Sciences. 2016. 3. Epstein F. MRI of left ventricular function. J Nucl Cardiol. 2007;14:729-44. 4. Naresh NK, Chen X, Roy RJ, Antkowiak PF, Annex BH and Epstein FH. Accelerated dual-contrast first-pass perfusion MRI of the mouse heart: Development and application to diet-induced obese mice. Magnetic Resonance in Medicine. 2014:n/a-n/a. 5. Farrar CT, Buhrman JS, Liu G, Kleijn A, Lamfers MLM, McMahon MT, Gilad AA and Fulci G. Establishing the Lysine-rich Protein CEST Reporter Gene as a CEST MR Imaging Detector for Oncolytic Virotherapy. Radiology. 2015;275:746-754. 6. Gilad AA, McMahon MT, Walczak P, Winnard PT, Raman V, van Laarhoven HWM, Skoglund CM, Bulte JWM and van Zijl PCM. Artificial reporter gene providing MRI contrast based on proton exchange. Nat Biotech. 2007;25:217-219. 7. Il Minn, Amnon Bar-Shir,Keerthi Yarlagadda,Jeff W. M. Bulte,Paul B. Fisher,Hao Wang,Assaf A. Gilad,Martin G. Pomper 8. Tumor-specific expression and detection of a CEST reporter gene. Magnetic Resonance in Medicine. 2015; 74(2): 544-549. Gao E and Koch W. A Novel and Efficient Model of Coronary Artery Ligation in the Mouse. In: R. G. Gourdie and T. A. Myers, eds. Wound Regeneration and Repair: Humana Press; 2013(1037): 299-311. 9. Pumphrey AL, Ye S, Yang Z, Simkin J, Gensel JC, Abdel-Latif A and Vandsburger MH. Cardiac Chemical Exchange Saturation Transfer MR Imaging Tracking of Cell Survival or Rejection in Mouse Models of Cell Therapy. Radiology. 2016;0:Epub ahead of print.Figures