0857
Improving Amide Proton Transfer (APT) MRI Quantification in Acute Human Stroke Patients: Achieving More Pure APT Signals and Higher Detection Sensitivity1Russell H Morgan Department of Radiology and Radiological Science, Johns Hopkins University, Baltimore, MD, United States, 2F.M. Kirby Research Center for Functional Brain Imaging, Kennedy Krieger Institute, Baltimore, MD, United States, 3Stroke Diagnostics and Therapeutics Section, National Institute of Neurological Diseases and Stroke, National Institutes of Health, Bethesda, MD, United States
Synopsis
APT-weighted (APTw) imaging based on MTR asymmetry analysis has shown promise for identifying ischemic lesions, but suffers from low accuracy due to small APTw intensity changes, Quantitative APT, nuclear overhauser enhancement (NOE), perfusion and diffusion MRI were performed on acute stroke patients (n=30). The results showed that while APTw MRI for pH analysis based on MTRasym analysis was confounded by upfield NOE effects, NOE-free APT-MRI contrast between normal and ischemic lesions was substantially increased, nearly 3 times larger than that based on MTRasym analysis. Furthermore, noticeable NOE contrast was observed for lesions, explained in terms of a relayed-NOE transfer mechanism.
Introduction
Typically, perfusion (PWI)/diffusion-weighted imaging (DWI) spatial mismatch has been used to identify the presence of ischemic penumbra and to serve as a selection marker for thrombolysis (1, 2). Although promising, this is still limited in routine clinical application due to variable sensitivity, specificity and high false-negative rates (3-5). Recently, pH-sensitive amide proton transfer (APT) imaging has shown promise in detecting ischemic tissue acidosis following impaired aerobic metabolism (6-10). However, the MTRasym(3.5ppm) or APT-weighted (APTw) signal intensity of the ischemic lesion that was used in previous studies is unavoidably contaminated (reduced) by the upfield relayed nuclear Overhauser enhancement (rNOE) effect, resulting in a small or sometimes negligible imaging contrast. Here, we investigated quantitative APT and rNOE effects in acidic ischemic lesions and further assessed the spatial relationship between DWI, PWI and pH deficits in acute stroke patients.Methods
Thirty patients with acute ischemic stroke (<7 hours from symptom onset) were recruited into the NIH Natural History of Stroke Study following informed consent in accordance with IRB requirement and scanned on a Philips 3 T MRI scanner. Serial MRI scans were performed at presentation (no APTw scan allowed in our current IRB protocol for this time point), 2 hours, 1 day, 1 week, and 1 month to characterize tissue progressing to infarction. The CEST imaging sequence was incorporated into the standard protocol for clinical diagnosis. CEST images were acquired using a fat-suppressed TSE sequence with a RF saturation time of 800 ms, saturation power of 2 μT, and saturation frequency offsets (14 to -8 ppm at intervals of 0.5 ppm). After B0 correction with water saturation shift-referencing (26 frequency offsets from 1.2 to -1.2 ppm at intervals of 0.125 ppm and a saturation power of 0.5 μT), the extrapolated semi-solid MT model reference (EMR) method was used to quantify APT and NOE signals (11). A wide-offset Z-spectrum with semisolid magnetization transfer contrast (MTC) data points between 8 and 14 ppm were fitted to the two-pool MTC model with a super-Lorentzian lineshape. Finally, quantitative APT (APT#) and NOE (NOE#) signals were calculated as the difference between EMR and experimental data at 3.5 ppm and -3.5 ppm.Results and Discussion
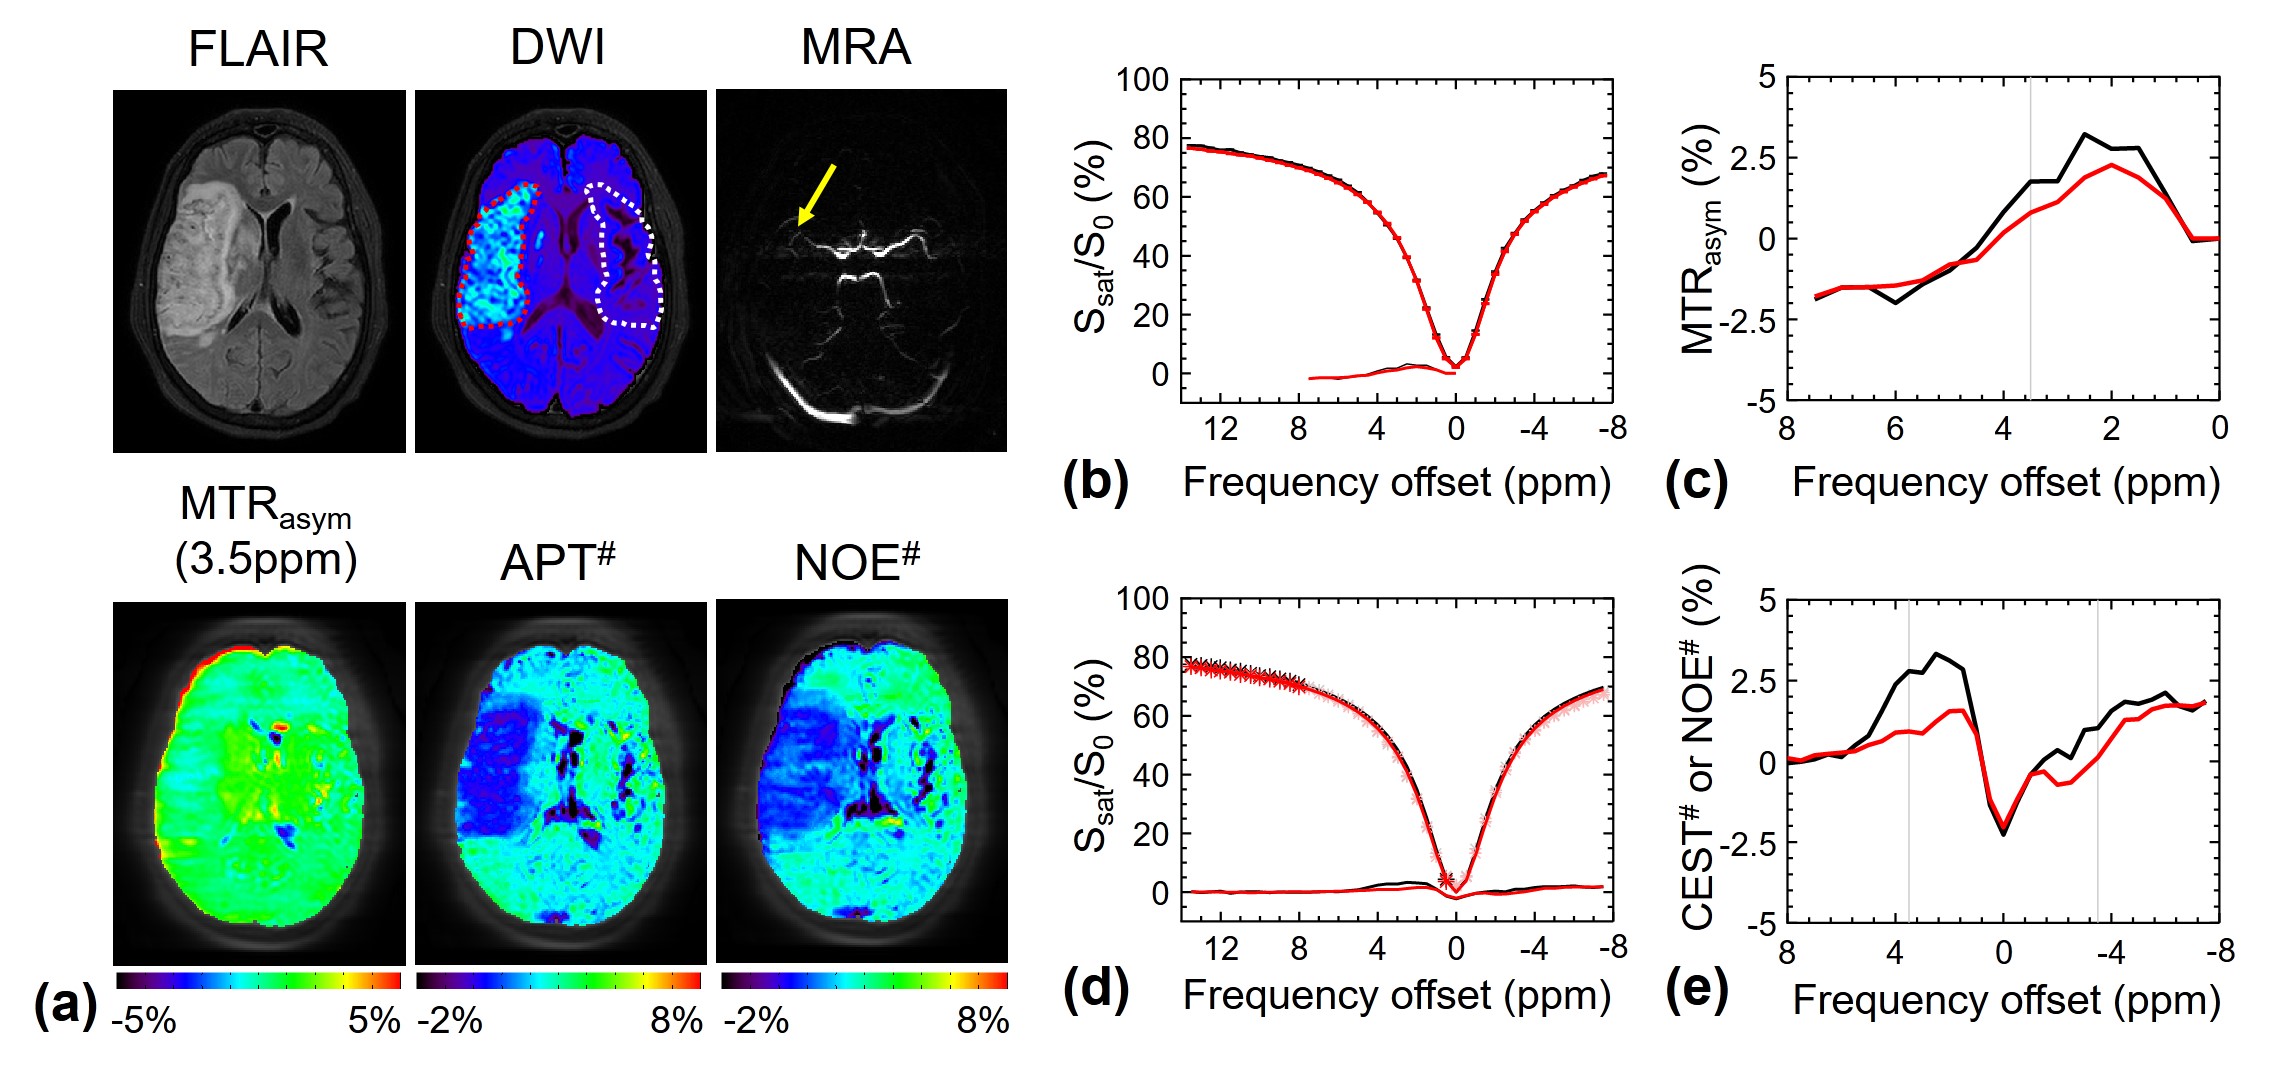
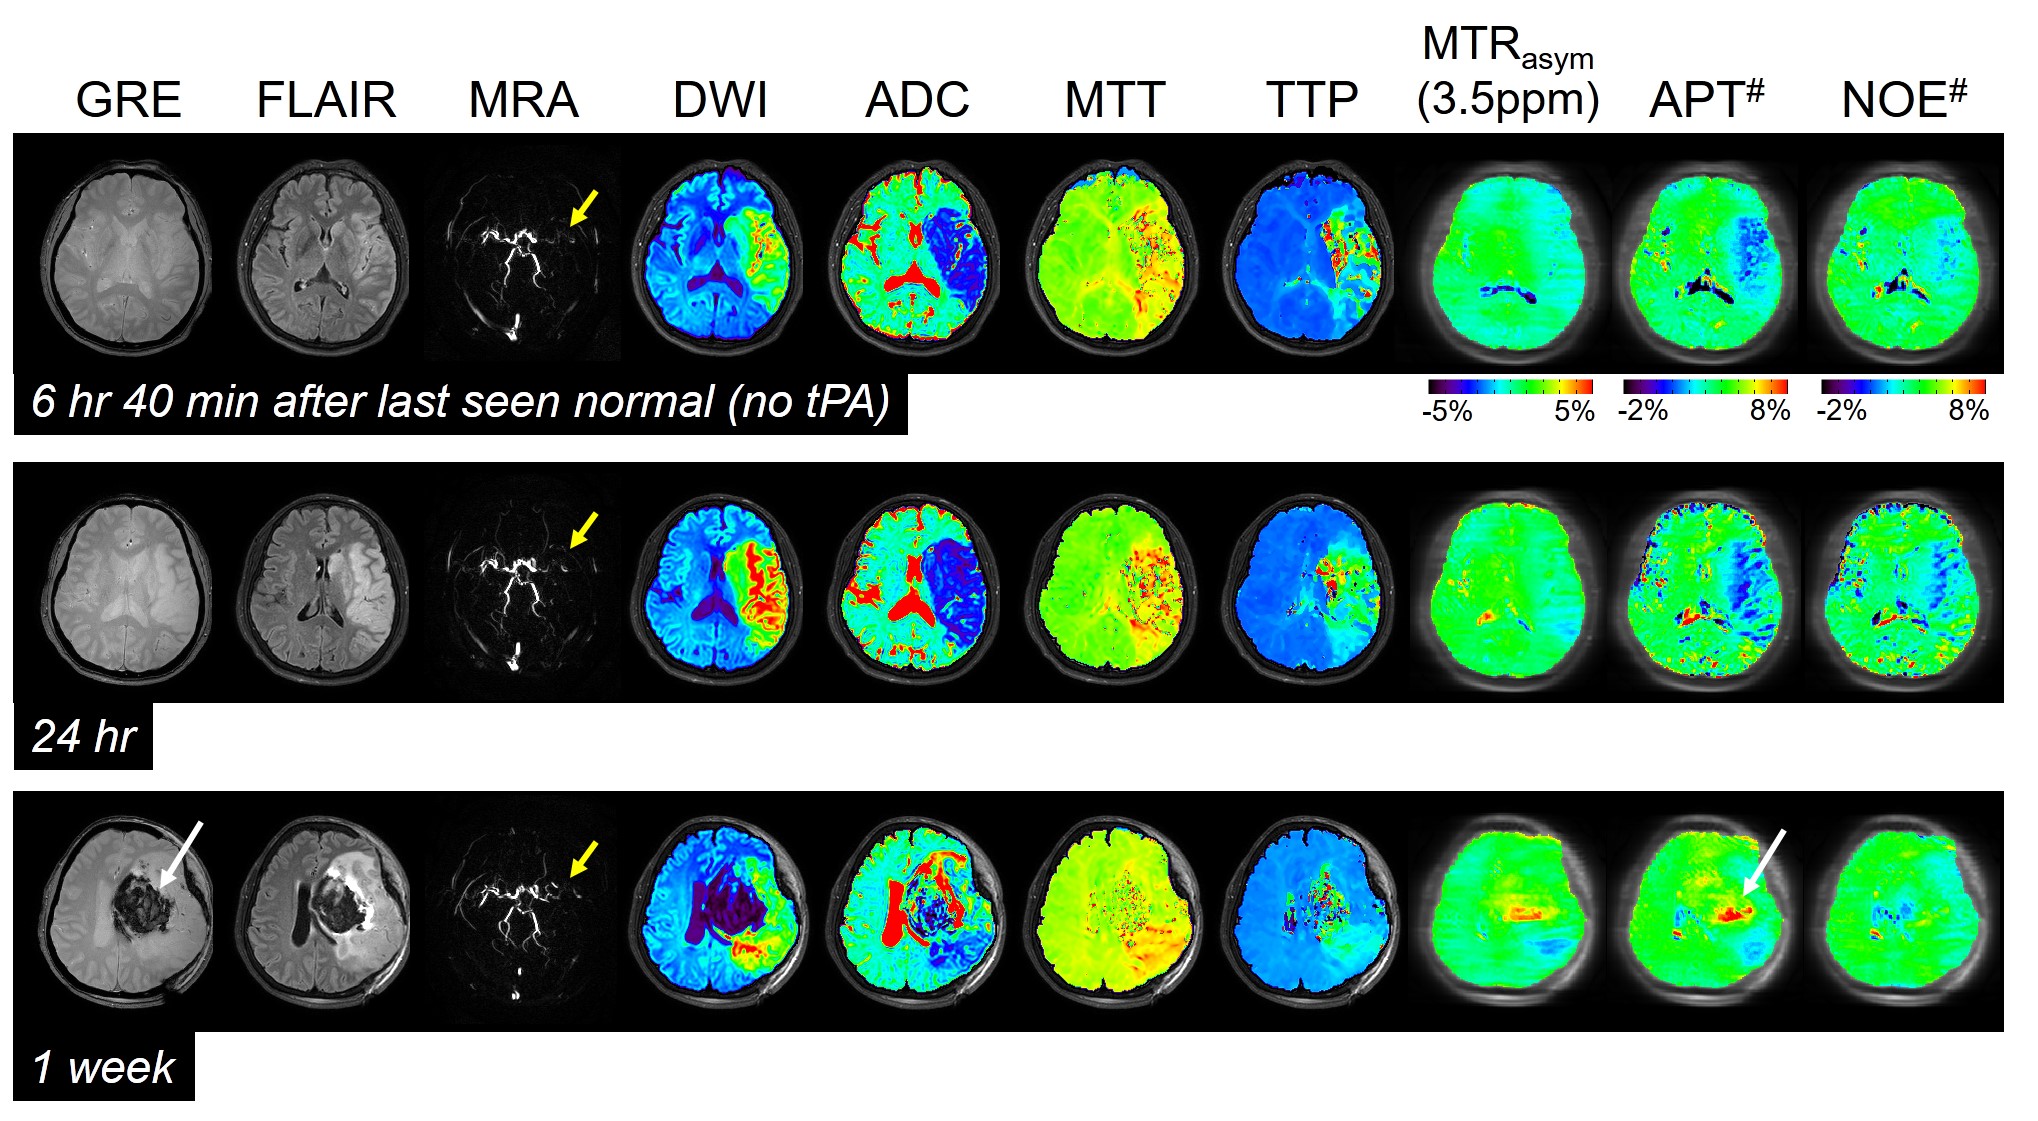
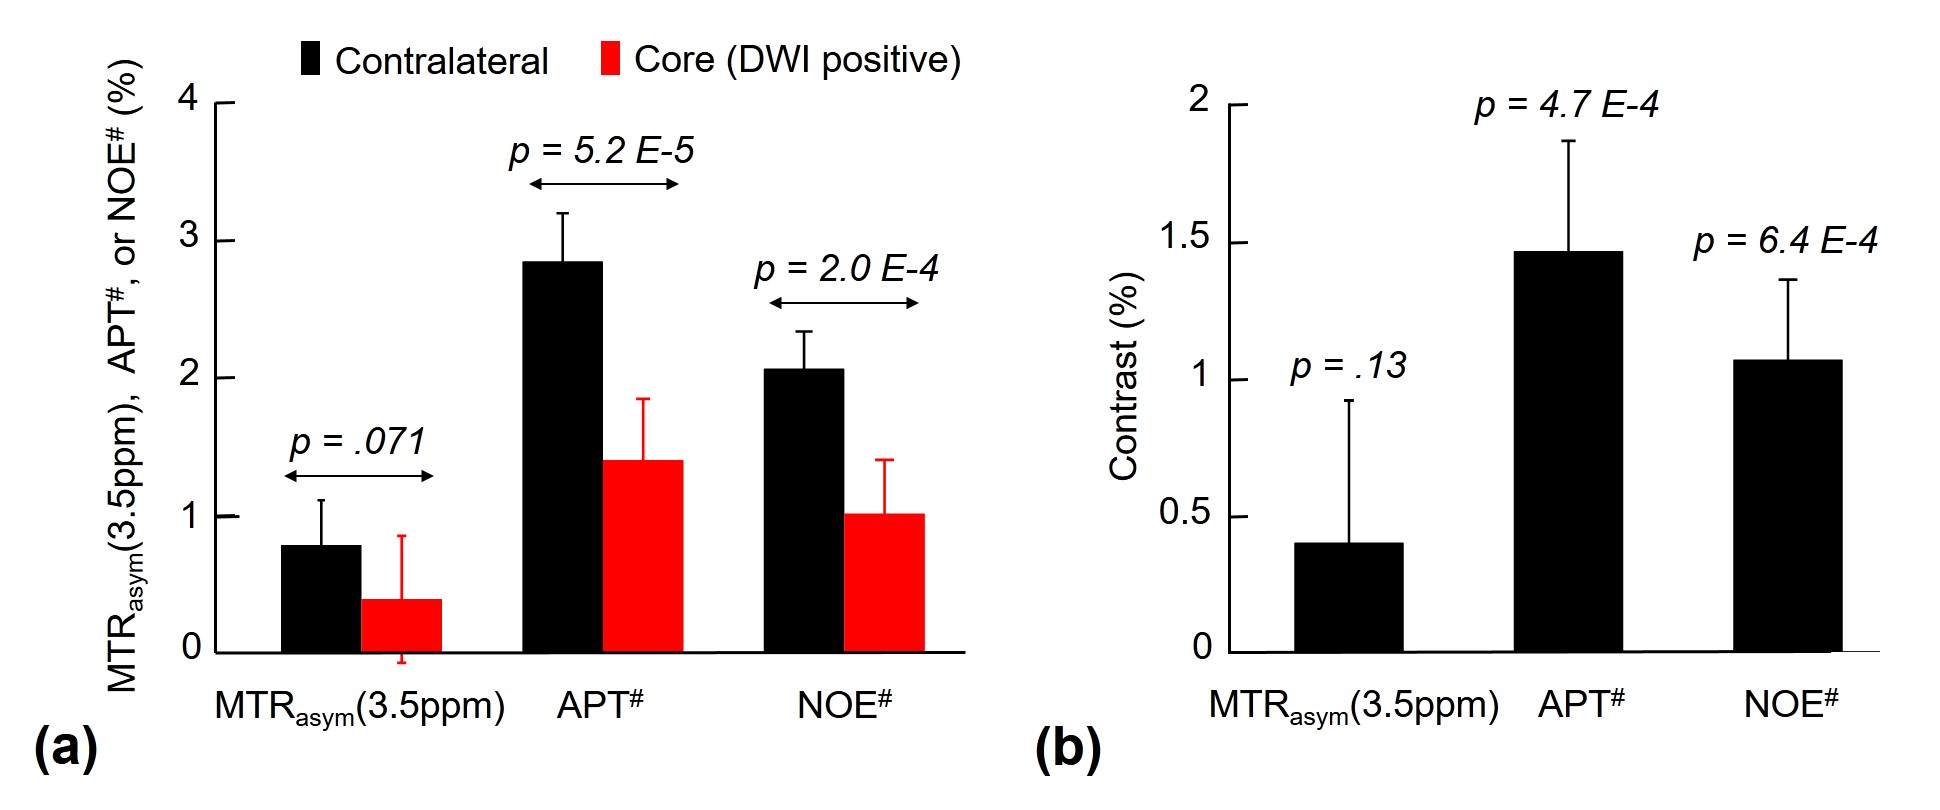
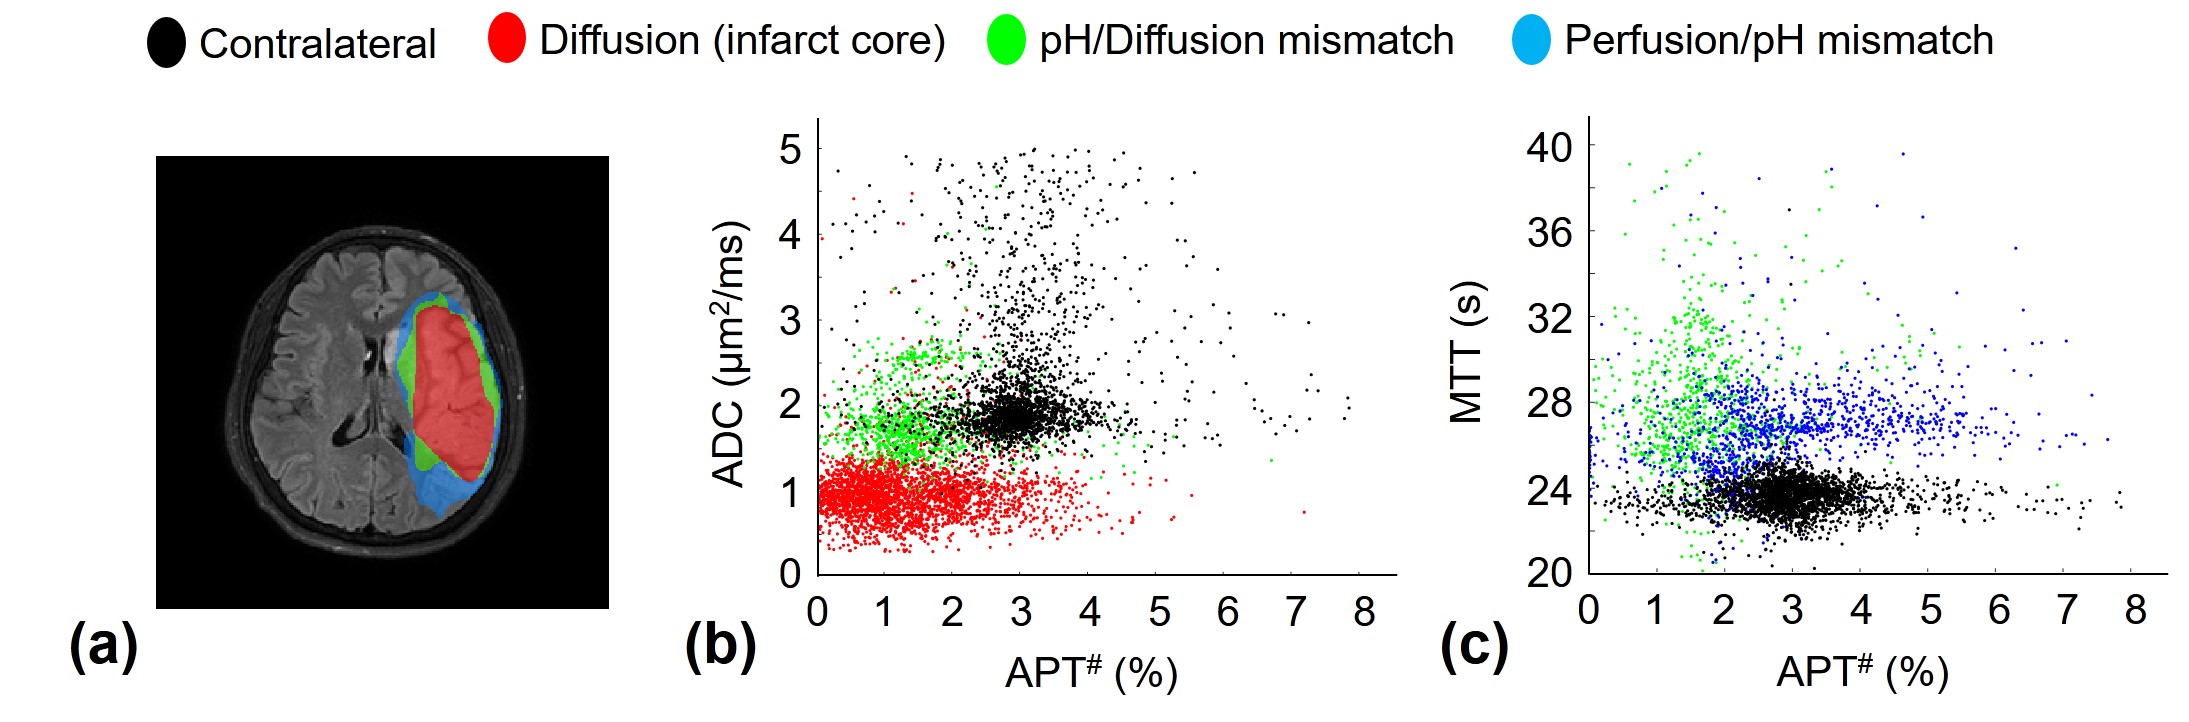
Fig. 1 shows MTRasym(3.5ppm), APT#, NOE#, and conventional MR images of an acute stroke patient, as well as an APT-MRI quantification comparison between MTR asymmetry and EMR. Both APT# and NOE# showed a strong hypointensity in the infarct core identified from the DWI, while MTRasym(3.5ppm) signal contrast between normal and acidic ischemic lesion was visible, but small. Fig. 2 shows serial multimodality MR images of an acute stroke patient with left MCA occlusion. Abnormal DWI showed local cytotoxic edema, generally leading to irreversible infarct. PWI showed a larger perfusion deficit than DWI and the spatial mismatch which is typically used for the identification of salvageable penumbra. APT# images showed clear pH deficits in the ischemic lesion, whereas MTRasym(3.5ppm) signals were isointense or slightly hypointense due to the upfield NOE contribution compensating the APT effect. Interestingly, hyperintense APT signals were observed in hemorrhage (white arrows in Fig. 2) due to abundant mobile protein and peptide in the blood, in line with previous investigations (12). Quantitatively, both APT# and NOE# signals of the ischemic lesion were significantly lower than those of the normal tissue, while the MTRasym(3.5ppm) signals showed a trend but no significant difference, as shown in Fig. 3. Correspondingly, the APT# image contrast (NOE free) of the ischemic lesion was also much larger than the MTRasym(3.5ppm) image contrast. Contrary to NOE effects as a positive confounding factor in tumor (11), it is shown here that NOE is a negative confounding factor in APT imaging of stroke. Thus, the absolute MTRasym(3.5ppm) signal intensity and image contrast of the ischemic lesion is reduced by the upfield NOE contribution. This is understandable in terms of the origin of the NOE signals being due to NOEs relayed via the exchangeable protons (13,14) and in line with recent studies reporting that the rNOE effect via exchangeable groups is pH dependent (15). Thus, the use of MTRasym(3.5ppm) can decrease the stroke APT-MRI sensitivity. Fig. 4 shows pH/diffusion and perfusion/pH scatterplots to investigate the spatial dynamics of ischemia progression in a representative acute stroke patient. The distributions of the diffusion deficits, pH-diffusion mismatch, and perfusion-pH mismatch suggest that the hypoperfused acidic ischemic lesion without an ADC abnormality identifies the ischemic acidosis penumbra, while the hypoperfused neural area classifies benign oligemia, in line with hypotheses previously suggested (7,10)Conclusions
APT studies using the EMR approach can achieve less contaminated APT-MRI signals and enhance APT MRI sensitivity to pH and may allow reliable delineation of an ischemic acidosis penumbra. It may in the future help guide thrombolytic and/or neuroprotective therapies for acute stroke patients at various therapeutic windows.Acknowledgements
This work was supported in part by grants from the National Institutes of Health (R01EB009731, R01CA166171, R01NS083435, EB015032, and P41EB015909).References
1. Schlaug, G., Benfield, A., Baird, A.E., Siewert, B., Lovblad, K.O., Parker, R.A., Edelman, R.R., Warach, S. The ischemic penumbra - Operationally defined by diffusion and perfusion MRI. Neurology 53, 1528-1537 (1999).
2. Neumann-Haefelin, T., Wittsack, H.J., Wenserski, F., Siebler, M., Seitz, R.J., Modder, U., Freund, H.J. Diffusion-and perfusion-weighted MRI - The DWI/PWI mismatch region in acute stroke. Stroke 30, 1591-1597 (1999).
3. Chalela, J.A., Kidwell, C.S., Nentwich, L.M., Luby, M., Butman, J.A., Demchuk, A.M., Hill, M.D., Patronas, N., Latour, L. & Warach, S. Magnetic resonance imaging and computed tomography in emergency assessment of patients with suspected acute stroke: a prospective comparison. Lancet 369, 293-298 (2007).
4. Morita, S., Suzuki, M. & Iizuka, K. False-negative diffusion-weighted MRI in acute cerebellar stroke. Auris Nasus Larynx 38, 577-582 (2011)
5. Butcher KS, Parsons M, MacGregor L, Barber PA, Chalk J, Bladin C., Refining the perfusion-diffusion mismatch hypothesis. Stroke. 36, 1153–1159 (2005).
6. Zhou, J., Payen, J., Wilson, D.A., Traystman, R.J. & van Zijl, P.C.M. Using the amide proton signals of intracellular proteins and peptides to detect pH effects in MRI. Nature Med. 9, 1085-1090 (2003).
7. Sun, P.Z., Zhou, J., Sun, W., Huang, J. & van Zijl, P.C.M. Detection of the ischemic penumbra using pH-weighted MRI. J. Cereb. Blood Flow Metab. 27, 1129-1136 (2007).
8. Zhao, X., Wen, Z., Huang, F., Lu, S., Wang, X., Hu, S., Zu, D. & Zhou, J. Saturation power dependence of amide proton transfer image contrasts in human brain tumors and strokes at 3 T. Magn. Reson. Med. 66, 1033-1041 (2011).
9. Harston GW, Tee YK, Blockley N, Okell TW, Thandeswaran S, Shaya G, Sheerin F, Cellerini M, Payne S, Jezzard P, Chappell M, Kennedy J. Identifying the ischaemic penumbra using pH-weighted magnetic resonance imaging. Brain. 138, 36-42 (2015).
10. Zhou J, van Zijl PC. Defining an Acidosis-Based Ischemic Penumbra from pH-Weighted MRI. Transl Stroke Res; 3:76-83 (2011).
11. Heo HY, Zhang Y, Jiang S, Lee DH, Zhou J. Quantitative assessment of amide proton transfer (APT) and nuclear overhauser enhancement (NOE) imaging with extrapolated semisolid magnetization transfer reference (EMR) signals: II. Comparison of three EMR models and application to human brain glioma at 3 Tesla. Magn Reson Med. 75, 1630-1639 (2015).
12. Wang M, Hong X, Chang CF, Li Q, Ma B, Zhang H, Xiang S, Heo HY, Zhang Y, Lee DH, Jiang S, Leigh R, Koehler RC, van Zijl PC, Wang J, Zhou J. Simultaneous detection and separation of hyperacute intracerebral hemorrhage and cerebral ischemia using amide proton transfer MRI. Magn Reson Med. 74:42-50 (2015).
13. van Zijl PC, Zhou J, Mori N, Payen JF, Wilson D, Mori S. Mechanism of magnetization transfer during on-resonance water saturation. A new approach to detect mobile proteins, peptides, and lipids. Magn Reson Med. 49:440-449 (2003).
14. van Zijl PCM, Yadav NN. Chemical exchange saturation transfer (CEST): What is in a name and what isn't? Magn Reson Med. 65:927-948 (2011).
15. Jones CK, Huang A, Xu J, Edden RA, Schar M, Hua J, Oskolkov N, Zaca D, Zhou J, McMahon MT, Pillai JJ, van Zijl PC. Nuclear Overhauser enhancement (NOE) imaging in the human brain at 7T. Neuroimage. 77, 114-124 (2013).
Figures