0856
Characterization of in vivo Chemical Exchange Parameters Using Chemical Exchange-Sensitive MRI at 9.4 T and 15.2 T1Center for Neuroscience Imaging Research, Institute for Basic Science (IBS), Suwon, Korea, Republic of, 2Samsung Advanced Insitute for Health Sciences and Technology, SKKU, Seoul, Korea, Republic of, 3Biomedical Engineering, Sungkyunkwan University, Suwon, Korea, Republic of, 4Radiology, University of Pittsburgh, 5Radiology, Sungkyunkwan University, Seoul, Korea, Republic of
Synopsis
Chemical-exchange sensitive imaging can prove to be complex particularly when imaging intermediate exchanges in-vivo where contrast comes from an amalgamation of different sources. We propose a method that utilizes Z-spectra data from multiple fields to determine apparent exchange parameters that characterize the exchange to which a particular saturation scheme is sensitive. Parameter determination in glutamate phantoms proved commensurate to utilizing an on-resonance dispersion measurement and in the rat brain cortex the kex was measured to be 11,240 s-1 antemortem and 7070 s-1 postmortem. This method is useful for determining exchange parameters relevant to complex systems when signal source is unclear.
PURPOSE
Much effort has been put forward into exploring chemical-exchange sensitive imaging. However, this chemical exchange can prove to be complex particularly when imaging intermediate exchanges in-vivo where contrast comes from an amalgamation of different sources1. We propose a method that utilizes Z-spectra data from multiple fields to determine apparent exchange parameters that characterize the exchange to which a particular saturation scheme is sensitive. By using multiple field Z-spectra, exchange rate kex and population pb can be determined by simultaneously minimizing the difference between the experimental data and simulated data from these fields. Simulated CE-sensitive Z-spectra were created with experimental parameters spin-lock frequency ω1, spin-lock time (TSL), and offset frequency Ω and independently determined R1 and R2,0 using the model from Jin et al1:
\[MTR\left(\Omega{}\right)=\frac{M\left(\Omega{}\right)}{M_0}=\left(1-\frac{R_1\cos{\theta{}}}{R_{1\rho{}}}\right)\bullet{}e^{R_{1\rho{}}\bullet{}TSL}+\frac{R_1\cos{\theta{}}}{R_{1\rho{}}} [1]\]
\[R_{1\rho{}}=R_1\cos^2{\theta{}+(R_{2,0}+R_{ex})sin}^2{\theta{}}[2]\]
\[\theta{=\tan}^{-1}{\frac{{\omega{}}_1}{\Omega{}}}[3]\]
\[R_{ex}=\frac{p_b\bullet{}{\delta{}}^2\bullet{}k_{ex}}{{\left(\delta{}-\Omega{}\right)}^2+{{\omega{}}_1}^2+{k_{ex}}^2}[4]\]
MATERIALS AND METHODS
All MR experiments were performed on either a Bruker Biospec 9.4T/30-cm or a 15.2T/11-cm instrument. B0 maps were obtained using the WASSR method2. The chemical exchange-sensitive MR pulse sequence consists of a spin-lock preparation module for chemical exchange contrast and a RF-spoiled TurboFLASH sequence with a center-out phase encoding scheme: matrix size=64 x 64, slice thickness=1 mm, flip angle = 15.0°, GRE readout TR=10.0ms, TE=1.84ms, and image TR=13.0s. R1ρ dispersion3 was measured by on-resonance spin-lock at 15 Rabi frequency(ω1) of 50,100,175,210,250,300,353,420,500,600,700,800,999,1200, and 1500Hz. At each ω1, 17 spin-lock time(TSL) values, ranging between 0 and 3000ms, were used. For Z-spectra measurements, a SL saturation pulse(ω1=500Hz and TSL=1.5sec[phantom] or TSL=150 msec[in-vivo]) was applied at 71 offsets with uneven intervals between Ω=±7.0ppm with a reference(S0) at Ω=300ppm.
Phantom: Glutamate(Glu) was prepared at 50,100, and 200mM in PBS titrated to pH of 7.4 or at 50mM in PBS titrated to pHs of 6.4,7.4,and 8.3 and transferred into 9-mm I.D. syringes for imaging at room temperature with volume coil excitation and reception(4.0-cm ID for 9.4T and 3.5-cm ID for 15.2T) and a field of view of 30mmx30mm.
In-vivo: A total of 12(n=6 each for 9.4T and 15.2T) male Sprague-Dawley rats (50-100 g) were anesthetized with isoflurane, controlled at 37.2±0.5°C, and imaged using a volume excitation and 4 channel receiver array coil assembly (FOV=25x25mm). To obtain post-mortem data, a bolus of saturated KCl (0.5-0.8 mL) was injected through the tail vein.
RESULTS
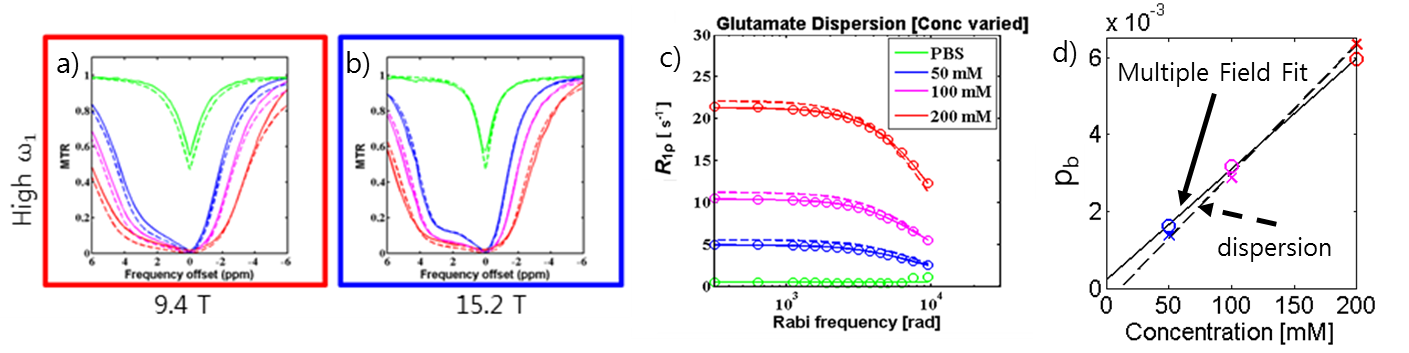
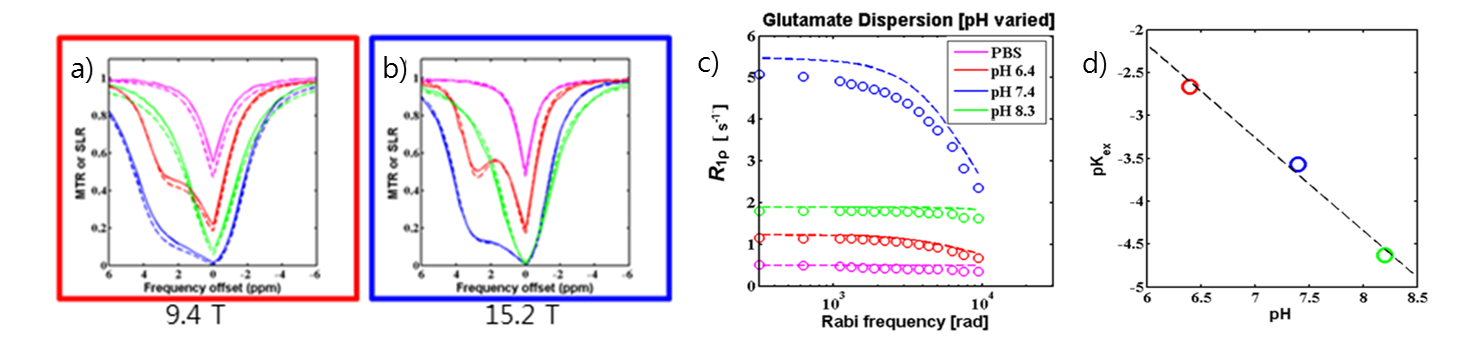
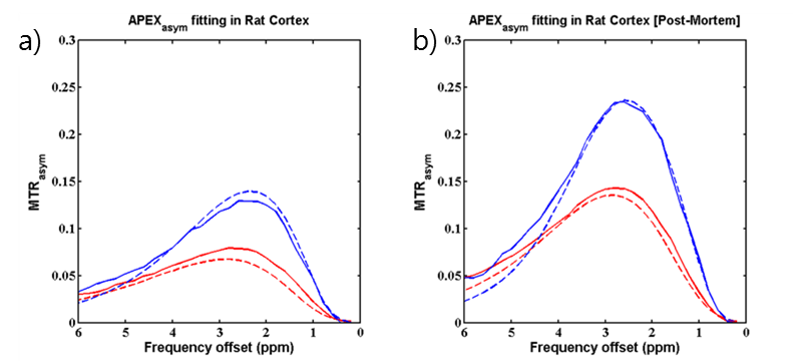
Z-spectra of concentration varied glutamate at 500Hz fit using the multiple field fitting method showed reasonable agreement with experimentally obtained Z-spectra at these parameters (Fig.1a-b). Experimental on-resonance R1ρ dispersion data shows agreement with dispersion curves simulated from exchange parameters obtained from the multiple field fitting method (Fig.1c). Concentration dependence of population values determined from both R1ρ dispersion and multiple field fitting show good correlation as well as a relatively similar exchange rate constant between all samples (Fig.1d, kex=5,921 s-1±35%[dispersion] and kex=4734 s-1±20%[multiple field fitting]). Z-spectra of pH-varied glutamate at 500Hz also showed reasonable agreement between experimental and fit spectra (Fig.2a-b). Experimental R1ρ dispersion data on the pH varied phantoms compared favorably with dispersion curves simulated using multiple field determined parameters (Fig.2c). The exchange rate compared log linearly with pH (Fig.2d) while the population value of all samples showed good agreement (pb=.0014±.0003). Asymmetry curves (Fig.3a) obtained experimentally from the rat cortex of 6 animals using APEX parameters were fit to find exchange parameters in-vivo (kex=11,240 s-1 and pb=.0021). Post euthanasia asymmetry curves (Fig.3b) were used to obtain post mortem exchange parameters (kex=7070 s-1 and pb=.0025)DISCUSSION
The studies using glutamate at different concentrations and pH demonstrate the robustness of the multi-field method for ascertaining kex and pb. Assuming a log-linear relationship between pH and exchange rate, the difference in log10[kex] between antemortem and postmortem is 0.20, indicating pH decrease from 7.4 to 7.2. This change appears to be too small since a group has reported a blood pH drop from 7.35 to 5.5 in the bloodstream of the rat postmortem4, albeit the bloodstream may show some difference with the actual tissue of the brain. If APEX has a single signal source, with such a drastic pH drop, the peak of the asymmetry curve would likely shift more profoundly toward the 3.0ppm chemical shift of the amine group. As this is not the case, it may be speculated that since the acquisition parameters remain constant, pH changes may shift the exchange rate of metabolites (including amines and hydroxyls) relative to the optimal range of the irradiation parameters. Consequently, the weighting of the measured CEST signal is affected.CONCLUSION
Multiple field fitting is a useful method for determining exchange parameters relevant to a set of saturation parameters in complex systems such as the in-vivo case.Acknowledgements
This work was supported by the Institute for Basic Science (IBS-R015-D1) and a National Research Foundation of Korea (NRF) grant funded by the Korean government (MSIP) (2016R1A2A1A05004952).References
1. Jin T, Wang P, Zong X, Kim SG. Magnetic resonance imaging of the Amine-Proton EXchange (APEX) dependent contrast. NeuroImage. Jan 16 2012;59(2):1218-1227.
2. Kim M, Gillen J, Landman BA, Zhou J, van Zijl PC. Water saturation shift referencing (WASSR) for chemical exchange saturation transfer (CEST) experiments. Magnetic resonance in medicine. Jun 2009;61(6):1441-1450.
3. Jin T, Autio J, Obata T, Kim SG. Spin-locking versus chemical exchange saturation transfer MRI for investigating chemical exchange process between water and labile metabolite protons. Magnetic resonance in medicine. May 2011;65(5):1448-1460.
4. Donaldson AE, Lamont IL. Biochemistry changes that occur after death: potential markers for determining post-mortem interval. PloS one. 2013;8(11):e82011.
Figures