0852
Epiphyseal Bone Marrow Perfusion Imaging in the Distal Femur Using Arterial Spin Labeling: Feasibility and Challenges1Radiology-CMRR, University of Minnesota, Minneapolis, MN, United States
Synopsis
Epiphyseal bone marrow perfusion of the distal femur is a valuable biomarker for knee diseases or injuries, such as anterior cruciate ligament tears and post-traumatic osteoarthritis. Bone marrow perfusion imaging is also of interest in the management of developmental knee diseases, such as osteochondritis dissecans, where the capacity to heal may be related to sufficient perfusion to the site of injury. ASL is well suited for monitoring of knee disease progression, assessment of therapy response, and use in pediatric populations. This study is to evaluate the feasibility and challenges of epiphyseal bone marrow ASL imaging in the distal femur.
Purpose
Epiphyseal bone marrow perfusion of the distal femur is a potentially valuable biomarker for certain knee pathologies due to fractures or internal derangement, such as anterior cruciate ligament tears and post-traumatic osteoarthritis (OA), which are commonly associated with bone marrow edema-like (BMEL) lesions (1-3). Bone marrow perfusion may be relevant in the context of infections, inflammatory changes or bone infarcts/avascular necrosis. Imaging of bone marrow perfusion is also potentially of interest in the clinical management of developmental knee diseases, such as osteochondritis dissecans (OCD), where the capacity to heal may be related to sufficient perfusion to the site of injury. Unlike dynamic contrast-enhanced MRI (4), arterial spin labeling (ASL) is a non-contrast enhanced and non-invasive perfusion imaging method that obviates concerns of gadolinium toxicity and is therefore well-suited for longitudinal monitoring of knee disease progression, routine assessment of therapy response, and use in pediatric populations. However, ASL has not previously been applied for in vivo imaging of epiphyseal bone marrow perfusion. This ASL application is challenging since the blood flow in bone marrow is much lower than that in highly perfused organs. The purpose of this study is to evaluate the feasibility and challenges of epiphyseal bone marrow ASL imaging in the distal femur.Methods
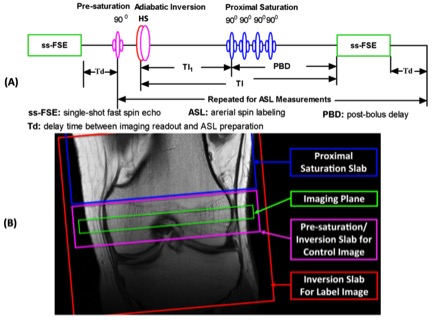
Studies were performed on a Siemens 3T MRI scanner using a single-channel transmit and 15-channel receive knee coil under an IRB approved protocol with informed written consent. A series of healthy volunteers and patients with femoral condylar OCD lesions were imaged. Knee bone marrow perfusion imaging was performed using a flow-sensitive alternating inversion recovery (FAIR) method (5) with defined temporal bolus width (6) for ASL and a single-shot fast spin echo (ss-FSE) method for image acquisition, referred to as FAIR ss-FSE (Figure 1). Within an ASL scan, 200 noise images were acquired at the end of the perfusion acquisition by turning off RF pulses to facilitate perfusion SNR analysis (7).
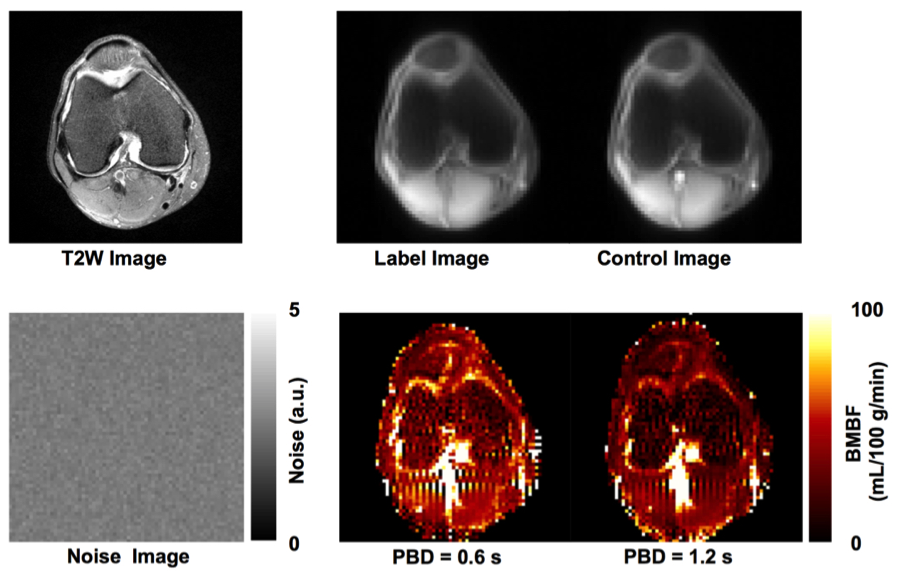
A single oblique transverse slice was utilized for the FAIR ss-FSE acquisition (Figure 1B) with 2 x 2 x 10 mm3 resolution. The major imaging parameters were as follows: TR/TE = 3000/13 ms; partial Fourier = 5/8; labeling time (TI1)/total delay time (TI) = 600/1200 ms; pairs of label and control images = 50; slab thickness/RF duration/interval of proximal saturation = 100 mm/25 ms/50 ms; and total imaging time = ~5 minutes. For some subjects, perfusion imaging using a 1200 ms post-bolus delay (PBD) was also performed to evaluate how the increase of total delay time affects the hyper-intense intravascular artifacts and perfusion signal-to-noise ratio (SNR). Bone marrow blood flow (BMBF) maps were calculated using a simplified single blood-compartment model (8). ROI-based analyses were performed with ROIs manually defined on the perfusion-weighted images (Figure 2). To further reduce the impact of subtraction errors resulting from residual motion and hyper-intense intravascular artifacts, trimmed mean perfusion signals within ROIs were used as the estimates of perfusion signal by excluding the 5% of voxels with the lowest and highest values (9). The spatial and temporal SNRs with a defined ROI were also obtained using the previous approach (7).
Results
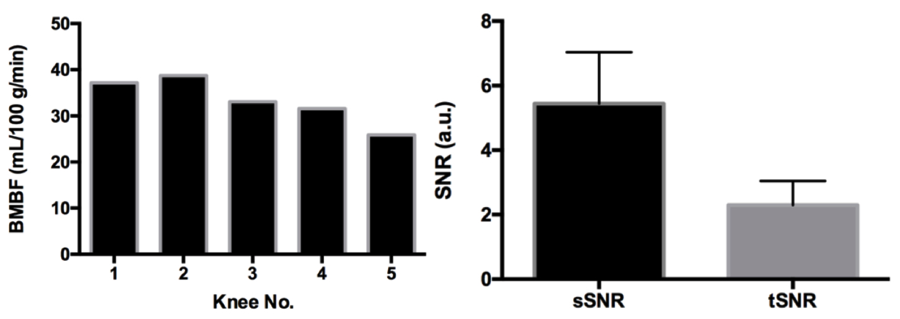
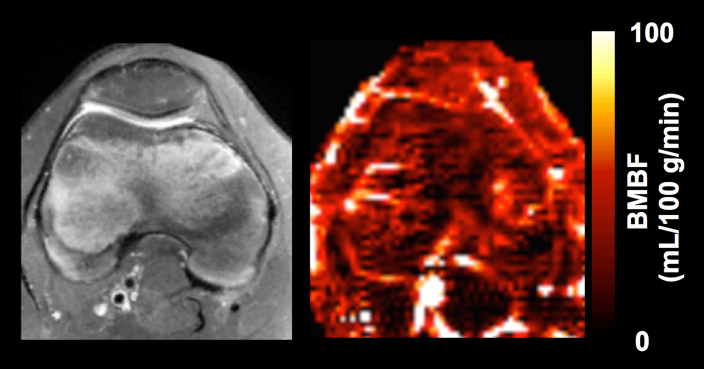
Imaging results from one healthy subject are presented in Figure 2. Study results indicate that using a larger PBD (e.g., 1.2 s, instead of 0.6 s) can minimize the undesired hyper-intense intravascular artifacts, but will unfortunately reduce perfusion signal level. Therefore, a 0.6 s PBD was selected for our quantitative perfusion studies. The quantitative imaging results from 5 healthy knees are shown in Figure 3. Figure 4 shows the perfusion imaging results from an OCD patient with bilateral knee lesions. Elevated blood flow in the bone marrow is seen just proximal to the lesions, potentially indicating that these lesions have reactive hyper-perfusion; further studies are needed to explore it’s significance for lesion healing.Discussion and Conclusions
Although feasible, it was challenging to achieve high-quality perfusion imaging at 3T because of significantly low bone marrow perfusion level, as well as other confounding factors, such as B1 field inhomogeneity. To have adequate perfusion SNR, low imaging resolution and a large number of averages had to be used. Performing such studies at ultra-high field (e.g., 7T) is a promising next step to boost imaging SNR and prolong blood and tissue relaxation times to benefit ASL imaging.Acknowledgements
P41 EB015894, P30 NS076408, UMF0003900, and UL1TR000114. The content is solely the responsibility of the authors and does not necessarily represent the official views of the National Institutes of Health.References
1. Tsai PH, Lee HS, Siow TY, Wang CY, Chang YC, Lin MH, Hsu YC, Lee CH, Chung HW, Huang GS. Abnormal perfusion in patellofemoral subchondral bone marrow in the rat anterior cruciate ligament transection model of post-traumatic osteoarthritis: a dynamic contrast-enhanced magnetic resonance imaging study. Osteoarthritis Cartilage. 2016 Jan;24(1):12933.
2. Felson DT, McLaughlin S, Goggins J, LaValley MP, Gale ME, Totterman S, Li W, Hill C, Gale D. Bone marrow edema and its relation to progression of knee osteoarthritis. Ann Intern Med. 2003 Sep 2;139(5 Pt 1):330-6.
3. Findlay DM1, Kuliwaba JS1. Bone-cartilage crosstalk: a conversation for understanding osteoarthritis. Bone Res. 2016 Sep 20;4:16028.
4. J. Zuo, S. Majumdar, and X. Li. Perfusion abnormalities of bone marrow edema-like lesions in knees with anterior cruciate ligament injury using dynamic contrast-enhanced MRI.Proc. Intl. Soc. Mag. Reson. Med. 18 (2010): 802.
5. Kim SG, Tsekos NV. Perfusion imaging by a flow-sensitive alternating inversion recovery (FAIR) technique: application to functional brain imaging. Magnetic resonance in medicine : official journal of the Society of Magnetic Resonance in Medicine / Society of Magnetic Resonance in Medicine 1997;37(3):425-435.
6. Wong EC, Buxton RB, Frank LR. Quantitative imaging of perfusion using a single subtraction (QUIPSS and QUIPSS II). Magnetic resonance in medicine : official journal of the Society of Magnetic Resonance in Medicine / Society of Magnetic Resonance in Medicine. 1998;39(5):702-708.
7. Li X, Wang D, Auerbach EJ, Moeller S, Ugurbil K, Metzger GJ. Theoretical and experimental evaluation of multi-band EPI for high-resolution whole brain pCASL Imaging. NeuroImage 2015;106:170-181.
8. Buxton RB, Frank LR, Wong EC, Siewert B, Warach S, Edelman RR. A general kinetic model for quantitative perfusion imaging with arterial spin labeling. Magnetic resonance in medicine : official journal of the Society of Magnetic Resonance in Medicine / Society of Magnetic Resonance in Medicine 1998;40(3):383-396.
9. Li X, Sarkar SN, Purdy DE, Spence JS, Haley RW, Briggs RW. Anteroposterior perfusion heterogeneity in human hippocampus measured by arterial spin labeling MRI. NMR in biomedicine 2013;26(6):613-621.
Figures