0851
Proximal Femur Marrow Adipose Tissue Assessment Using 3T Multi-Parametric Chemical Shift Encoded MRI: Preliminary Results in Osteoporotic Patients1Department of Radiology, New York University School of Medicine, Bernard and Irene Schwartz Center for Biomedical Imaging, New York City, NY, United States, 2Université de Lyon; CREATIS CNRS UMR 5220, Inserm U1206, INSA-Lyon, UCBL Lyon 1, Villeurbanne, France
Synopsis
Recent assessment of osteoporosis by monovoxel magnetic resonance spectroscopy states interesting feature about subregional femoral marrow fat composition. in this study , we evaluate differences in bone marrow fat of the proximal femurs of controls and patients with OP using a novel quantitative multi-parametric MRI approach that provides information about fat content, fatty acid composition, transverse relaxation and internal magnetic susceptibility.
Introduction
Osteoporosis (OP) is a bone disease which affects more than 200 million people worldwide. It is characterized by microstructural deterioration of bone tissue and reduced bone mass leading to increased bone fragility and fracture risk. Assessment of such risk is currently made using x-ray based modalities, which require the administration of ionizing radiation and are limited in terms of their ability to assess the composition of bone Marrow Adipose Tissue (bMAT). The latter is important as there is evidence suggesting a role for bMAT - especially in terms of its quantity and composition - as a biomarker of OP. For example, decreased bMAT unsaturation in the femoral neck in OP (as assessed by MRS) has been described1,2,3. Additional recent studies show that bMAT composition can be attributed to two main types of adipocytes which form regulated (rMAT) and constitutive (cMAT) marrow adipose tissue and are associated with bone loss and OP4,5. Our aim in this study was to evaluate differences in bMAT in the proximal femurs of controls and patients with OP using a novel quantitative multi-parametric MRI approach that provides information about fat content, fatty acid composition, transverse relaxation and internal magnetic susceptibility.
Methods
This study had institutional review board approval, and we obtained written informed consent from all subjects. We performed MRI of the pelvis of healthy controls (n=9, 25.8 ± 3.6y, no history of fragility fracture) and osteoporotic patients (n=6, 58.4 ± 5.6y, n=3 with history of fragility fracture and n=3 with low bone mineral density by dual-energy x-ray absorptiometry (DXA)) using a Siemens Magnetom Prisma 3.0T system (Siemens healthcare, Erlangen, Germany) using a 3D spoiled gradient echo sequence with a 12 echo train length (n × 1.2 ms) and flyblack readout gradient. TR/FA = 16ms/5° and BW= 2000 Hz/px. 32 coronal slices were acquired. Total acquisition time was ~4min. Image reconstruction: Phase images were unwrapped beforehand to compute the $$$ B_0 $$$ field inhomogeneities ($$$ \triangle B_0 $$$) map and the $$$ \triangle B_0 $$$-demodulated real part images from which fat-water separation was done (giving the water only, fat only, PDFF and T2* maps) and fatty acid composition quantification (i.e. saturated (SFA) and unsaturated UFAs: monounsaturated (MUFA) and polyunsaturated (PUFA)) was performed; as described in Leporq et al6. From the $$$ \triangle B_0$$$ map, external ($$$B_{out}$$$) and internal field ($$$ B_{int} $$$) were separated using the projection unto dipole field7. From $$$B_{int}$$$, the dipole inversion was performed with a single orientation Bayesian regularization including spatial priors derived from magnitude images for the boundary conditions, error and smoothness weighting to compute the internal magnetic susceptibility (χint) map8. 3-cluster 3D bone segmentation: From the fat only central image, an active contour was automatically employed to segment bMAT. From this latter, another active contour was applied on the water only image to segment the cortical bone. Active contours were propagated from central to distal sections to obtain a 2-cluster (cortical bone and bMAT) 3D mask. From the 3D bMAT-masked PDFF map, a k-means algorithm (with k=2) was used to clustered rMAT and cMAT. Overall, a 3-cluster 3D (cortical bone, rMAT, cMAT) segmentation mask was automatically obtained. For each parameter, mean-values were stratified according to the group and differences between controls and patients were investigated using the non-parametric mann-whitney test. A p-value <0.05 was considered as significant.
Results
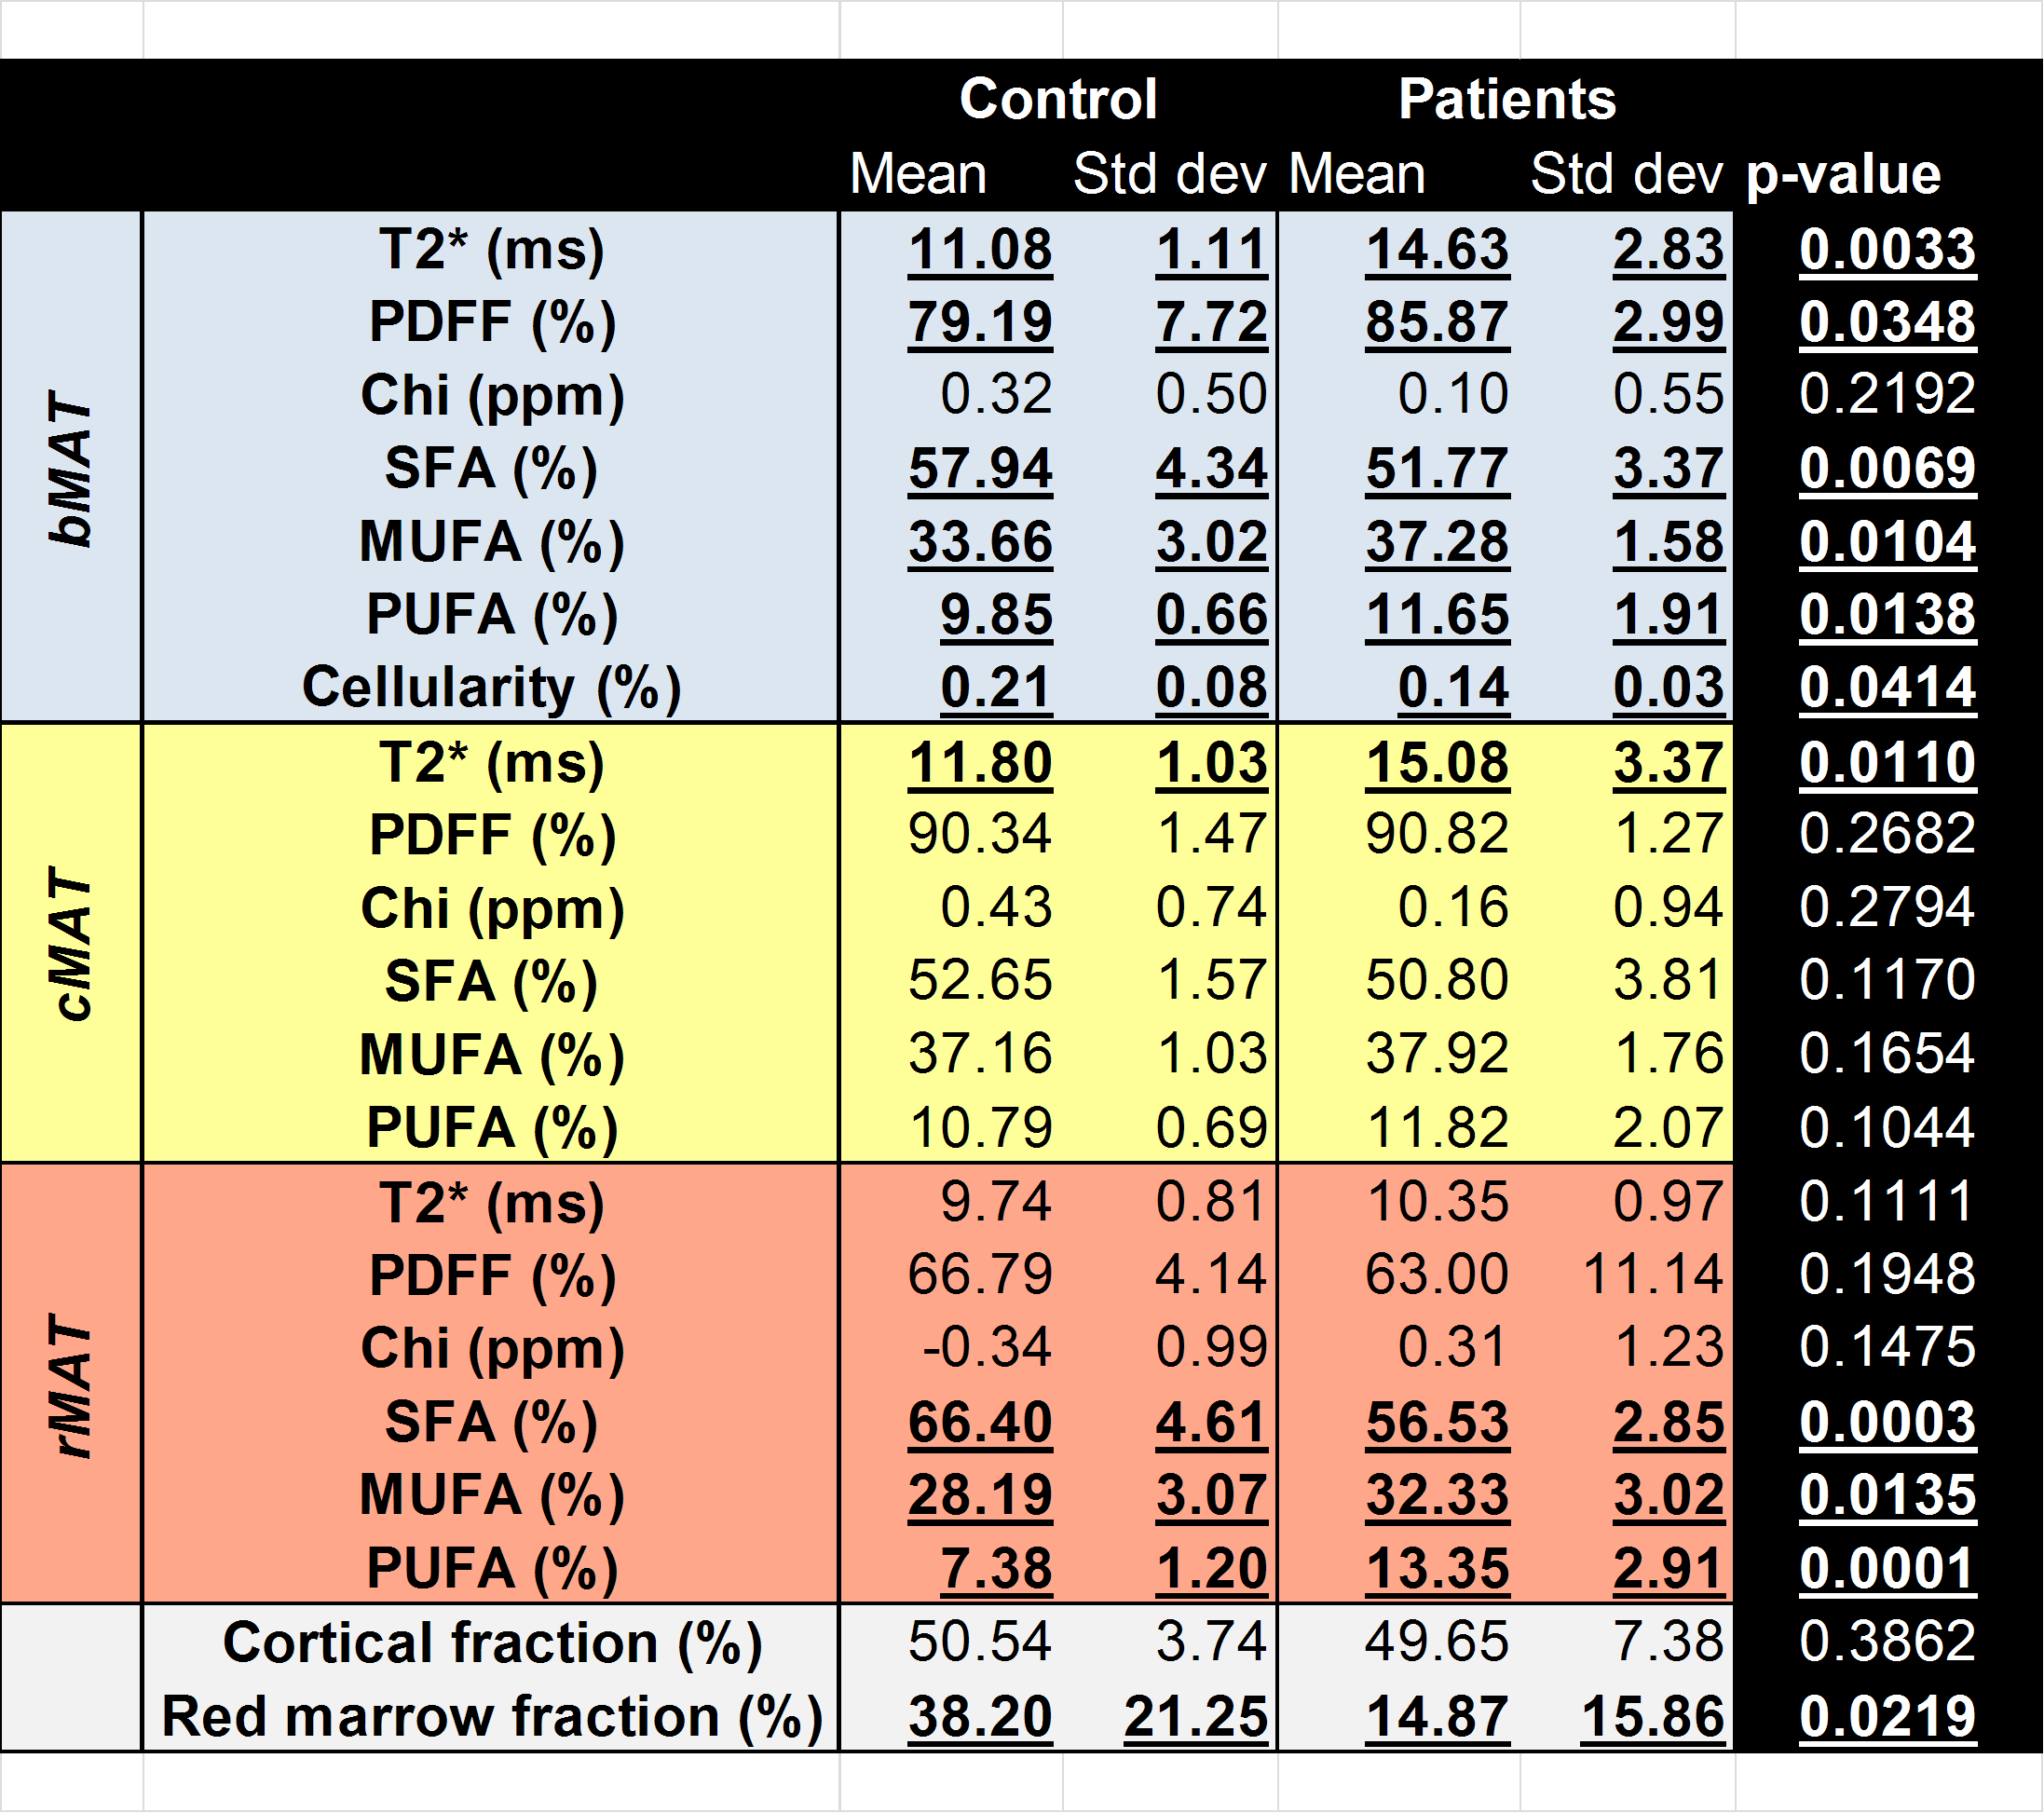
Image reconstruction process and example of parametric maps are presented in Figure 1. Results are summarized in Figure 2. There were significant differences between groups with osteoporotic patients having a global decrease in SFA (-5%) and increase in UFAs (+6%). T2* also present differences with an increase of 6ms. These changes in bMAT are hold mainly by the rMAT whereas cMAT only changes is about T2*. No differences in term of composition between the left and right proximal femurs were found.Discussion/Conclusion
This study found significant differences between patients and controls in terms of the composition and quantity of marrow fat present. From the literature, differences in fat composition are mainly due to rMAT which compared to cMAT is the most active. Our results suggest that it may be possible to estimate the respective proportion of cMAT and rMAT and, for each, to quantify the lipid level and fatty acid composition as well as transverse relaxation time and internal magnetic susceptibility in the whole hip bone using CSE multi-parametric imaging. As suggested by differences between controls and osteoporotic patients, CSE multi-parametric imaging might provide relevant biomarkers of osteoporosis. Further studies in a larger group of subjects are necessary to confirm these preliminary results.
Acknowledgements
No acknowledgement found.References
1.David K.W. Yeung et al., “Osteoporosis Is Associated with Increased Marrow Fat Content and Decreased Marrow Fat Unsaturation: A Proton MR Spectroscopy Study,” Journal of Magnetic Resonance Imaging 22, no. 2 (August 2005): 279–85, doi:10.1002/jmri.20367.
2.Vittorio Pansini et al., “3 Tesla 1 H MR Spectroscopy of Hip Bone Marrow in a Healthy Population, Assessment of Normal Fat Content Values and Influence of Age and Sex: 3 Tesla 1 H MR Spectroscopy of the Hip,” Journal of Magnetic Resonance Imaging 39, no. 2 (February 2014): 369–76, doi:10.1002/jmri.24176.
3.Giulia Di Pietro et al., “Bone Marrow Lipid Profiles from Peripheral Skeleton as Potential Biomarkers for Osteoporosis: A 1H-MR Spectroscopy Study,” Academic Radiology 23, no. 3 (March 2016): 273–83, doi:10.1016/j.acra.2015.11.009.
4.Erica L. Scheller and Clifford J. Rosen, “What’s the Matter with MAT? Marrow Adipose Tissue, Metabolism, and Skeletal Health,” Annals of the New York Academy of Sciences 1311, no. 1 (April 1, 2014): 14–30, doi:10.1111/nyas.12327.
5.Erica L. Scheller et al., “Region-Specific Variation in the Properties of Skeletal Adipocytes Reveals Regulated and Constitutive Marrow Adipose Tissues,” Nature Communications 6 (August 6, 2015): 7808, doi:10.1038/ncomms8808.
6.Benjamin Leporq et al., “Quantification of the Triglyceride Fatty Acid Composition with 3.0 T MRI,” NMR in Biomedicine 27, no. 10 (October 1, 2014): 1211–21, doi:10.1002/nbm.3175.
7.Tian Liu et al., “A Novel Background Field Removal Method for MRI Using Projection onto Dipole Fields (PDF),” NMR in Biomedicine 24, no. 9 (November 2011): 1129–36, doi:10.1002/nbm.1670.
8.Ludovic de Rochefort et al., “Quantitative Susceptibility Map Reconstruction from MR Phase Data Using Bayesian Regularization: Validation and Application to Brain Imaging,” Magnetic Resonance in Medicine 63, no. 1 (January 1, 2010): 194–206, doi:10.1002/mrm.22187.
Figures